-
View Larger Image
Welcome to the Artificial Intelligence Outlook for Forex trading.
VIDEO TRANSCRIPT
SPDR SPY ETF ($SPY)
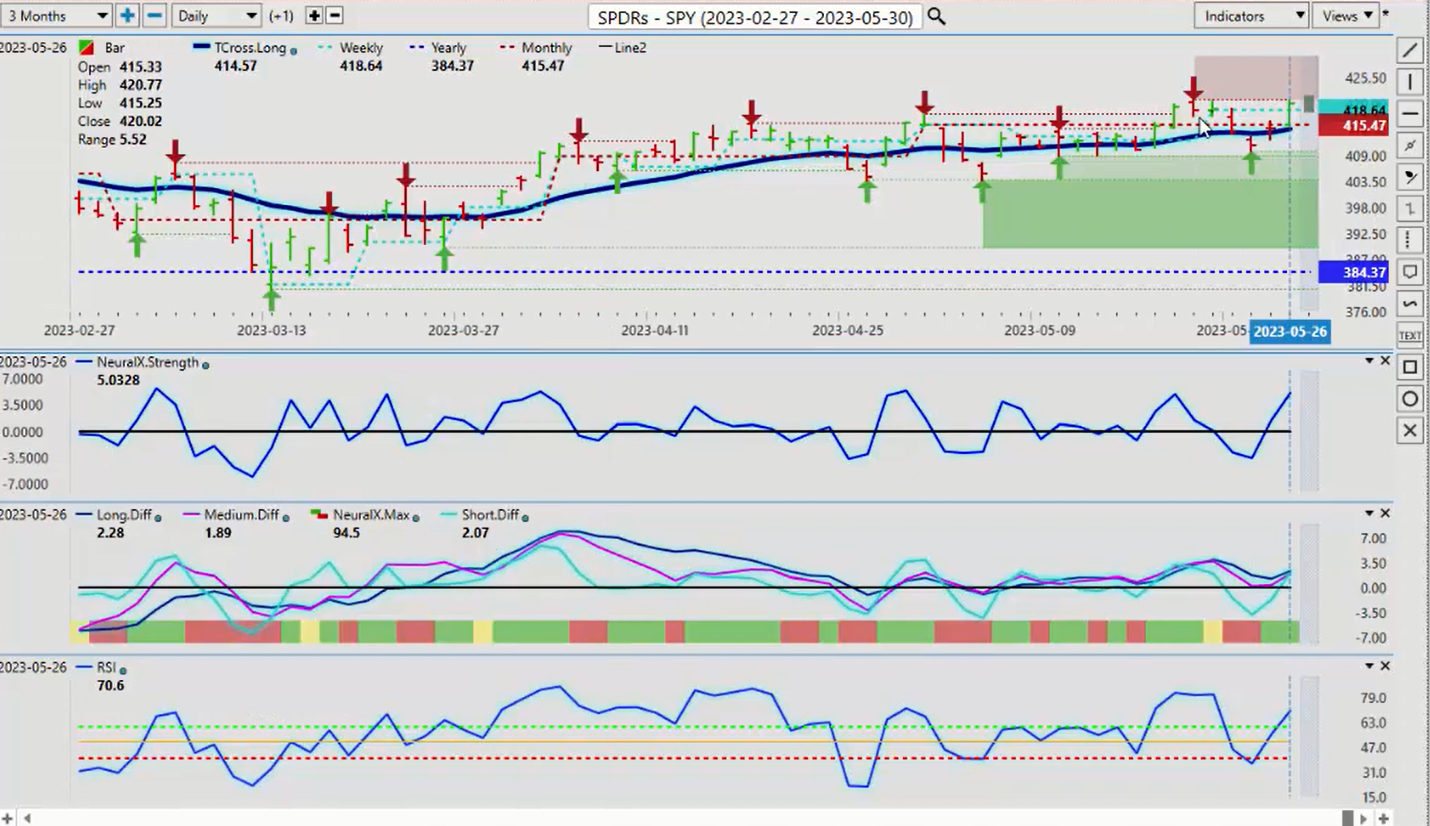
Hello, everyone, and welcome back. My name is Greg Firman, and this is the VantagePoint AI Market Outlook for the week of May the 29th, 2023. Now to get started this week, we’re going to begin with an accurate look at the broader market. We can see here at the SPYs the last five days, returns are actually not negative. They’re positive by 2.9%. The bulk of those gains coming actually on Friday. When we use an accurate weekly opening price, we can see that the market uses the weekly opening price to leverage itself, either up or down, usually starting at the beginning of the week. Right off the start of the week, the S&P 500 took a pretty… And the SPYs, excuse me, both took a pretty strong move to the downside only to rebound after the Fed Minutes.
But again, looking at that, an accurate look of what the performance was over the last five days from the first of the week to the end of the week, we’re actually ending the week positive. When we look at a 30-day period, we always want to make sure that we’re getting an accurate read on that. If we take from the start of May to where we’re currently at, the SPYs are running only at up about 1.09%. When we use our VantagePoint software, we actually have a tool here that we can use, the point in time indicator, which again accurately measures your starting point at the beginning of each week, at the beginning of each month, and even at the beginning of each year. When we look at this very quickly, we can see that the yearly opening price 384.37, the monthly opening price, 415. 47, and the weekly opening price at 418.64.
Again, a very accurate way of looking at a true one-month performance. We’re literally only up 1.09%, and on the five-day period, we’re up just a mere 0.29%, and we have a verified resistance high that’s coming in at or about this particular newly formed verified zone high is at 420.72. Now, a lot of issues going on right now with the US debt ceiling. The inflation data still could see the fed hike again. The SPYs and the S&P 500 really do need to get moving out of here. But again, the performance, there is not really the strongest over the month of May when we take an accurate look at those performance levels. Now when we look at it from a year-over-year basis, starting again from January 1st, then we can measure from January 1st to Friday’s close. Then we can see that looks a little bit better at 8.66% is what we’re up in the month of May.
Again, the month end flows coming into the market are helping it out, I would argue to some degree. But again, we’re more or less, I would argue, running in a channel in this area, and we need a clean break for stocks to really accelerate higher.
U.S. Dollar Index
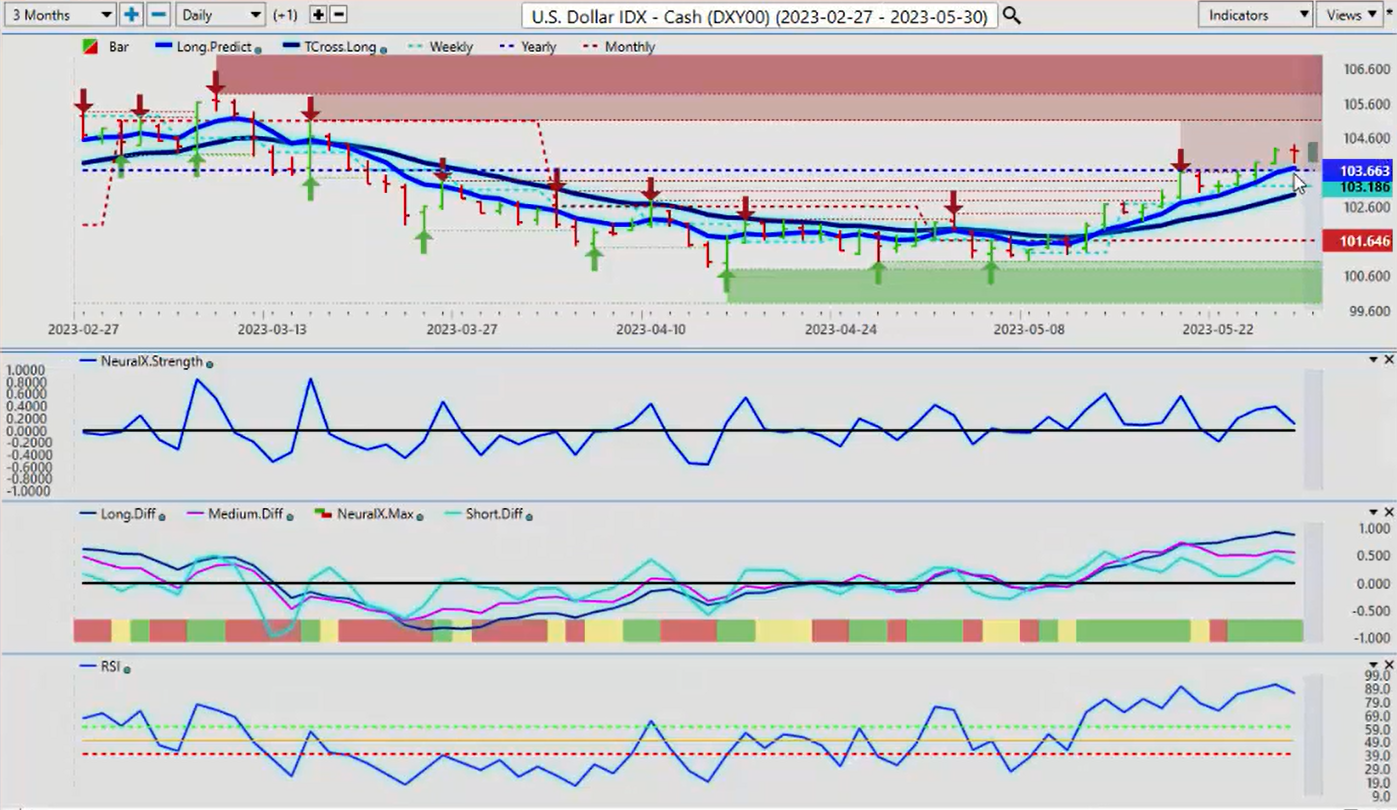
Now, the dollar index, again pushing through its yearly opening price over the last couple of days, which we anticipated based around the VantagePoint indicators. This strength in the dollar started back here on about May 11th, but you can see that we’ve stalled multiple days in a row and failing at that all important, accurate yearly opening price. Now the push here, we’ve got additional verified resistance. That area coming at the high of 105.10. It is possible that we will get to that level, but in most cases the dollar is strong at this time of the month and into the first week of the new month.
Then we usually sell off the week after the non-farm payroll number. Again, the fed’s going to be watching that payroll number very, very closely. Now, the divergence we would look for here is our neural index strength, while the market is going higher, the neural index strength is actually turning down. Our predicted RSI, 91.8, we’re starting to lose momentum here. You can see that turning down also, but our key support level is going to be currently that all important yearly opening price at 103.66. If this is a true rally in the dollar, we must hold above that level, but be very, very cautious of a bull trap at these particular levels.
Gold
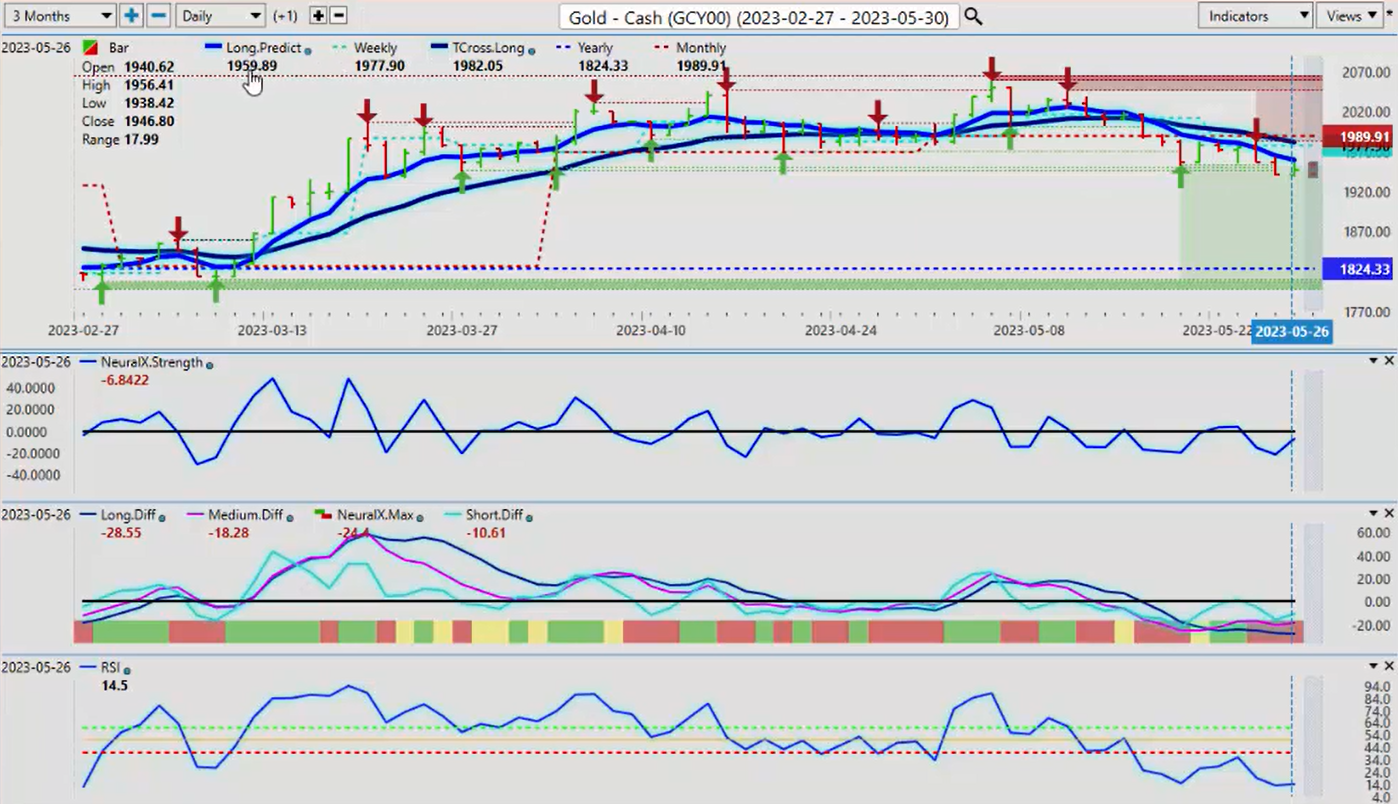
Now with gold prices, gold prices feeling that dollar strength moving lower, our key resistance areas going into the next week, 1982 is our TCross Long. Our Long Predict is coming in at 1959. But again, we’ve got a strong verified support, low coming in at 1950.
We would look to see if this area can hold. If we do hold above this particular level, then that would tell us we’ve got a bull trap setting up on the dollar index and gold is likely going to rebound. The recession fears are starting to back off a little bit here, but again, I’m still not convinced that we’re not going to see a global recession, particularly if these banks keep hiking the way they’ve been doing. Again, we’ll watch gold very closely. Once again, we can see our neural index strength is starting to turn back up. We have an MA death cross, which on this verified support low, which again warns us to be very, very cautious about shorting gold or buying dollars at these particular levels.
Crude Oil
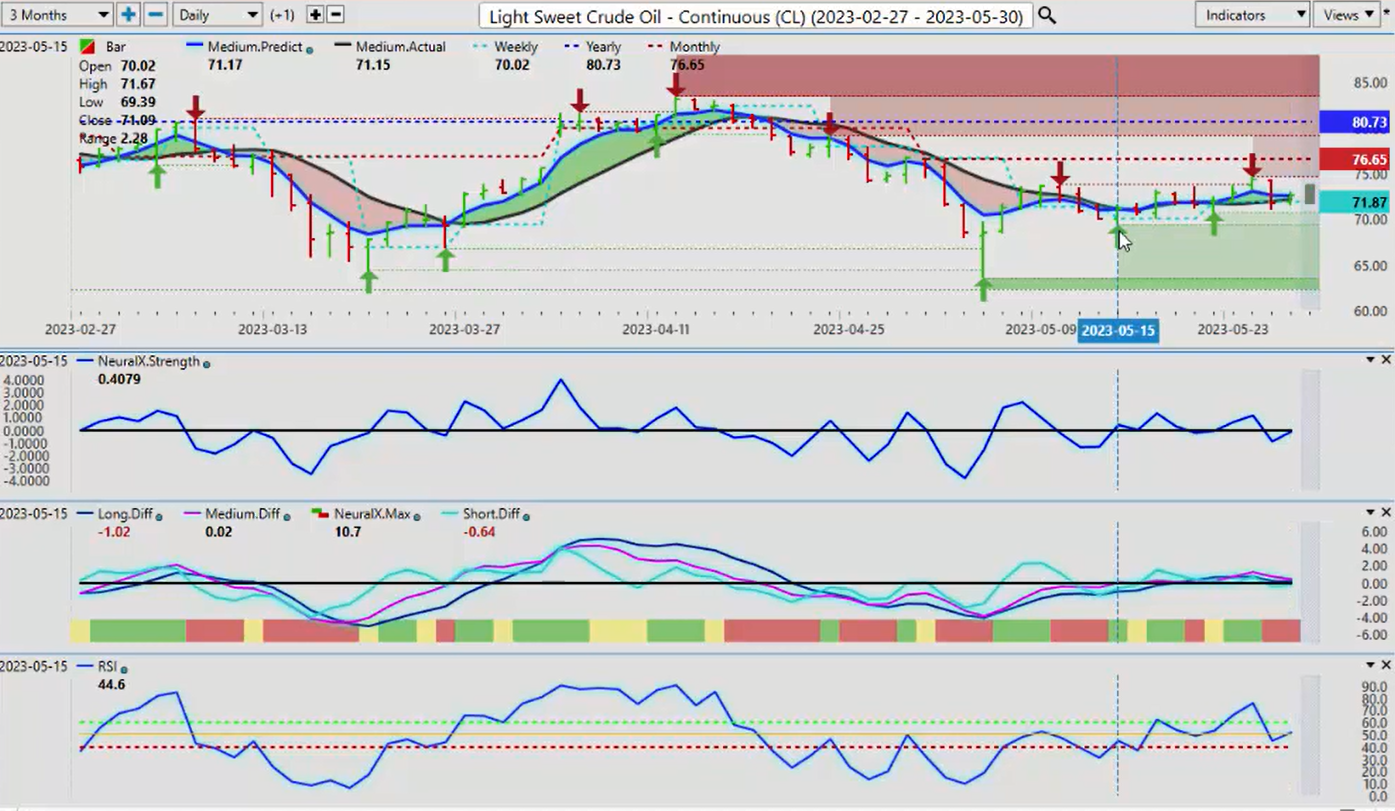
Now again, when we look at oil going into next week, oil continues to hold its ground here. We can assess we are still negative on the year, but we’re closing out the week at 72.67. Things still look pretty decent here for an advance, but we’ve got to get moving here. If the recession fears start to back off a little bit, that could fuel oil. But just a quick reminder, there is a strong seasonal pattern for oil that usually lasts until about the first week of July, so I would expect some further strength in these oil contracts. We can see using the predicted RSI. We’ve got that reverse check mark here, where basically it’s saying that we don’t have a lot of downward momentum here, so that’s warning that we could be looking to advance higher yet again.
Bitcoin
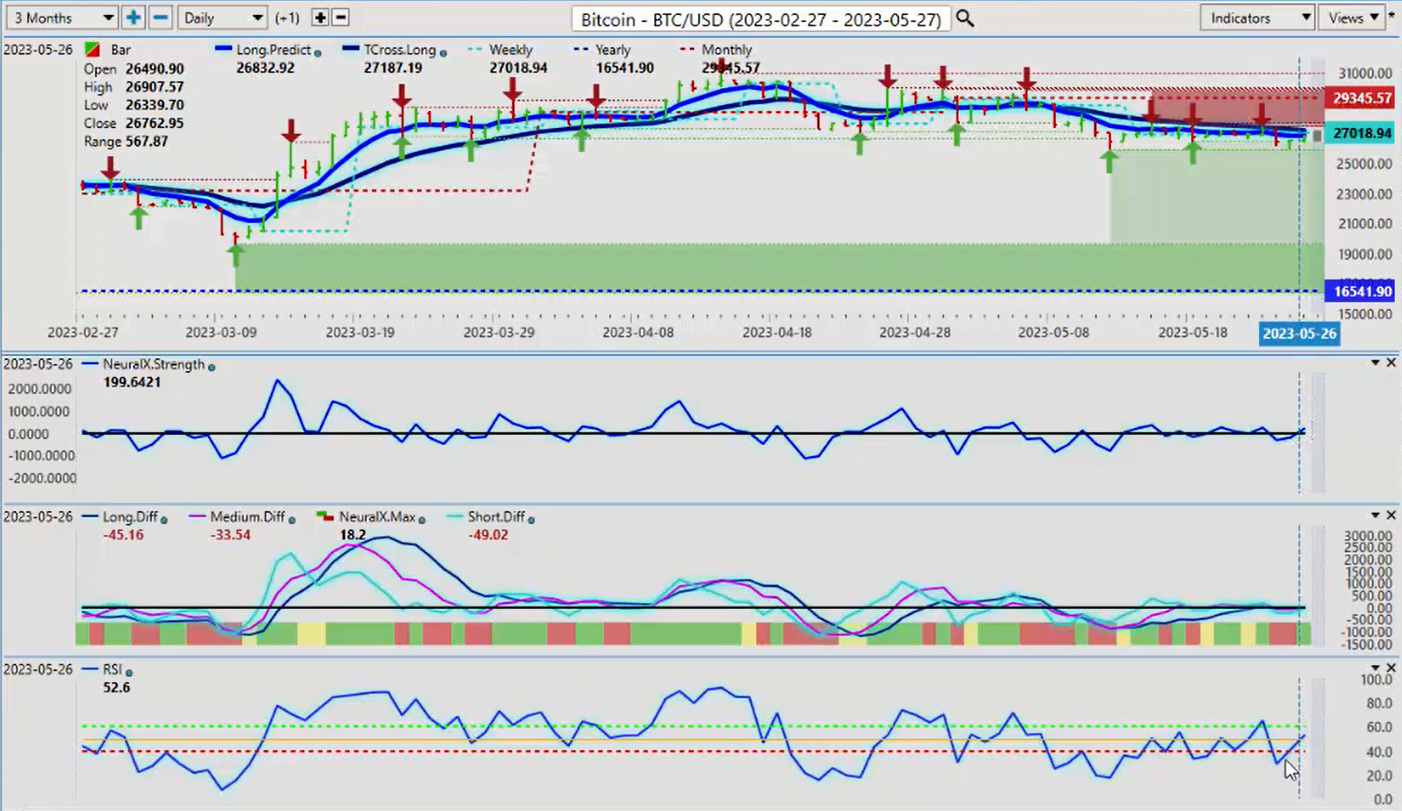
Now Bitcoin, once again from last week running along this verified support low that goes back to May the 12th, that low coming in at 25,881. You can see we’ve hit that multiple times last week, but we’re holding above here. Usually, we would see Bitcoin or I would see Bitcoin starting to rise towards the end of June. Again, watch for longs here. When we look at our predicted neural index strength, once again, you can see it starting to turn back up. The predicted RSI starting to move back up. Our predicted differences here are pretty much sideways, but our neural index and our neural index strength are warning that we’re seeing some buyers down here. Now, if stocks continue to advance, that will help bitcoin. But Bitcoin as of late, can rally with gold or it can rally with the major global indexes. These are things we would look very closely for, but our main resistance level, 27,187. The VantagePoint TCross Long. If we can get back up above that, then we should be able to target that monthly opening price back towards 29,345.
S&P 500 Index
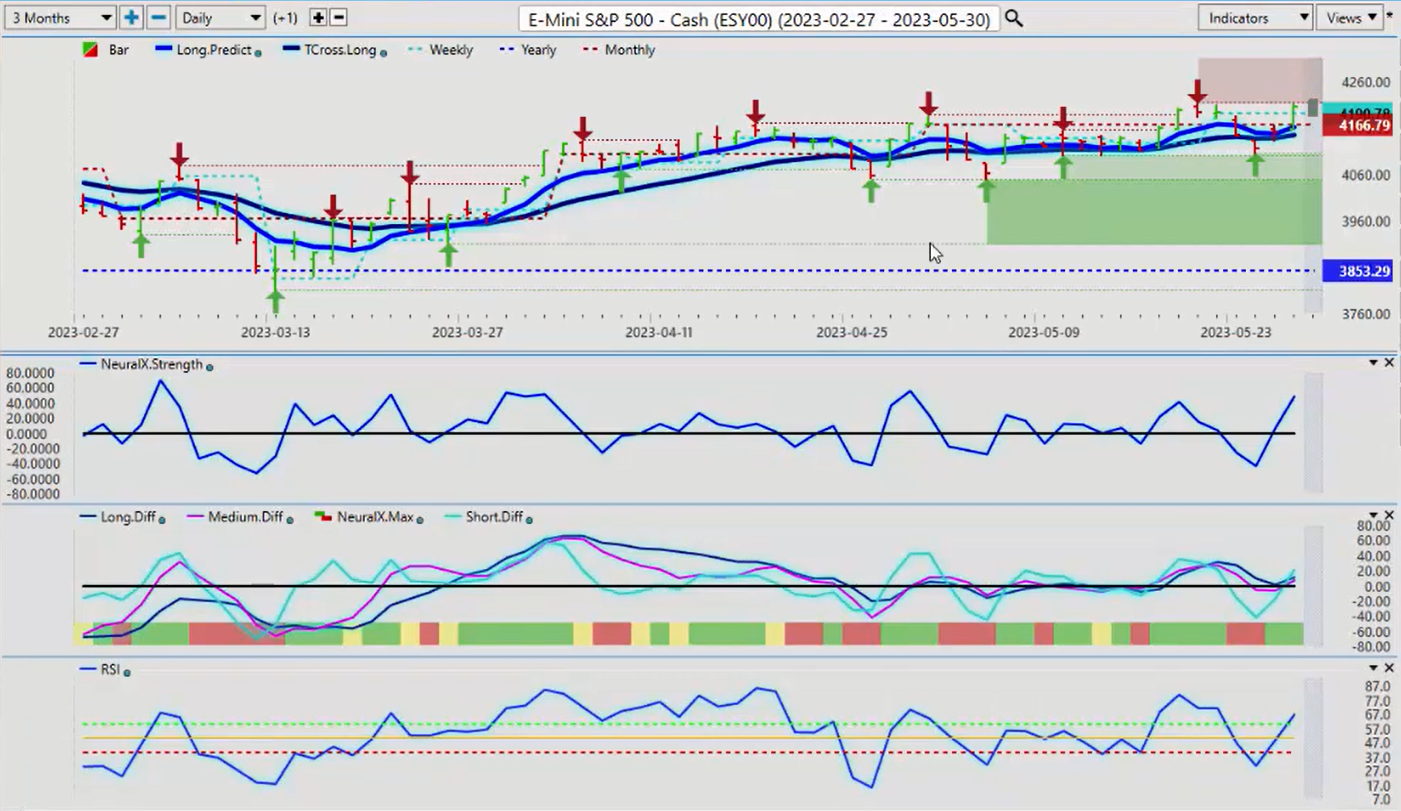
Now again, the S&P 500 mirrors the SPY contracts and again, it’s important that we’re using accurate levels and showing accurate monthly and five-day percentages, because again, when we look at the yearly opening price on the S&P 3853, we’ve come down, this is again just normal volatility around those Fed Minutes. As the Fed Minutes passed, we actually worked on this one in the VantagePoint live training room, and like I always say, whenever there’s a major announcement like that, wait for 24 to 36 hours before you do anything, because sure enough, after that period of time, the S&P recovers and then we extend gains into Friday. But once again, you can see this newly formed verified resistance high, 4204. We want to make a clean break of this area guys, and I think that is still going to be a relatively tall order going into next week if we’re anticipating further dollar strength.
Euro versus U.S. Dollar
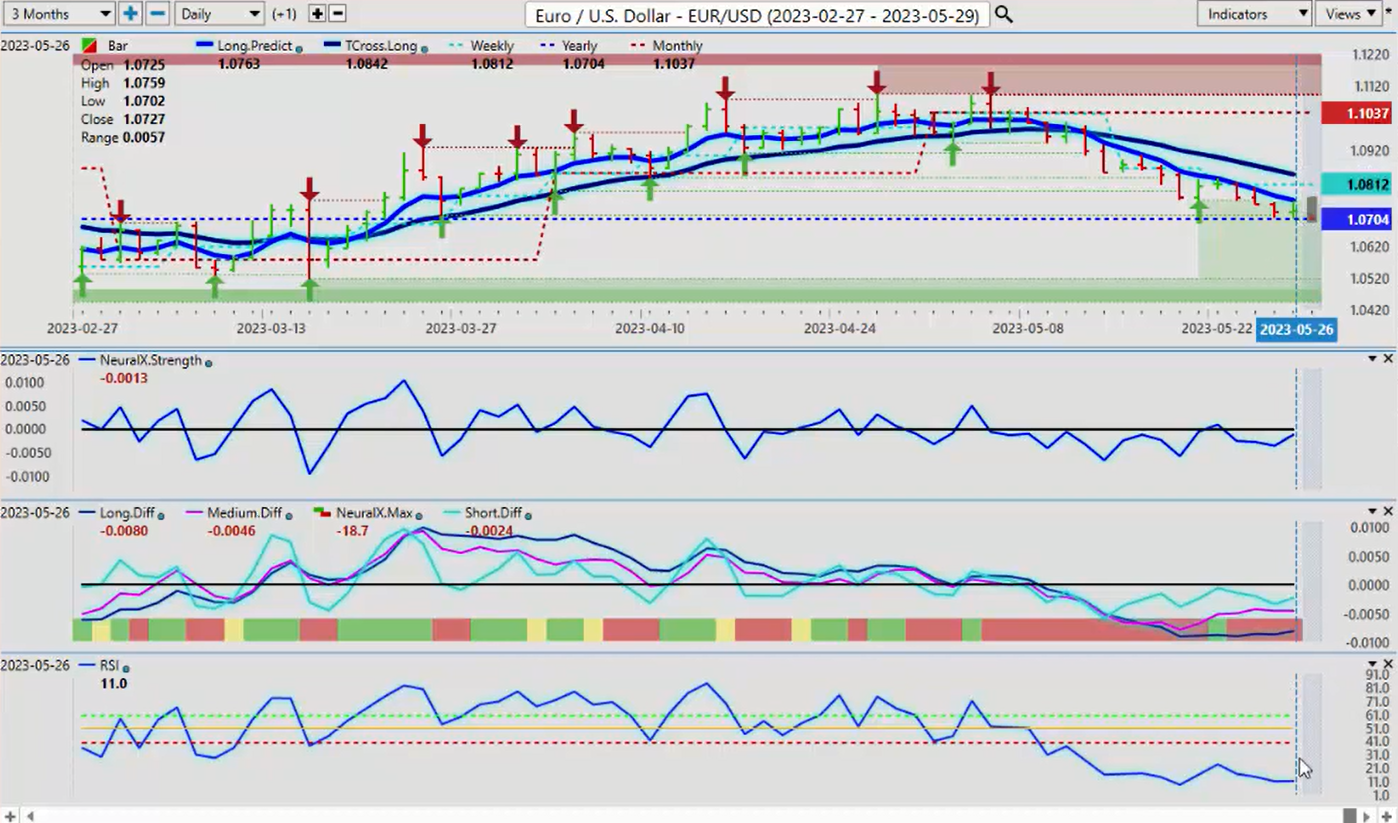
Now, as we look at some of our main pairs, again, Euro/USD pair is holding right along its yearly opening price, and I have to concede, I haven’t seen this before, where the dollar index is above its yearly opening price and year and the Euro/USD pair is also above its yearly opening price. This could be a warning, be very cautious of a bear trap. I do anticipate some further Euro weakness, but the question is, is it just going to be for a few days or a week? The VantagePoint indicators are already warning that prices starting to rise off of here. You’ve got a major support level. Again, I wouldn’t take aggressive shorts until we confirm that the dollar is going to hold onto these gains. In my respectful opinion only, it’s very unlikely, because the debt ceiling, we know that this is going to be resolved, and when it does, you get more of a risk-on scenario versus the current risk-off scenario we’re in now.
Watch this one very closely, but be very, very cost cautious shorting below 107, because the likelihood in the next week and a half or so, it goes higher either way.
U.S. Dollar versus Swiss Franc
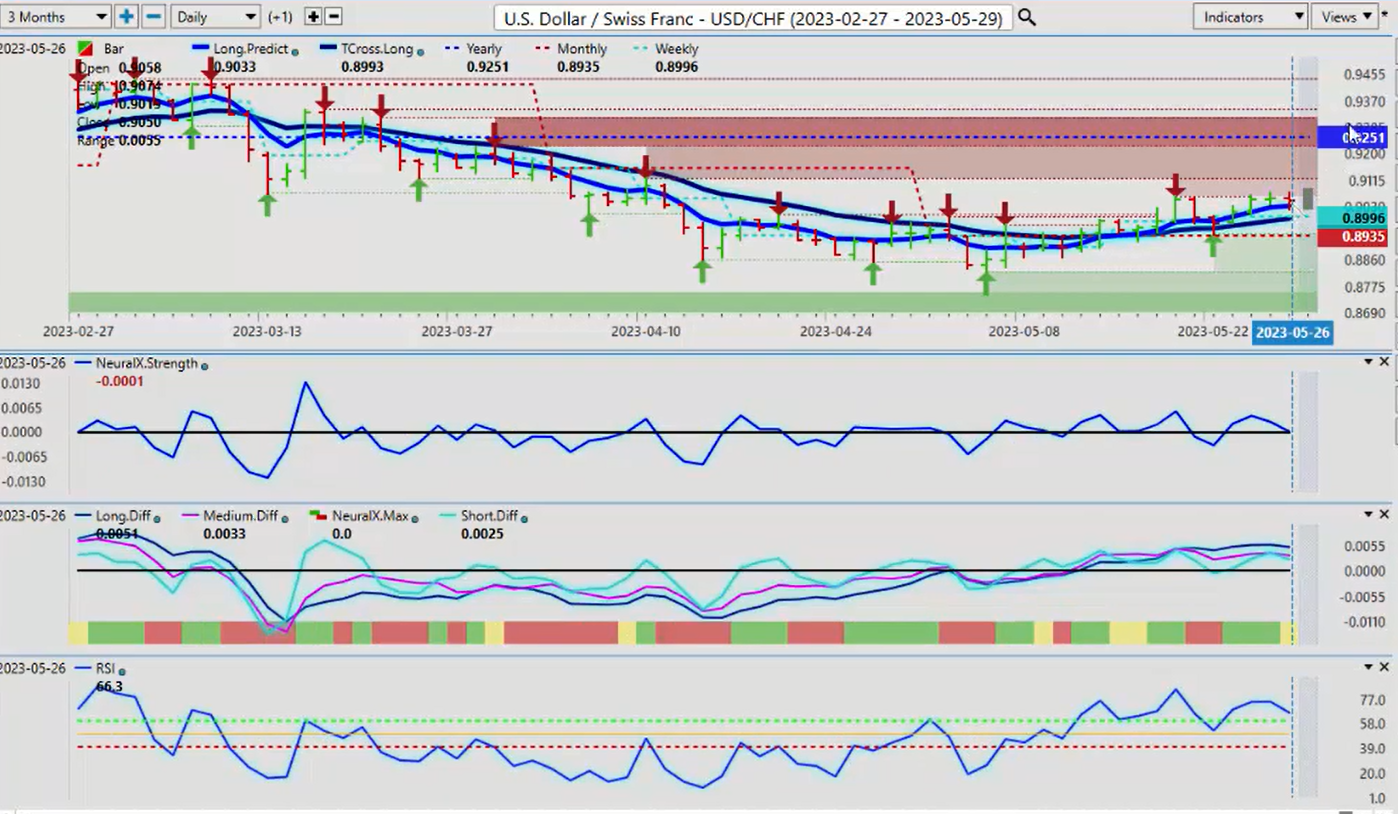
When we look at the US/CHF, we can see that again with this pair usually mirrors the dollar index, but once again, we can really see the depreciation of the US dollar. 92.51 is the yearly opening price. It’s an indisputable fact we are bearish on the calendar year. Again, we can’t say something as bullish if we’re negative on the year. We would continue to monitor this pair, but there is significant headways up here. The high 91.20, that’s in my opinion, would be the immediate area we would look for this week. We’ve also got, again, some resistance up here that would come in about 91.96. But unless we clear 92.51, then this is just corrective in nature. You can see these VantagePoint indicators already starting to roll the opposite direction in which the market’s been going.
That divergence based around the correlation to 31 other markets is exactly what we want to keep our eye on. Watch those verified zones, the immediate one, which I think they should be able to push through here, which is 90.63, but I think it will be very difficult to get above 92,51.
British Pound versus U.S. Dollar
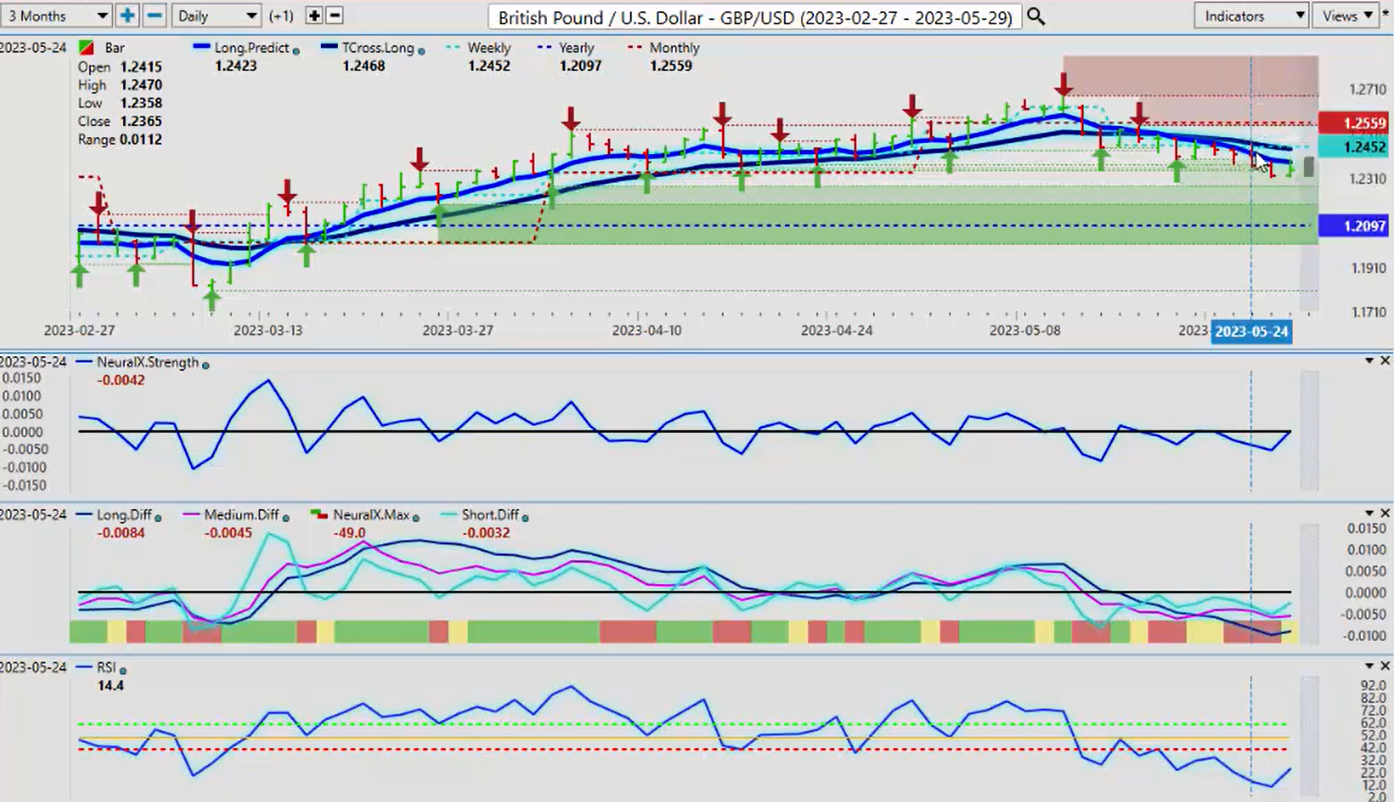
Now the British Pound this past week, there are really not a lot of buyers here this past week. Once again, when we look at the weekly opening price, an accurate measurement of where we are on the start of the week and the end of the week, guys. You can see that we start the week on the GBP/USD, and we see that the VantagePoint TCross Long and the VantagePoint Long Predicted. The two core predicted moving averages have slipped below that weekly opening price. We use that weekly opening price multiple days in a row.
Three days in a row, you can see we’ve hit that level to the number at 124.52. This is exactly why we don’t want to use lagging methodologies of picking a random five-day performance or a random 30-day performance. We want to measure at the start of the month, the start of the year, and the start of the week, and that’s into the VantagePoint point in time indicator, which is a fantastic tool to measure this, because if we’re negative on the week, then again that tells me that the bears are in control, so we use that and leverage that. The start of next week, if we’re closing this out at 123.48, then we would need to stay below 123.48. Just remember we’re a holiday short week. We’ve got a UK holiday and a US holiday, so be very, very cautious on Tuesday of next week, because that’s when you’re going to see price really moving around here when all markets come back in.
But use that accurate weekly opening and accurate monthly opening levels to dictate who’s in control of any given particular asset class that you’re trading. Right now, the British pound 120.97, we’re still positive on the year. This does appear to be a corrective move. We would wait for that dollar weakness to kick in, which is probably not going to be for at least another week or so, so I would expect some downside on this pair next week.
Japanese Yen
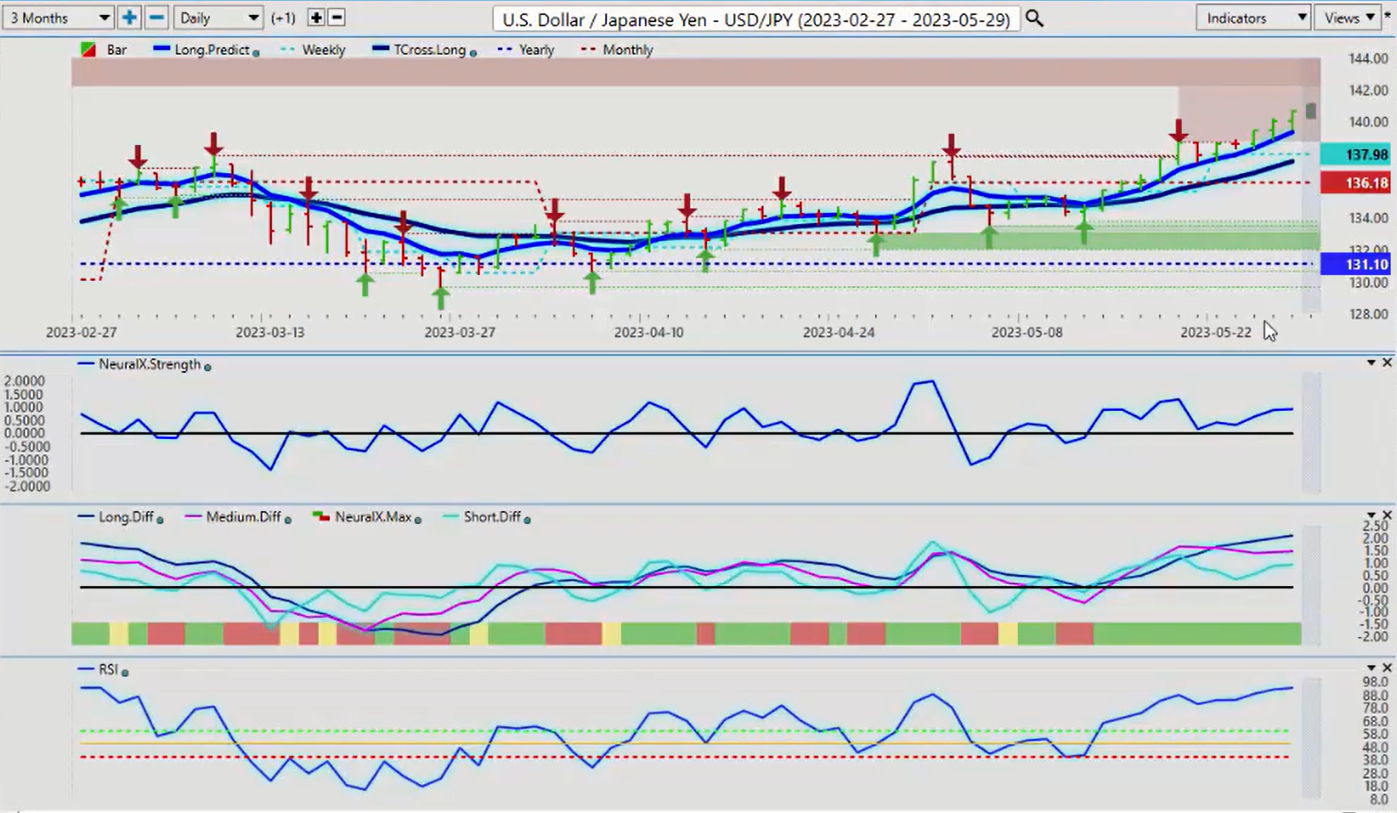
Now, the one pair of the dollar is it continues to shine, is against the Japanese yen. Once again, the interest rate differential, the carry trade simply doesn’t favor buying the yen against basically any G7 currency. But again, nothing just goes straight up and nothing goes straight down. We’ve broke through the most recent verified resistance high that coming in at or about 138.75.
That was a pretty big move and you can see from the Fed Minutes you’ve got three strong days of this moving up. Now, our predicted RSI 93.9, that’s a little concerning, and we do have an MA death cross, which is warning that the medium-term trend is not maybe as strong as what it appears to be, but again, shorts are very, very risky on a pair like this because of that interest rate differential continues to expand in favor of the dollar. But what I will say is the further we move away from the VantagePoint TCross Long at 137.52, the more likely it is we’re going to retrace. And again, this is not Fibonacci-related, it’s we’re simply going to run out of buyers here at some point. Again, we’ll watch these key levels, but it’s likely another week that is going to favor the dollar against the yen.
U.S. Dollar versus Canadian Dollar
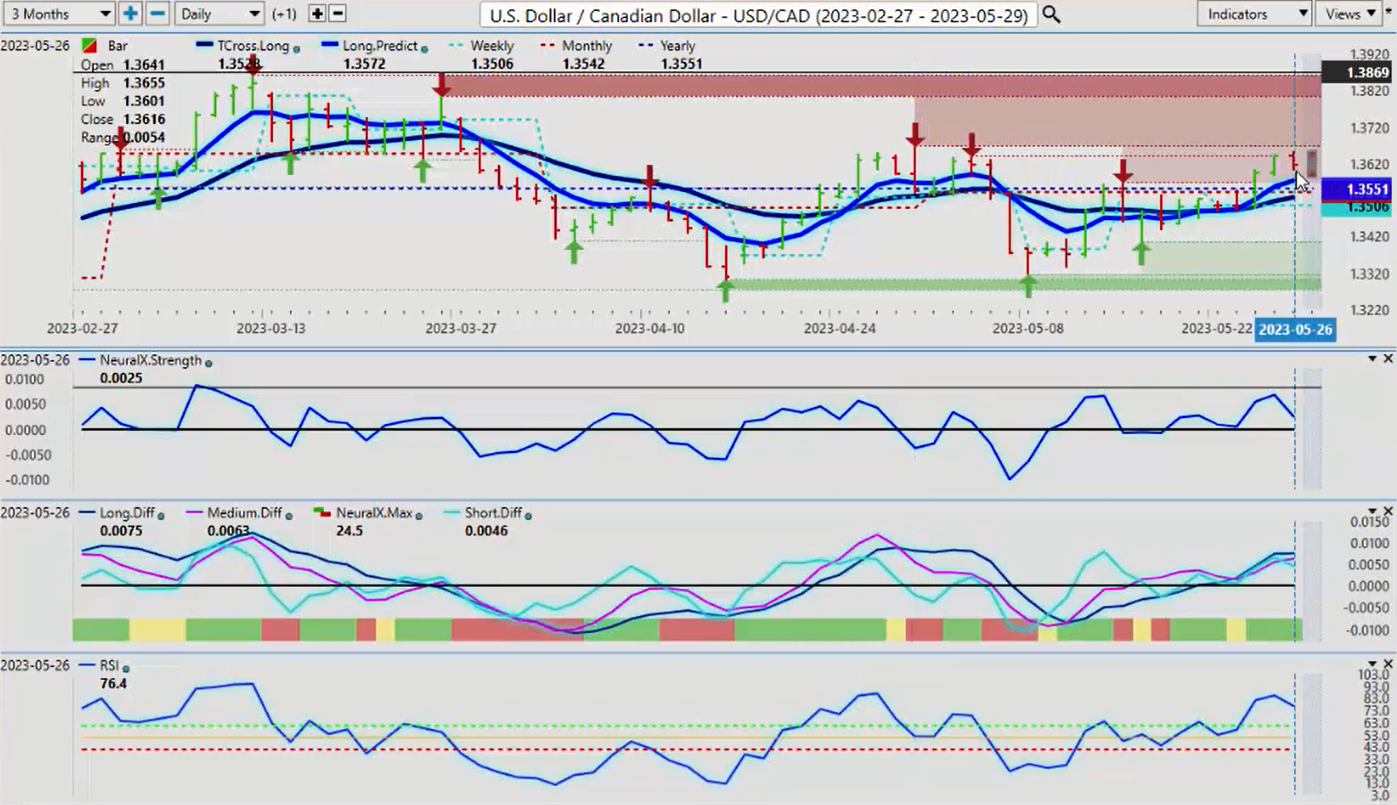
Now, when we look at some of our main equity-based currencies, the US/CAD to begin with. If we can get those oil prices continuing to advance here with the equity markets, then basically we would look at potentially a premium short on USD/CAD next week. Our verified resistance high 136,68, if we can get up that particular high, and oil prices and the stock markets remain firm, then there would be a very good short here. The US/Canadian pair is 100% inversely correlated to the S&P 500 and light suite crude oil, meaning the S&P 500 and oil go up US/Canada goes down. If stocks and oil continue to advance, your entry point here, you’re looking at again the 136.68. We’ve got some additional verified resistance right around that high of 136.45, but 20 pips, guys, is not enough to even bat an eye at.
The main thing is to identify that breakout point and be very careful of a bull trap up here. We’ve seen this many, many times before. Once again, that is the key level to watch next week. Now, if we can get stocks and a confirmed advance in stocks like again with the S&P 500 and the SPYs more specifically, those gains are nowhere near as strong as what was suggested. They’re actually pretty soft. They’re more or less flat up about 1% in the month, so they need to get moving right now.
Australian Dollar versus U.S. Dollar
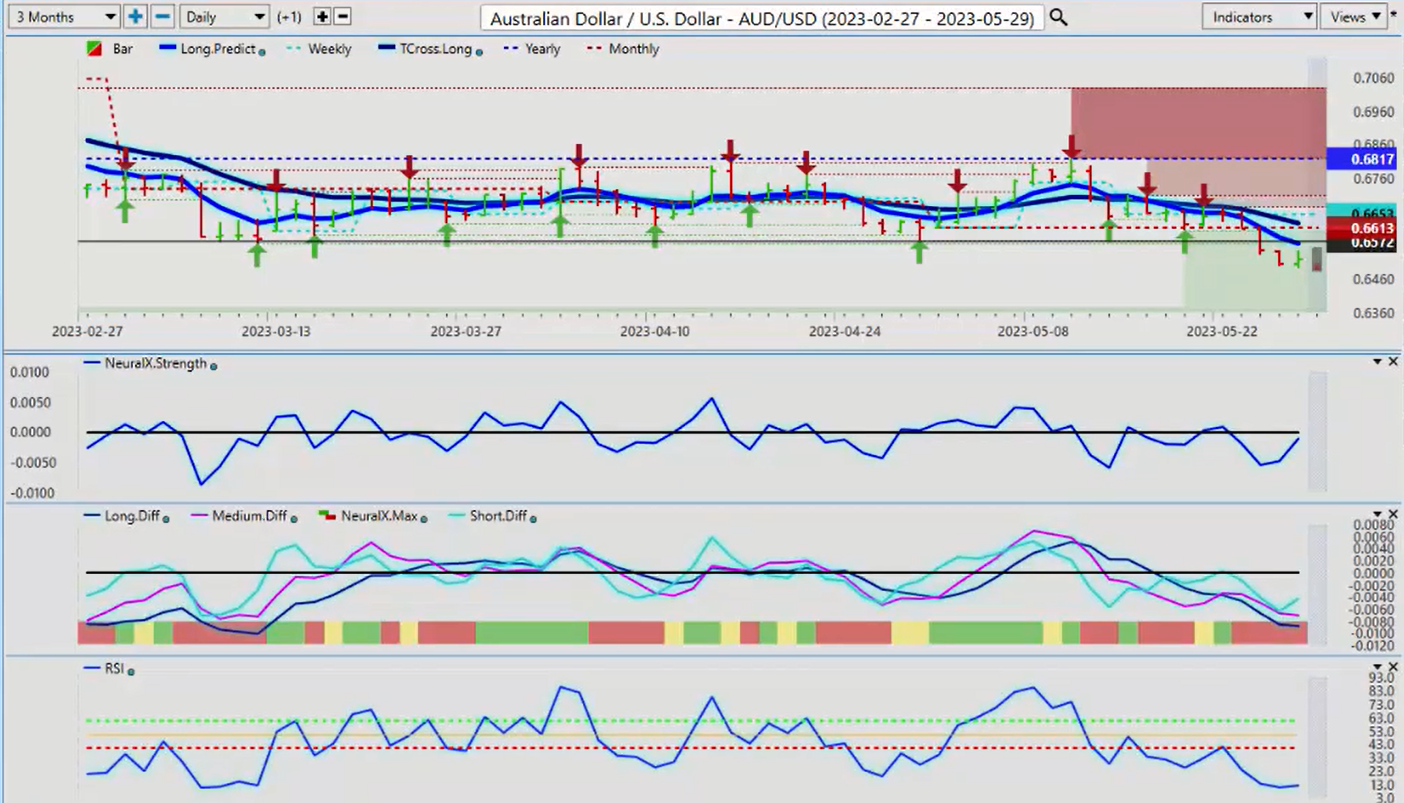
The Aussie continues to show very, very, very negative, I might add. If we can turn around in and keep these gains going, then the Aussie could be a very good place to be selling US dollars. But I don’t think that next week is going to be the perfect week for that unless we get the debt ceiling cleaned up and some of these other issues are off the table and money goes back mainly into stock.
The low here was 64.91. We’ll watch that to begin the week very clear carefully. The divergence in the VantagePoint indicators are what is critical to look at here. The market is going down, but the neural index strength, the actual strength, now you can see that the neural index is down, it’s red. But the neural inside the neural index, we can see the neural index, the actual strength, and it’s actually rising. This is another key warning sign that we want to be careful of a bear trap down here.
New Zealand Dollar versus U.S. Dollar
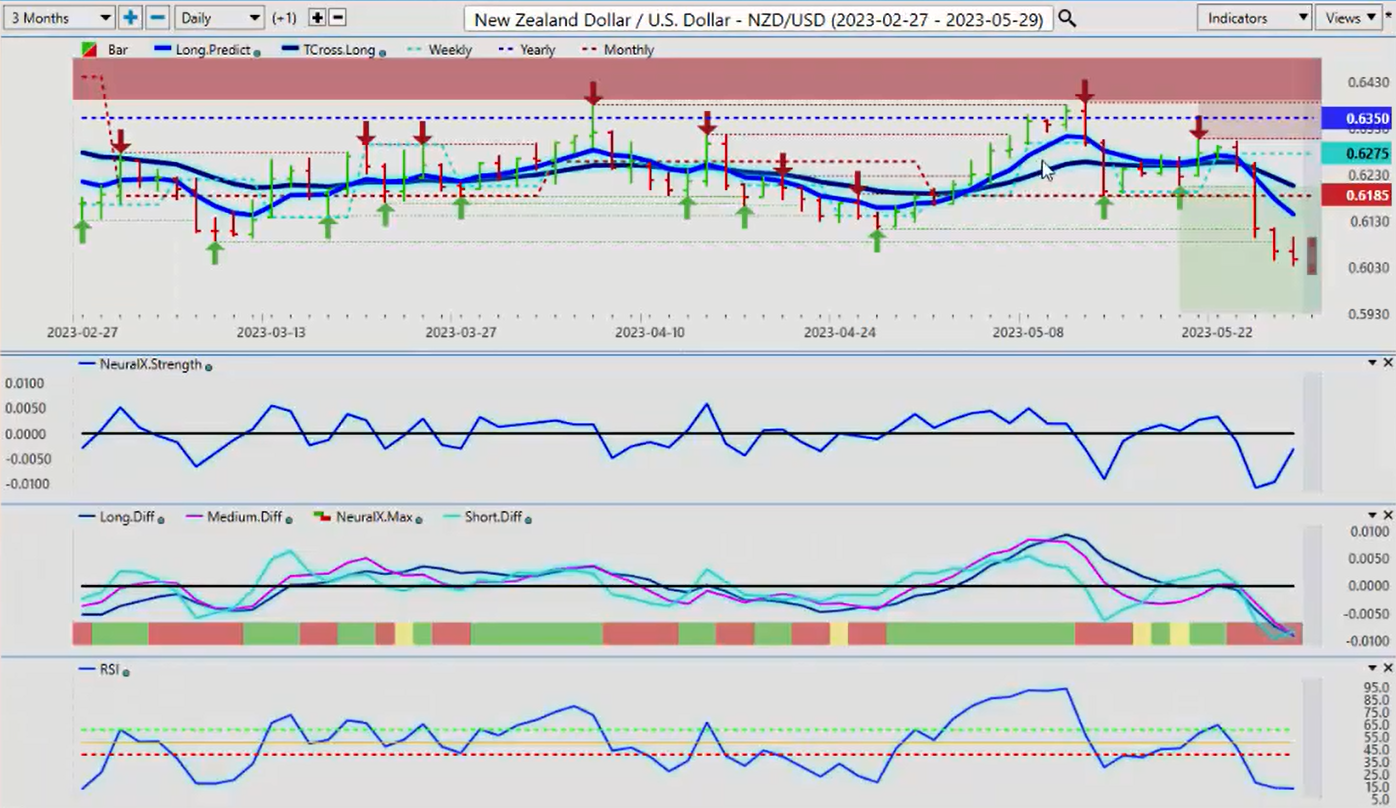
I would respectfully submit the same thing would apply to New Zealand. Now obviously with the Bank of New Zealand last week causing this volatility. But in most cases, again, we can see this divergence building here as the neural index strength actually bottoms out on March the 24th, we get a little bit more down pressure, but now the neural index strength is starting to turn and come back up. These are things that we look for.
Our predicted differences are beginning to bottom out. Our predicted RSI at 13.3. There’s a number of things warning us that were a matter of days, maybe a week at the most of a reversal on a number of these critical pairs. Again, expect volatility, a lot of volatility at the beginning of the week, because we’ve got a holiday short week, we’ve got the payroll number, and the Fed’s going to be watching all of these things. With that said, this is the VantagePoint AI Market Outlook for the week of May the 29th, 2023.