-
View Larger Image
Welcome to the Artificial Intelligence Outlook for Forex trading.
VIDEO TRANSCRIPT
Hello, everyone, and welcome back. My name is Greg Firman and this is the VantagePoint AI market outlook for the week of May the 15th, 2023. To start this week we’ll begin by looking at the broader market here.
As we can see with the spy’s here, they are not up 1% in this month. They’re actually down 0.96%. Again, it’s very important when we take a measurement point from performance standpoint that we start at the beginning of the month. When we look at the month of May, the spy’s have been negative the entire month.
Again, when we’re looking at price action, rolling performance, very much a lagging indicator when we use going back 30 days from the day we’re looking at. We want to make sure that we have a starting point. We have a lot of money flows coming in at the beginning of the month and the end of the month. And most performance measurements through the different investment funds, they’re measured on a month to month basis from a defined starting point.
If we use that defined starting point, we can see over the month of May, we are not up. We are significantly down actually, 1%. If we take the same measurement and measure this over a five-day period, you can see that we’ve got the weekly opening price here coming in at 412,97, and we haven’t been above it all week. The actual five-day performance of the spy’s, when we look at this accurately again, where we’ve closed on Friday, we’re actually not up. We’re actually down 0.34%.
Again, we want to make sure that we’re using the correct point when we start to look at the overall performance. Right now, we’ve got several verified resistance zones up here, the high right now, 417,62 with the US debt ceiling issues. This is putting more of a risk off mood into the market right now, which is sending this lower. This is likely corrective in nature.
We have a strong verified support low that’s been recently set, is actually on the 10th of May. The low point of that is 408,87. That’s the level we’ll watch for next week. We can see that we came down and retested this on Friday and then bounced up and closed back above the T-cross long. I don’t think the broader markets are done yet moving higher, but we want to keep an eye on this very, very closely at our T-cross long at 411. But more specifically guys, we have to make sure that we’re not using lagging tools like rolling performance because again, it paints a different picture, suggesting that the market’s up this month when it’s actually actually not.
Again, facts matter here. When we use these defined starting points each week, using the weekly and the monthly opening price, and then checking it and referencing the T-cross long and the yearly opening price, the primary trend is clearly up. You’ll remember back in March very similar. That rolling performance methodology led to a false sell signal here because we didn’t look at the fact that we’re not making any new lows here.
We’ve been climbing ever since basically mid-March, but this started far earlier than that. This started back here in around approximately October the 13th, where we haven’t put a low in since then. It’s important that we look at these levels and go back far enough on our charts. But the last thing we want to be doing is measuring performance on random dates. Because again, it can be very, very misleading and carry significant lag.
Again, we’ll watch this very closely. Now if we do a comparative to the SPY ETF, then we can see that the S&P 500 is essentially, I would argue more or less the exact same trade. Again, when we look at that S&P 500, we can see again a very similar situation going back into March. A very significant rally, up 7 0.8%.
But if we look at it from this particular week, it’s the same thing, guys. If we start, we look at the S&P 500 or the spies, you can pick whichever one you want, just understanding it’s the same trade. If we look at our opening point here to where we closed on Friday, then we get a very accurate viewpoint of where the market is. We’re down 1.07%.
Again, you’ve got to be very, very cautious where you’re picking your date as how you’re measuring performance. But we predominantly want to make sure we’re starting at the beginning of the week, the beginning of the month, not picking random five days back, random 30 days back.
Again, we’ve seen how lagging that particular methodology can be. For the S&P 500, same thing, our T-cross long 4113, we need to hold above this level. The indicators right now are actually bearish on this. You can see our neural indexes slipping lower, predicted differences are down. The predicted RSI at 38.8.
Now this modified predicted RSI. I’m not looking for an overbought or oversold. I’m looking for momentum in these markets because we’re in a momentum-based market. Again, that’s why we want to make sure that our performance levels are moved forward, not backwards, so we know exactly where we are. Right now, this is pointing to further losses in the S&P 500 to start the week. But first and foremost, it’s important to understand that we’re down on the month and we’re down on the week to begin with. These forecasts are in line with market conditions.
U.S. Dollar Index ($DXY)
Now, if we get some movement on the US debt ceiling, we get some agreement between the parties, then we could rebound very, very quickly and that’s something we would look for. But this week, coming week, again, I would argue for the remainder of this month, all eyes are going to be on the dollar index. If the dollar index is going up or recovering, then that will force most other markets and Forex payers down that are tied to the dollar.
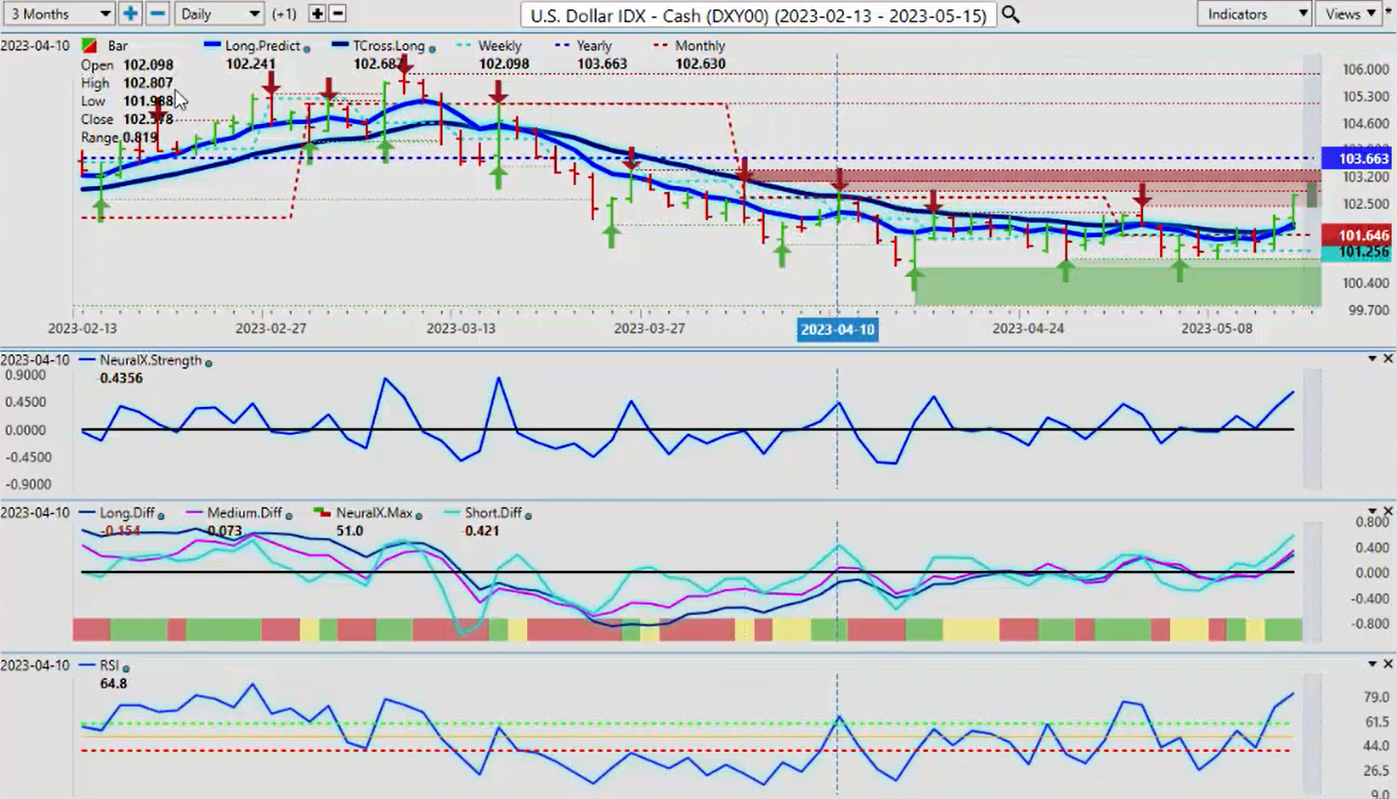
You can see that on these debt ceiling concerns, the dollar is gaining strength, but we’re pushing into a very significant verified resistance area at 12,80. Then we’ve got additional resistance at 103,05. Again, the immediate 102,80 is the one I would keep my eye on to start the week. Watch out for a bull trap up here because remember, we’re still firmly below our yearly opening price 103,66, the dollar not having a very good year at all.
And I don’t really see that improving once we get past the noise in the market of some of the economic data. But more specifically to we know they’re going to settle this debt ceiling. It’s not a question of if, it’s a question of when. And when that happens, the dollar should move lower and the broader markets move higher. But just remember, keep an eye on that.
Right now, the indicators are pointing higher on the dollar. Now we’ve had two holiday short weeks in a row and it has favored the dollar to some degree. We were in the holiday short week last week. We’ll keep an eye on these major resistance points next week because again, this is an outlook, guys. Not a recap of something that’s already happened. We’re looking at these critical levels and understanding how to apply them in our trading.
If we look at this in a simplified version, we have a verified resistance high at 102,80. We have additional verified resistance at 103,05. Then we have our most significant resistance point at 103,66. The theory here is we’re short while below these particular levels. Until such time if the dollar can break 103,66, then we start a new trend. I believe at this particular time that is incredibly unlikely.
Gold
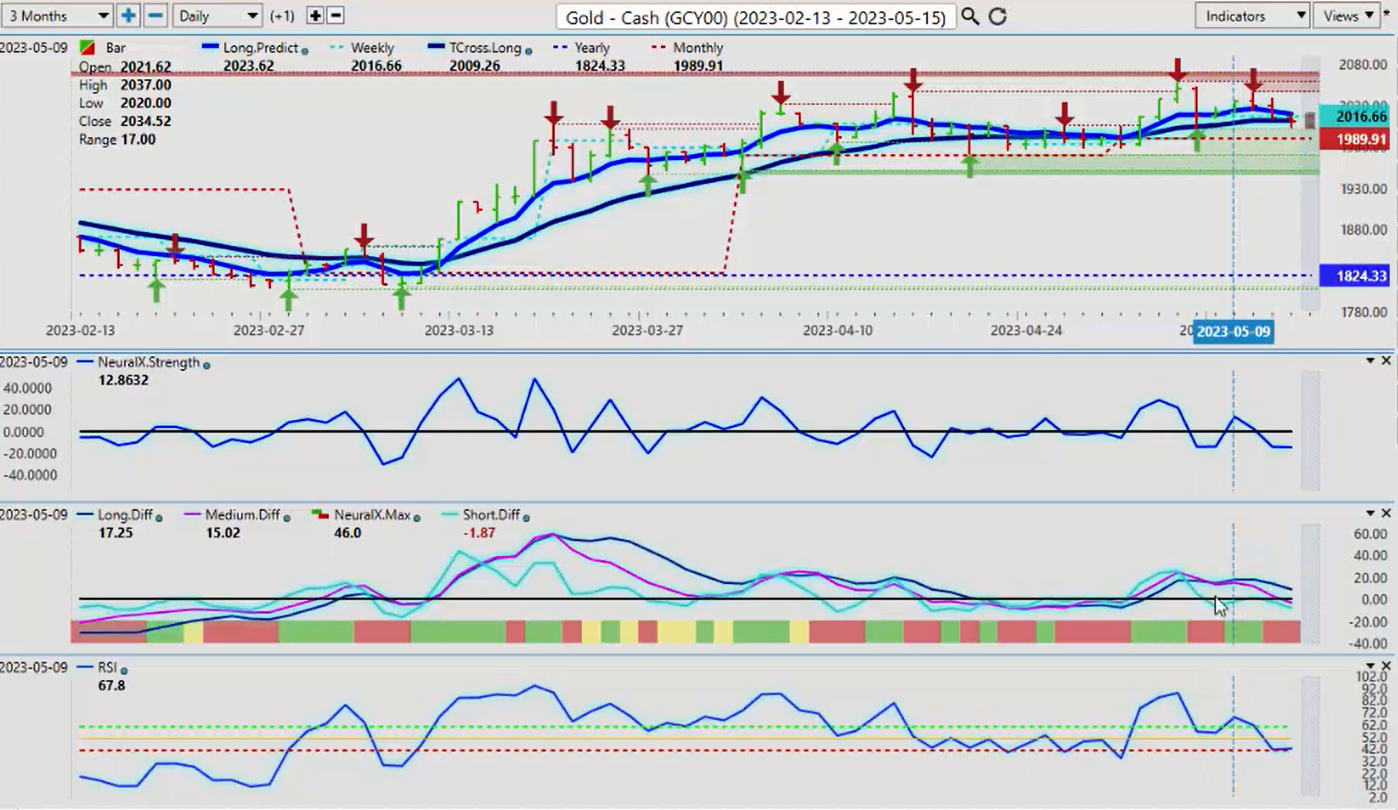
Now when we look at gold, gold obviously responding immediately to that dollar strength. Now the indicators here are MA div cross. This actually went off earlier in the week where we started losing momentum. Now in this particular case, you can see how the predicted RSI is not actually breaking down below the 40 level. It’s turned flat and it’s running sideways.
What that means, by using a modified RSI with a 60/40 split and moving your RSI from a 14 period to a nine period, we can speed this indicator up. We’re more focused on current price without getting a whole bunch of false signals. But for now, that predicted RSI is saying that we don’t have a lot of downward momentum here.
Our monthly low, 19,89, as long as we’re holding above the monthly. And once again, you can see here how important it is to use the starting point from the 1st of May, not 30 days back from this current date. That is no real relevance in anything, guys, other than tell us what happened 30 days ago. But again, when we’re looking at the current month, starting May 1st till now, gold is actually down a little bit from our high, but we’re still positive on the month, the monthly opening, 19,89, 19.
We’re looking to hold above this particular level. But either way, the yearly opening price 18,24, gold is still bullish for the most part. And even if the US did default on their debt, which I don’t think they will, I think the gold wins pretty much either way here for the most part.
Again, we’ll keep an eye on 19,89, see if we can hold this. But I would prefer that we get back up above the T-cross long at 2011 and stay above this particular level that will confirm that the uptrend is still fully intact.
Light Sweet Crude Oil
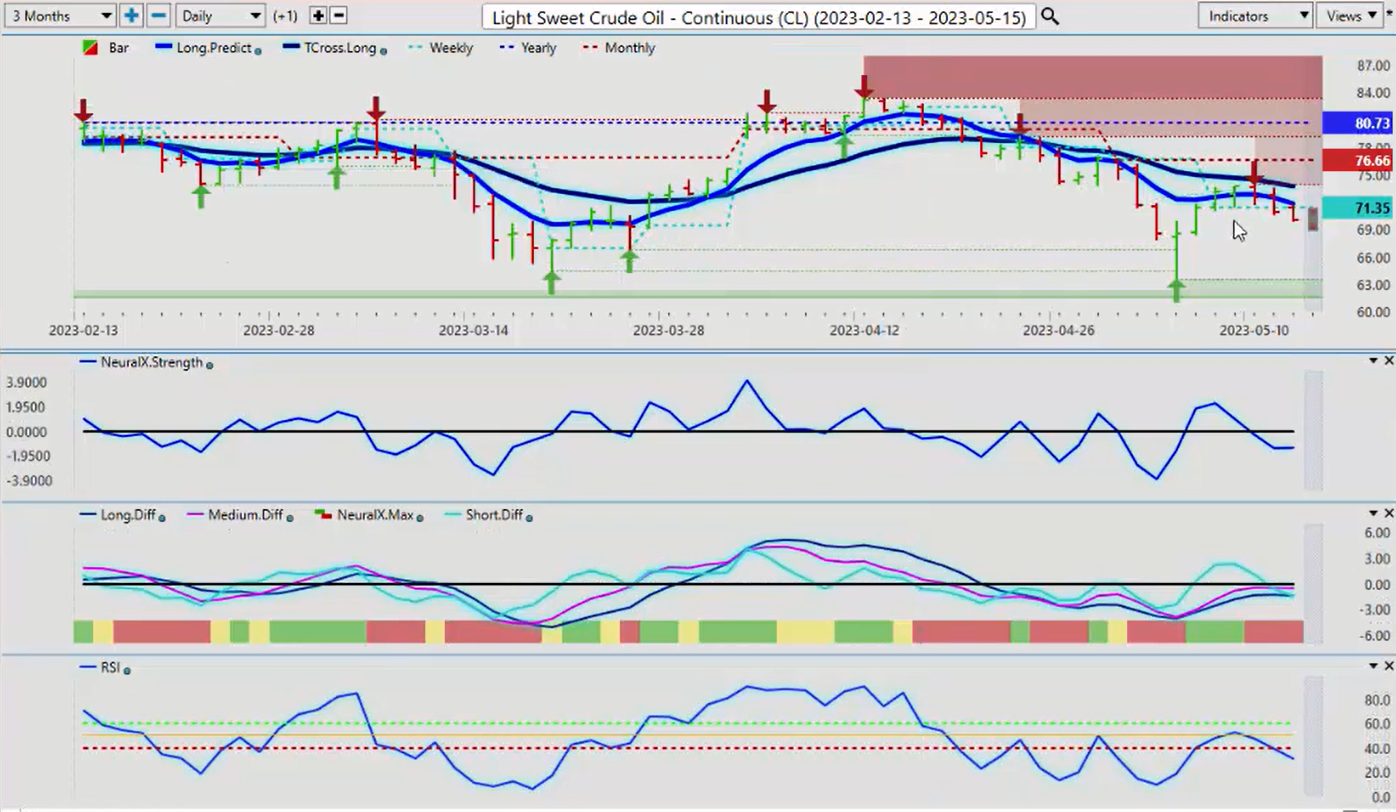
Now, when we look at light sweet crude going into next week, light sweet crude, it’s had a bit of a wild ride here. There’s no question about that. But once again, we want to look at how we’re doing in the month of May.
You can see we started our new month here. Oil has come down. Hit our just below, a hair below our verified support low at 64,35, and then had a significant rally. Now, the thing we want to notice here is that the market retraced like a moth to a flame directly to the T-cross long and stopped pretty much right on that 73,89. The T-cross long, 74,50 at that particular time this week, and then we’ve gone down again.
Now again, a strong seasonal is usually in play in May and June, and that seasonal is strong. If the US goes into recession, well, I don’t think that’s going to affect summer driving season or anybody’s decision making when it comes to going on vacation. I believe there will still be demand. But for next week, our resistance point is our T-cross long, 73,75. Our support is sitting down at 64,35. A little bit lower, 63,57, excuse me. But again, clearly a buying opportunity if we get down there.
Right now, the initial push for the week based on around the VantagePoint predicted RSI, the neural index, the neural index strength, the initial push at the beginning of the week will be to the downside. But look for a buying opportunity with that powerful seasonality that’s coming into play.
Bitcoin
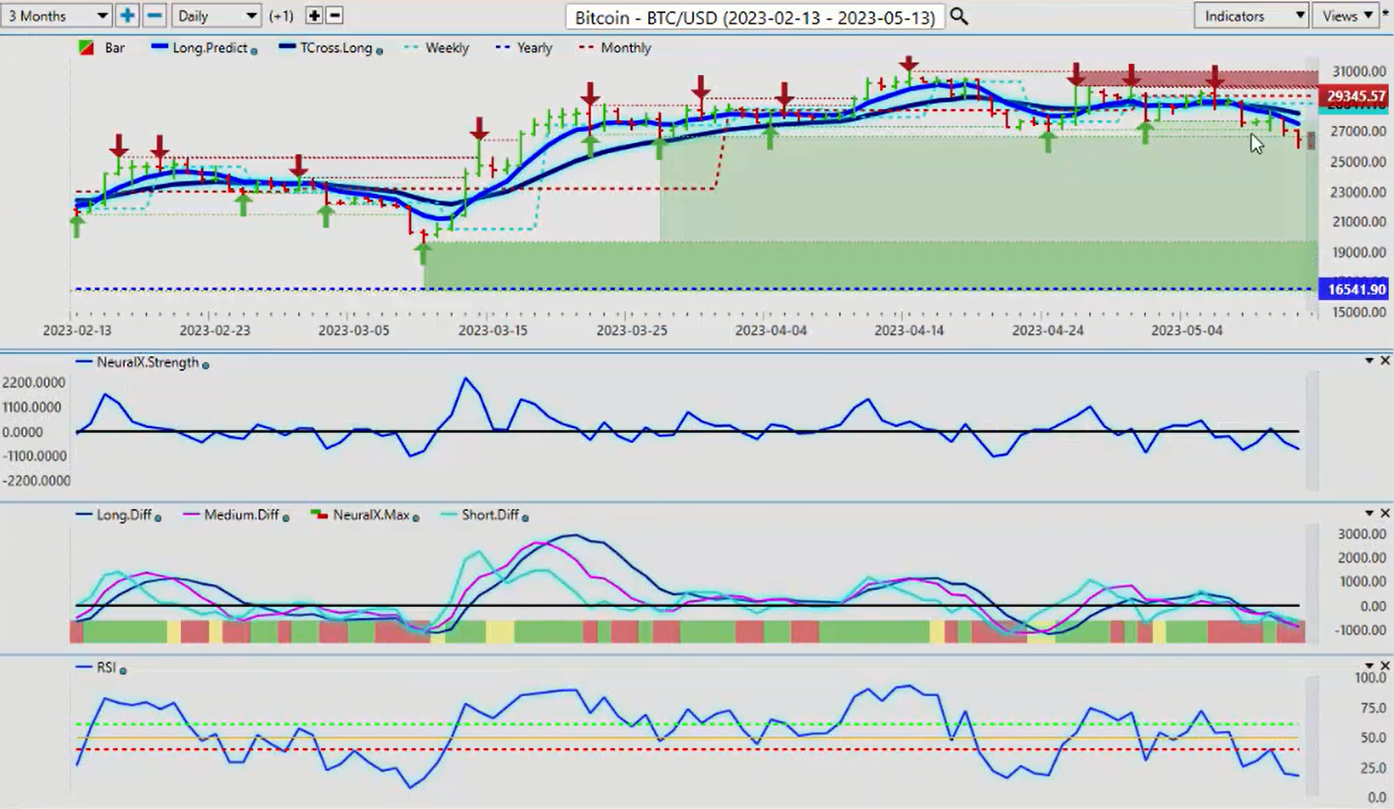
Now, Bitcoin a little shaky this week, again, not surprising, after an 80% return on the year so far. Actually, I think even a little bit more than that. If we look at the returns on Bitcoin, just going back to the exact point in time when they told us, based on that lagging rolling performance, that Bitcoin is going to 8,000, it actually went up 32% just from that point in time in March.
Again, right now, the indicators are bearish. A bit of a risk off scenario again, coming into the market. Now, these verified support low, this is the area I would keep my eye on right here, 26,594, to see if we can stay below this. If this channel, that I’ll quickly outline for everybody, if this channel is broken and that comes right back into this area here.
We’re looking to get back up inside this to confirm Bitcoin longs, but Bitcoin should take a little bit of a pause here. It’s not a trend reversal, guys. Our yearly opening price, 1654, I think we’re still up over 70% on the calendar year. But the comical part of this was in March when all of these pundits said, “Only buy dollars. Only sell stocks, only sell Bitcoin. Gold, sell gold.” And none of those were accurate because they’re not checking the proper levels in my respectful opinion. It’s not about being right or wrong, guys, about understanding where these levels are. And where they’re setting up bear traps, bull traps, very, very important.
For now, we’re going to look to see if Bitcoin can slip back up above there, but I don’t think that’s going to be until probably Tuesday, Wednesday of next week if that happens at all. But a corrective move at this time of year in Bitcoin is perfectly normal. The indicators here saying we still have a little bit more downside, but look for that buying opportunity.
Euro versus U.S. Dollar
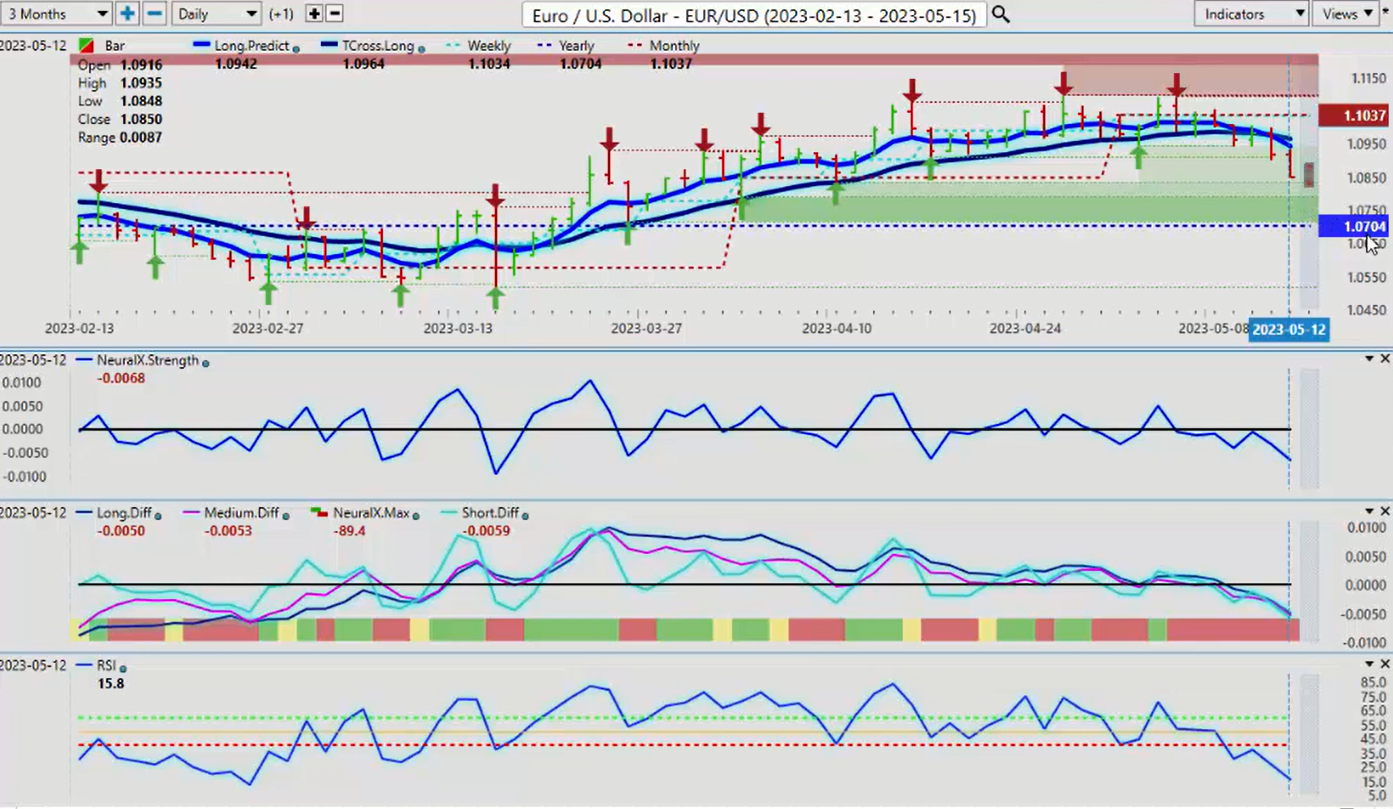
Now, when we come into some of our main Forex payers, the euro immediately responding to that dollar strength, the risk off scenario with the debt ceiling, but again, still firmly above its yearly opening price, 107,04. We would remain long the euro while above this area and look for a premium long entry point.
We don’t need a huge stop on this, but your stops should be below 107,04. The beauty of the Forex market is that you can apply whatever position size you want to gauge that risk. You don’t have to do a full contract, guys. You can do a mini, a micro, a series of mini or micros. But understanding that 107,04 is a major support level. And if this pair is going to bounce, it’s going to likely be around that area.
But we also have a strong verified support low at 107,88. For next week, I would put the buy zone between 107,88 and 107,04. And we would look for a reversal then back to our T-cross long at 109,64. I’ll be watching these indicators right now, but the predicted RSI at 15.8 is suggesting there isn’t a lot of downside left here.
U.S. Dollar versus Swiss Franc
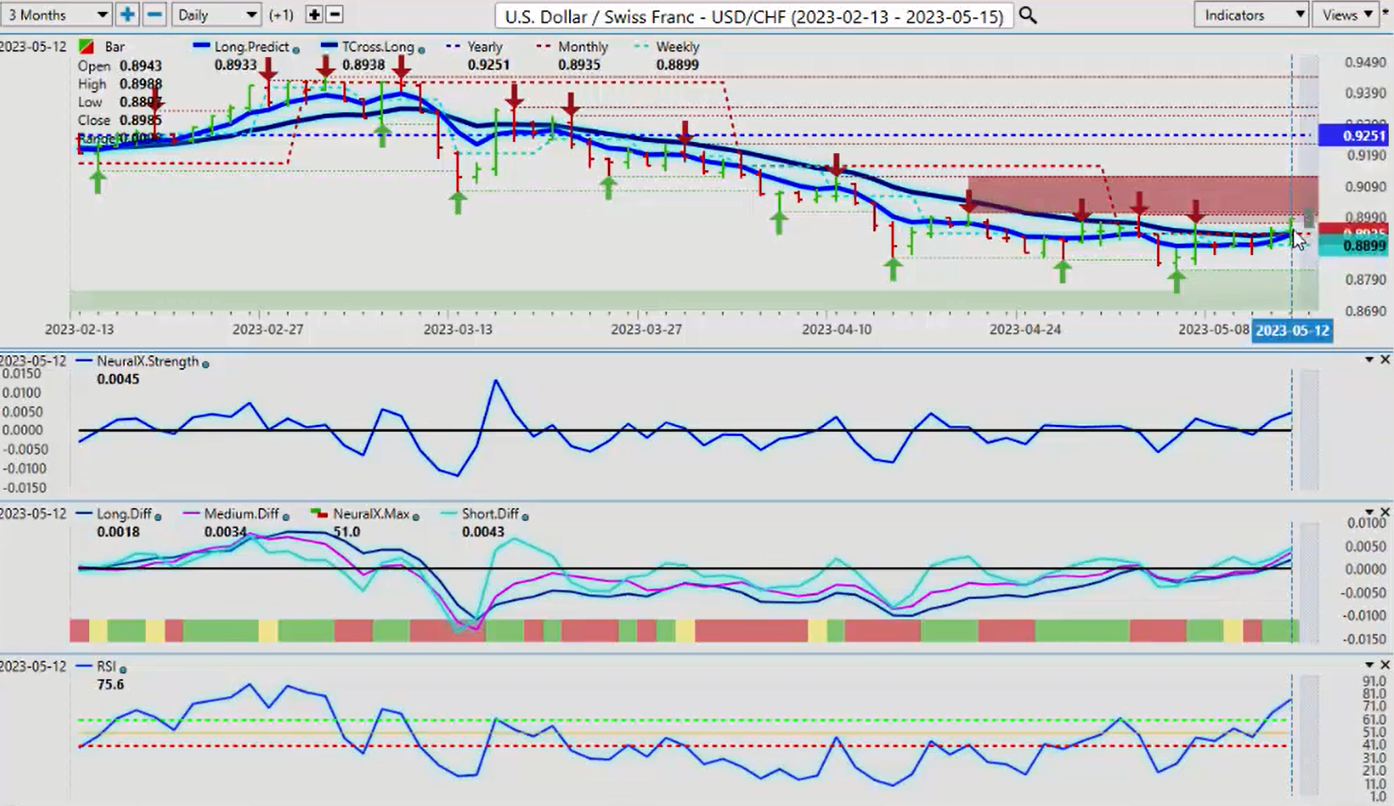
Now, with the US/Swiss Franc going into next week, the US/Swiss Franc or the Swiss Franc in general has a very strong seasonal pattern in the month of May, meaning the Swiss Franc is strong. I would advise to be very cautious of shorting the Swiss Franc in this particular month.
Just a fun fact here. In the month of May over the last five years, the Swiss Franc, the signal has been 100% buying Swiss Franc. We’re early in the month here, mid-month. These verified resistance highs, they’re coming in about the 90 level. Then this additional verified resistance high is coming in at or about 90,03. But you can see the weakness in the dollar against the Swiss Franc based around the yearly opening price at 92,51.
The Swiss Franc has done very, very well in the marketplace. That flight to safety into the yen, the Swiss Franc, Bitcoin, gold. Occasionally the dollar, but the dollar really hasn’t seen that flight to safety at all. I think they’re very concerned with the Fed. But watch these verified resistance highs because if we’re going to get a failure, it would likely be around the middle to latter part of this coming week, and I would keep a very, very close eye on this 90 level.
Now, if we break through that, then we would come up to likely our next verified resistance high around 91,20. But again, for an actual trend reversal, we would need to break through 92,51 and stay above that particular level.
British Pound versus U.S. Dollar
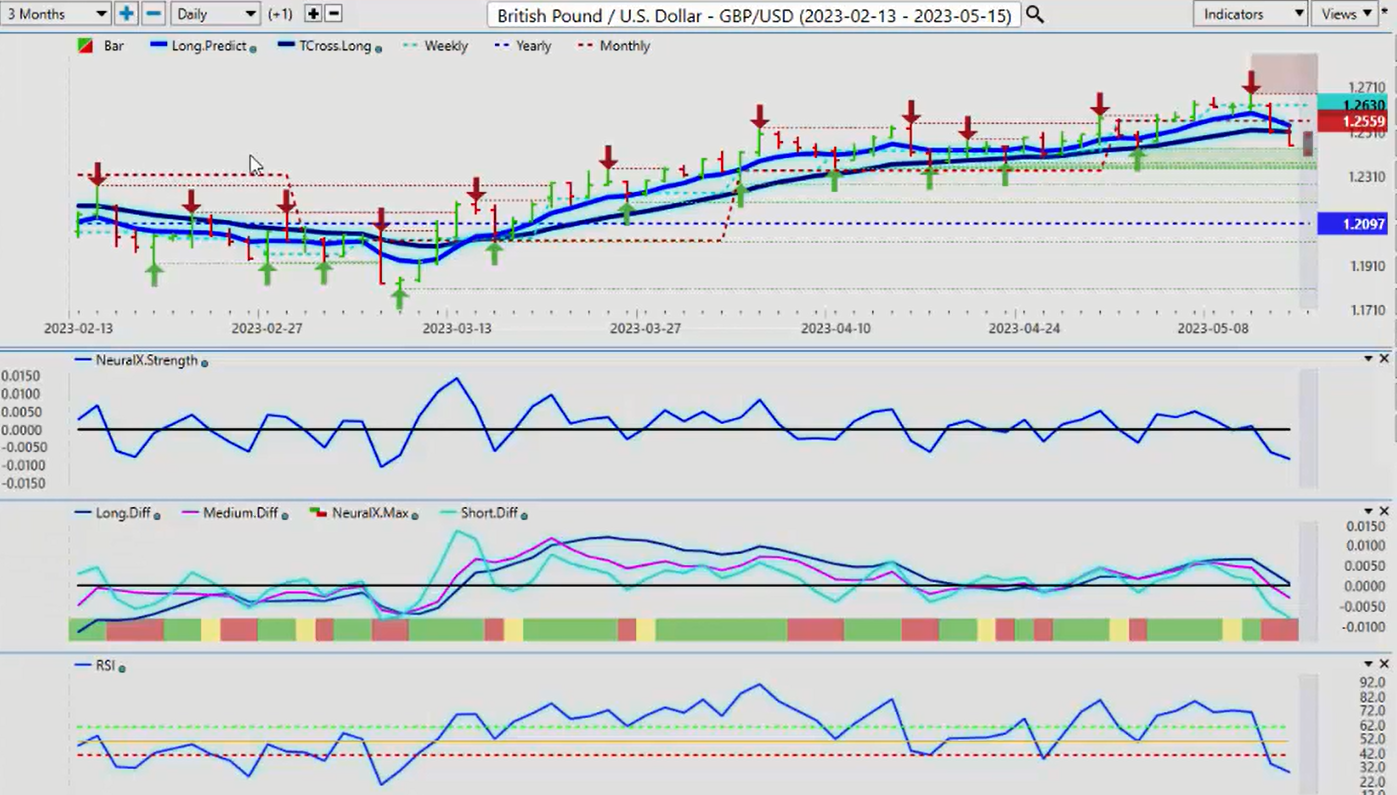
Now, Bank of England not really helping out the pound much this week. You can see we’ve lost… I want to emphasize again, if you look at this bar, this is the start of the trading week. When we’re talking about a five-day performance or a 30-day performance, we want to make sure that we’re measuring it again properly.
When we started off the month, we immediately turned bearish, then we broke above the monthly opening price. And we had a pretty solid rally here from that monthly opening price. That coming in again about 125,59. We rally up to about 126,80, but then we’re losing it again.
But we can assess here over this past week where the pound was supposed to be strong, you can see that we’re holding below. We kept closing below the weekly opening price. And then it used the weekly opening price on Thursday as a springboard to move lower. But imagine if we were checking the wrong date five days back from this date. Well, we would’ve got a completely different signal that would’ve been grossly lagging.
Using our current weekly opening price to measure our five-day performance lets us know that, look, we’ve got no buyers up here. Whatever happened five days ago has no relevance to anything. We look at this and say, “Okay, I can’t get positive on the week here. The probability that a sell off is coming is extremely high.” But again, I think the pound can recover. But I would look for these lower support zones, about 123,45. We’re still firmly positive on the year 120,97.
Just watch your verified zones, guys, because they really do help with entry points and identifying these bull and bear traps. The indicators still saying we’ve got more downsides. Again, I would look closer down or about 100, 150 pips below this level. And a turnaround on the dollar index to the downside would have us move back over to longs on this particular pair.
U.S. Dollar versus Japanese Yen
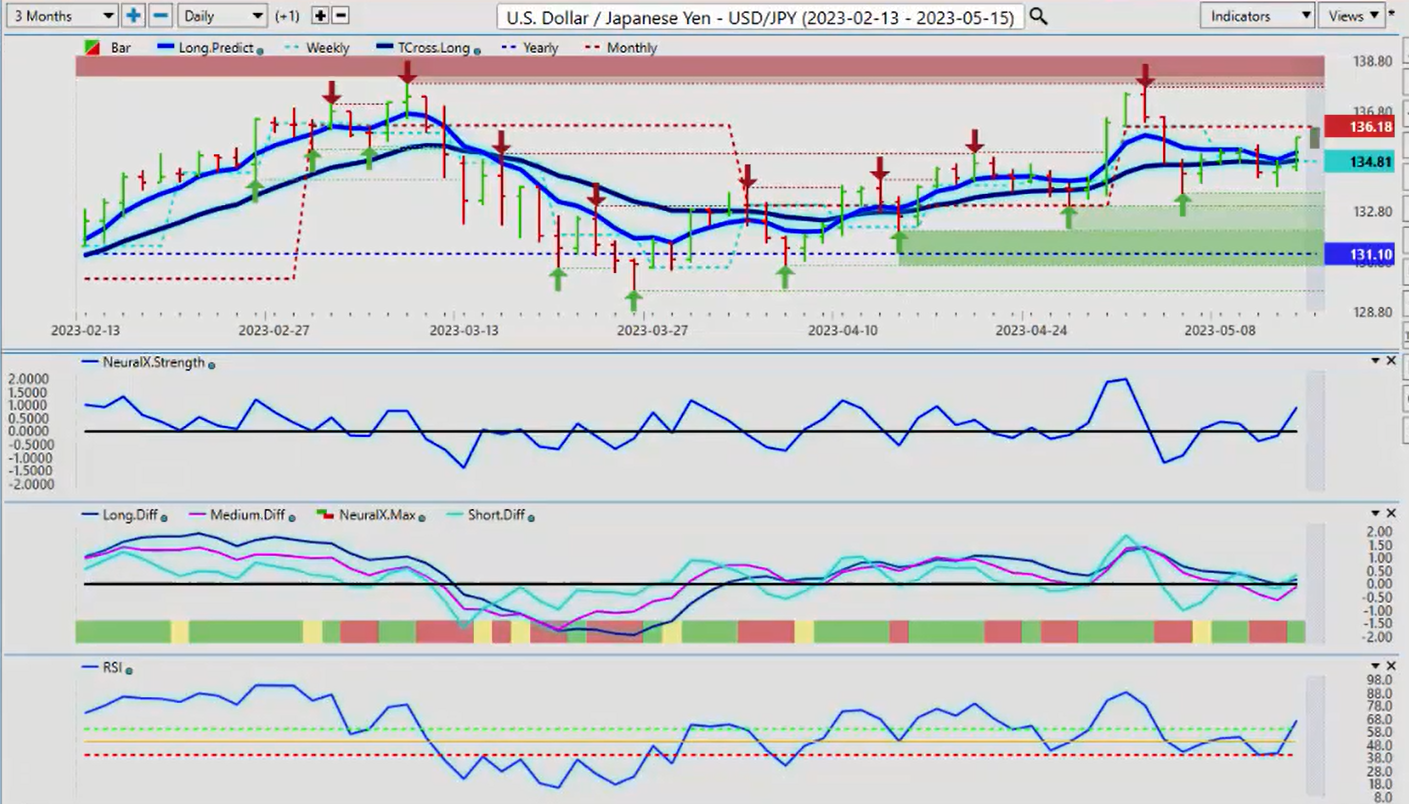
Now, the Dollar/Yen last week, another wild ride with this thing. I would strongly advise caution with anything with Japan right now because if the market mood sours, then that’s going to favor the yen no matter what the indicators say, the risk on versus risk off. We’ve got to be careful here. Right now, once again, you can see the yen moving along that weekly opening price and the T-cross long basically all around that same area. 134,81, the T-cross long, 134,86.
Two ways we can play this. Because again, this is an outlook, not a recap of something that’s already happened here, guys. We want to make sure that we’re identifying key levels. We have our monthly opening price at 136,18. I suspect that that level ultimately by midweek will hold and we’ll start breaking down below it. That the bull trap will be set up just above this.
If that’s the case, so be it. The other way we can do this is say, okay, as the market moves higher, the T-cross long is 134,86. We can put cell limit orders at 134,75. When it breaks down below that, we’re sitting here, waiting for this. That most recent low is 134,40. My view is that if we break down below 134,40, we’re probably going to take a pretty sharp run to the downside very, very quickly.
And I don’t believe the dollar, this pair has a lot of life left up here. It’s just a matter of time before it takes a deeper move lower. I believe the Fed will be the one that likely triggers that. Right now, our indicators are saying we’re still going higher. Be patient, wait for that Monday, Tuesday reversal that we do in the VP live room. In the live room, we expand on all of these methodologies in great detail in live trading conditions. You might want to look at the VP live trading room. It’s a lot of fun.
U.S. Dollar versus Canadian Dollar
Now, when we look at US/Canada. US/Canada, the one thing I will say about the CAD, the Aussie, the New Zealand, I would argue they’re not as much of a commodity currency as they once were. They’re more equity-based currencies, meaning if the S&P 500 is up, then the CAD, the New Zealand and the Aussie are doing quite well. But if the stocks are not doing well, then neither of these three currencies, that’s something you really want to make sure that you understand with direct intermarket correlations.
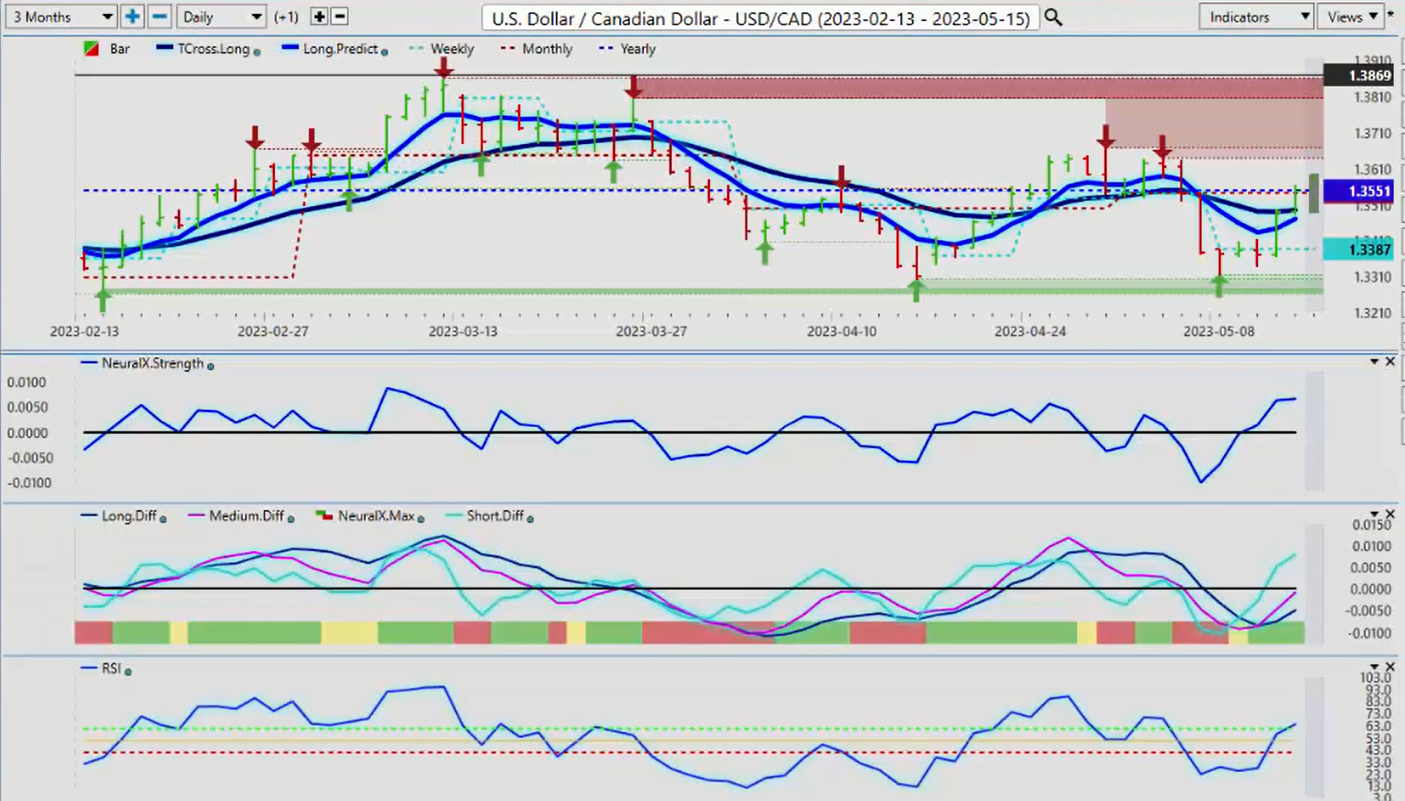
Right now, US/Canada has had a significant nose dive. And that was largely because of that recovery and oil and the S&P going back up over 41,30, 41,40. Right now, we’ve come and retraced all the way back up to 135,51. What you want to understand is this 135,51 is a crucial level whether we get above it or whether we stay below it next week, there’s a trade potentially on both sides.
Be careful, guys, with a big move up on Monday and then a reversal back down on Tuesday. I’ve seen this movie many, many times. Right now, the indicators, the neural index strength, it’s getting very toppy. If you take your neural index strength, which is one of my favorite new indicators, you can see, I can put a line the last time, the neural index strength was up here. And you could do a comparative analysis to the actual chart price, that led to a significant drop. And you can see that the slope of this neural index strength is turning sideways.
Again, we’ll monitor this during the week, but you’ve got very strong verified resistance highs above 136, 136,68. Either way, I think we’ve got a short trade up in that particular area. We’re just waiting for the neural index strength to turn down. The concern for shorts is that MA div cross. The pink line crossing the blue line, saying we’re going higher. The question is… And I believe it’s right, I believe the MA div cross to be accurate, but I also believe it has an expiry level, which is up here. Keep a close eye on that. I think we’re going to see some opportunity.
Australian Dollar versus U.S. Dollar
New Zealand versus U.S. Dollar
Now, when we look at the Aussie and the Kiwi, one of the questions I get all the time is, what about Aussie/New Zealand? And I would strongly advise everybody to look at that pair because if you don’t know which one to trade, Aussie/US or New Zealand/US, you can go to Aussie New Zealand, which is a major player in my view in the markets right now.
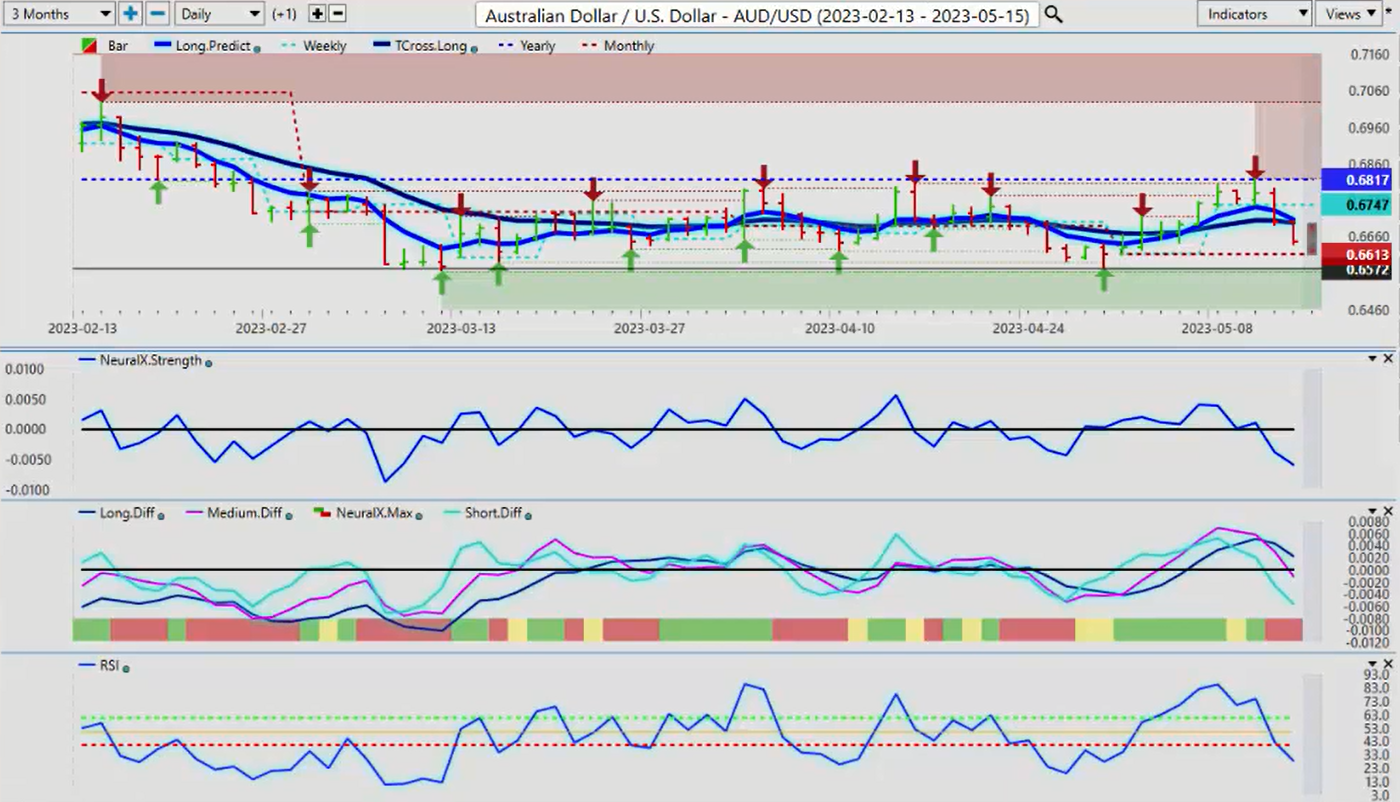
Right now, the Aussie is moving lower, but so is the Kiwi. They’re both moving lower. You can see that we’ve got some… We’ve come up. And again, it’s impossible to script this stuff, guys. And this is the importance of when you’re talking about annualized returns, it must be from January 1st. Not from a year ago from this date. That’s not the way we want to look at this. We would’ve missed this trade.
Aussie/US this past week comes right up to 68,17. The only level that’s sitting here is the yearly opening price, and it was an epic fail at this particular level. If I did an annual return and looked at what the percentage return or what the performance was from May the 10th, 2022, that would be a grossly lagging signal and a grossly inaccurate one. We must stay current with our pricing.
We look at this, and I will add that with that yearly opening price, we have failed at that particular level on multiple occasions. This is not a one-trick pony, guys. We failed over here on April the 4th. We failed at that level again on April the 14th, and we failed at that level again on May the 10th.
If it hits at once and goes lower, that could be a coincidence. Three times in less than two months? I don’t think that’s a coincidence, guys. Right now though, on a positive note for the Aussie, we’re still holding above the monthly opening price 66,13. We don’t want to make sure we’re only looking at support or only looking at resistance. We need to look at both sides of the market to understand what we’re dealing with. The primary trend on this pair is down, but it’s having a good month.
Now imagine if I took this and said, “Okay, well, I’m going to measure this performance from April the 12th.” If I go over here and I say, “Okay, I’m going to be looking at April the 12th for a performance.” Then one, somebody could argue this and say, “Well, it’s still bullish, or it’s slightly down.” Well, no, actually, it’s not slightly down, guys. It’s down a significant amount.
If we look at either the opening or the closing from that failure point, then we can measure this with a higher degree of accuracy of what this pair is actually doing in this particular past week. And it’s down 1.9%. We cross-reference that to the S&P 500 being down 1% on the week. It’s not up 1%, it’s down 1%. This solidifies the inner-market correlations that we trade off of each week.
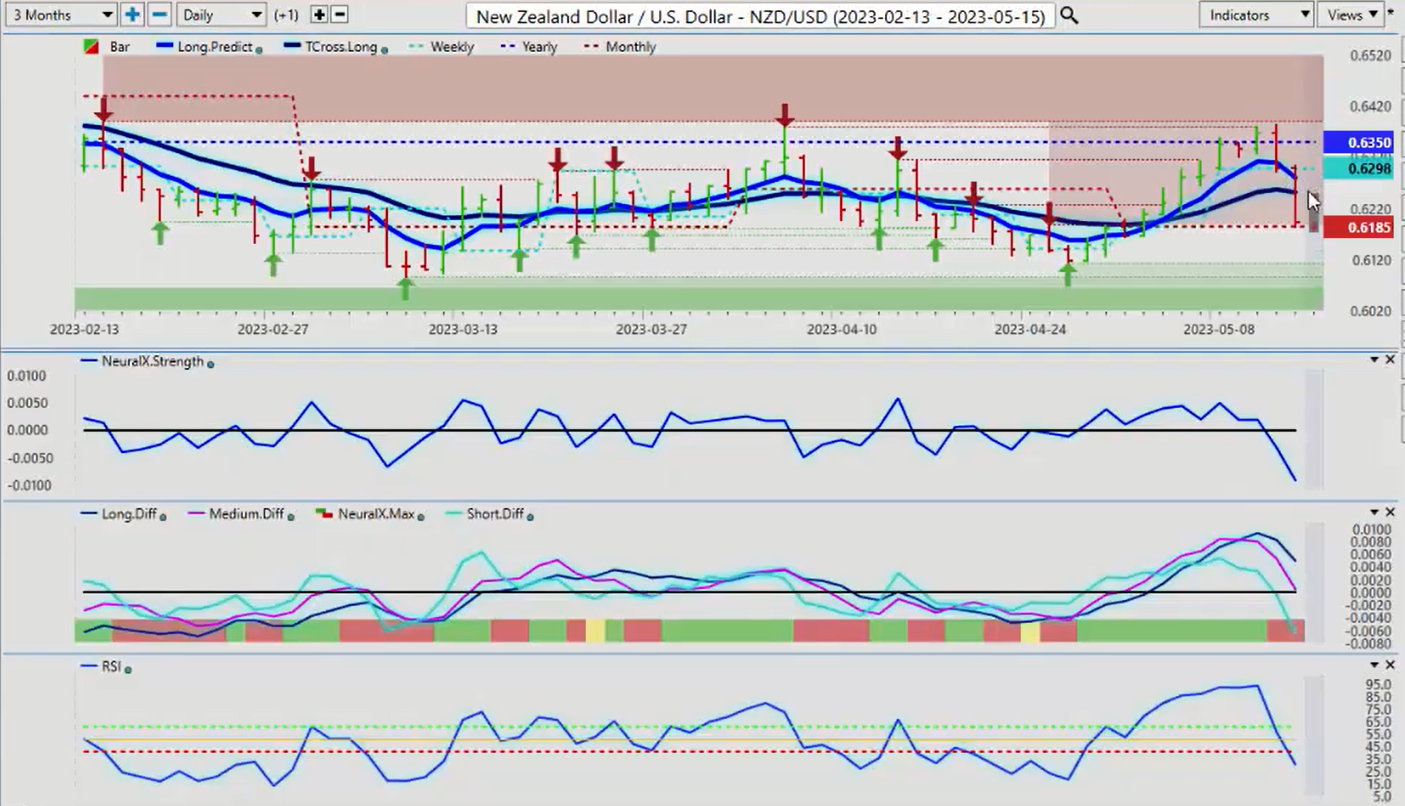
But again, if you move that to a rolling performance date, then number one, you’ve got a lagging indicator. Number two, you’ve got the wrong entry point or you miss that particular trade. Very important that we look at these things. New Zealand/US is virtually identical, and I would argue even better.
New Zealand was an epic battle last week along this yearly opening price. And again, you can’t script this because we do this in the live training room each week. Multiple failure points along that current yearly opening price. January 1st, I have no concern or interest. The other advantage of doing this is seasonalities usually go by the month, the month of January, the month of February, the month of March.
Seasonalities don’t go from the 12th of the month to the 12th of the next month or the 14th of the month to the 14th of the other month. That’s not how we measure seasonalities, guys. We measure them from the monthly basis, on a year-over-year basis. I want to make sure what was the performance of this pair in the month of May? Not part of May, and part of April. That’s going to be a problem.
The yearly opening price here, the second the neural index started to drop, but once again, the MA div cross and your VP software is incredibly powerful when you combine it with the proper levels. We hit the yearly opening price, the MA div crosses, and this thing goes down like a wet bag of cement. But there’s a clear step-by-step methodology why this happened. It’s not random, guys. Just make sure you’re using the proper levels. With that said, this is the VantagePoint AI market outlook for the week of May the 15th, 2020.