Welcome to the Artificial Intelligence Outlook for Forex trading.
Okay, hello everyone, and welcome back. My name is Greg Firman, and this is the Vantage Point AI Market Outlook for the week of August 12, 2024.
U.S. Dollar Index
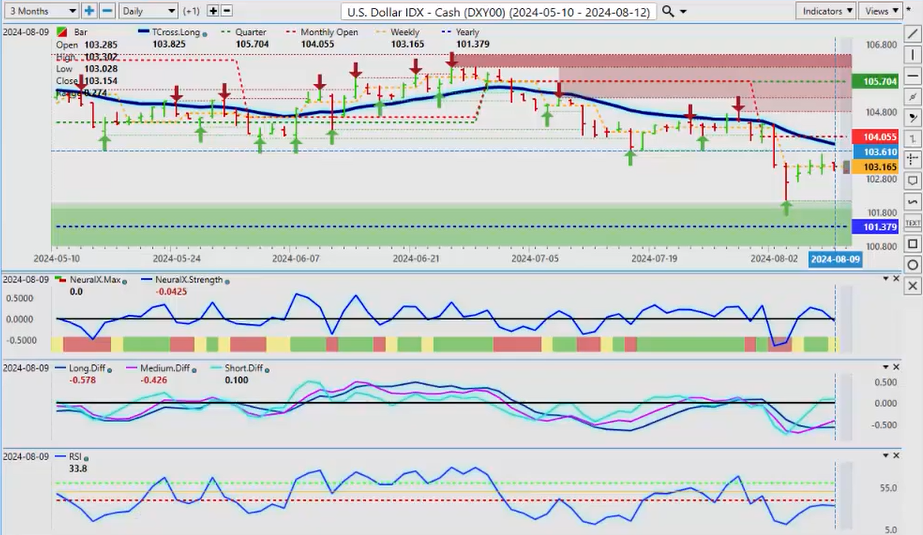
Now, to get started this week, we’ll begin with a very important U.S. Dollar Index . Another big week is coming up with CPI data, but I think the rate cut for September is pretty much baked in.
When we look at our Vantage Point software, the dollar remains bullish on the year while above 101.37. We are in a known period of dollar strength, which usually lasts until about mid to late September. Then, either way—regardless of whether the Fed cuts or doesn’t cut—the dollar usually sells off at the end of their fiscal fourth quarter, which is October 1.
The indicators right now are the MA Diff Cross —our pink line crossing over the blue line to the upside, which is a contrarian buy signal—but we still remain below the T Cross Long . Our corrective move back to 103.82 appears imminent, but the CPI data next week could change that very quickly, and the dollar could slip lower. So, it is a fundamental trading week, but the indicators are warning that it is going to turn back up.
Currencies , by the way, guys, are very different from stocks , commodities , and options . People are required to buy fiat currencies ; they’re not required to buy stocks or commodities , or even Bitcoin for that matter. So, we always want to take that into consideration—there is real demand for the dollar in September. But again, that contrarian signal remains. The medium-term outlook is bearish while below 103.82.
Gold

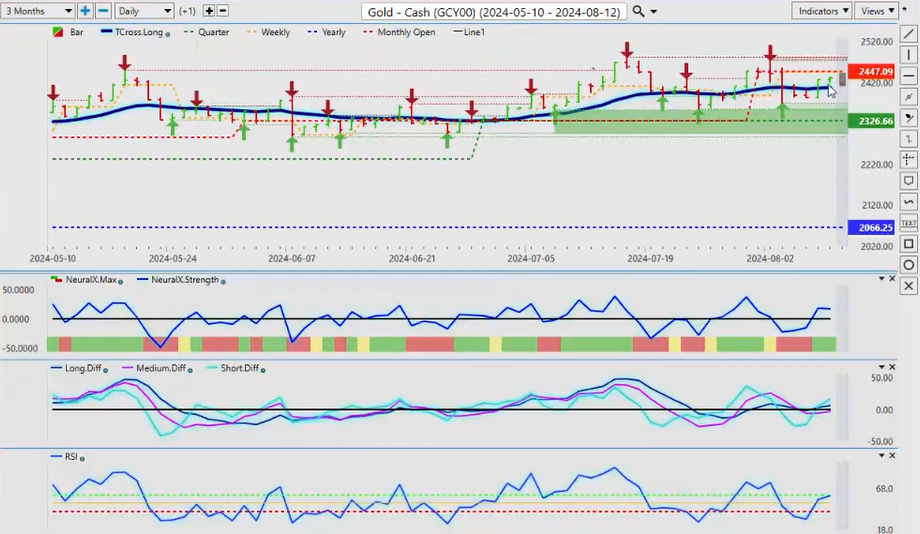
Now, gold has made somewhat of a recovery here, but again, in most cases, gold starts to strengthen after October 1, as I’ve mentioned many times before. But 2,326, our quarterly opening price long, is still very, very attractive while above that area. Our TCross Long is coming in at 2,407—that’s the level we want to keep our eye on in the medium term. This is an outlook, guys, not a recap of something that’s already happened. This video is being done on Saturday morning at 11:06 a.m. while the markets are closed for the next trading week.
When we look at this, we have an MA Diff Cross right on the zero line, but the predicted RSI is showing that we still have upward momentum. What I would like to see is that we can retake and get back above the current monthly opening price of 2,447; then we have a shot of getting over 2,500.
S&P 500 Index
Now, with the equity markets for next week, the equities took a real crazy hit on Monday, and the bulk of what caused that was an entirely inappropriate comment that the Fed should execute emergency rate cuts. There is absolutely no reason why he should do that. He did come out and say this week—on Thursday, I believe—that if there is a rate cut sooner than September, it will not have anything to do with what’s happened this past week. Again, there is no reason for an emergency hike or an emergency cut—there is no emergency period here, guys, from one labor report when multiple labor reports, I might add, have been bad.
Once again, the equities should technically recover to some degree, but usually, August and September are not the best months for buying stocks . This is a corrective move higher. Our predicted differences are, again, turning up but still below the zero line. The Neural Index strength does look pretty good here, but we must overtake that very important T Cross Long at around the 5,400 mark. If we fail there, then again, as you can see, the quarterly opening price and the monthly opening price are now very substantial hurdles for the S&P , Nasdaq , Dow , and DAX 30 to get above their respective levels. So again, be careful—even if we get above the T Cross Long , we still have significant headwinds up to 5,537.
Crude Oil
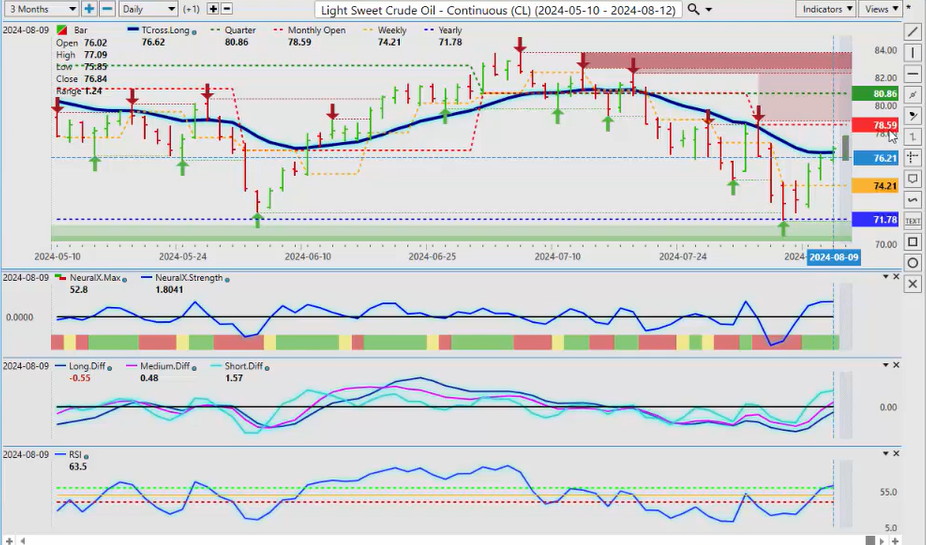
Now, when we look at oil , the oil price is recovering, but again, in my respectful opinion, only August is not the best month to be buying oil . We flip over to natural gas , which usually benefits from the seasonal pattern, not oil . I don’t think we’re going to get above 78.54, the monthly opening price. We’ve just eked out a close above the T Cross Long on Friday, but be careful of oil contracts on late-day Monday and Tuesday for a reversal lower. We do have a medium-term crossover that’s taking place, but the long-term crossover has not. Natural gas prices are rising with that known seasonal pattern, so the pattern on oil usually doesn’t do well in August. It’s already had its rally for the year and is getting ready to move lower.
Now, I will point out, however, and this is something for the bulls—this is the second time we have touched the current yearly opening price. This is very important, guys—why we don’t use a rolling performance model of a random 300 days, a random 30 days, or even a random five days. This is the current yearly opening price, and there have been excellent long trades twice off of here. This was a solid move up when we came down back in June, and that’s the power of seasonal patterns, guys. This is a seasonal pattern, but this is not. So again, we’ve got tensions in the Middle East, all of these things, but at the end of the day, this is not the same pattern that we saw in June, in my respectful opinion only, and it heavily favors natural gas , not oil . So again, watch your long-term crossover, and we’re going to need at least a couple of days closing above the TCross Long at 76.62 before we bite on longs up here.
Bitcoin
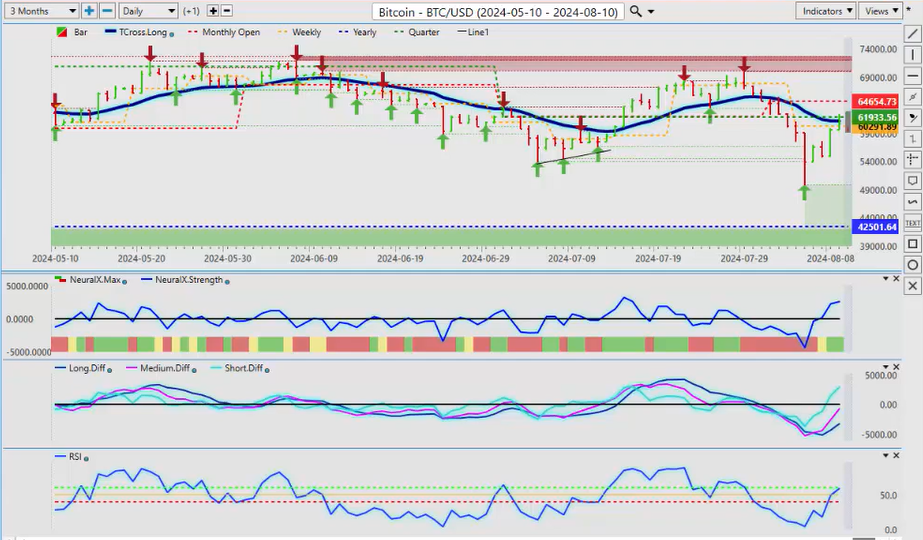
Now, when we look at that all-important Bitcoin —another fantastic week for Bitcoin on this foolishness on Monday, with these rumors of emergency rate cuts. We have to do emergency rate cuts—there was nothing behind those comments. So again, Bitcoin got caught up in the Monday selloff but then completely recovered back up to our T Cross Long . Now, I will remind everybody each week—I know I may sound like a broken record—but I will remind everybody that the main buying opportunity for Bitcoin is closer to October once we get past the period of dollar strength. So right now, our T Cross Long is 61,200. I would be far more comfortable with Bitcoin longs if we can get above 64,654, the current monthly opening price. Again, guys, I don’t want to look at a random 30 days. At the start of the new month, your monthly opening price is one of your best friends in trading because it will tell you, from an unbiased standpoint, above the monthly opening, it’s bullish—the buyers are in control. Below the monthly opening, the bears are in control. So right now, I would argue the bears still remain in control until we can take out that particular level.
Volatility Index ($VIX)
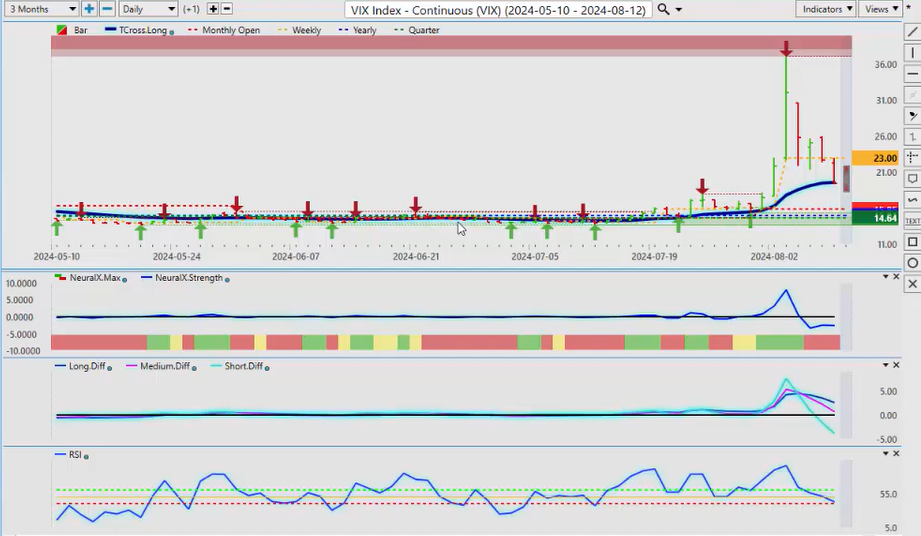
Now, a lot of eyes were on the VIX this past week. I’ve discussed it for several months now in this outlook, and again, whenever we see a daily bar that looks like this, guys, don’t ever buy a bar that looks like that because it was just an unprecedented move. I can’t remember the last time I’ve seen the VIX move like this—I think it was probably back during the financial crisis of 2008. So again, the VIX is back under pressure here, but firmly above its current yearly opening price and the quarterly opening—a lot of heavy support on the VIX , starting with our T Cross Long at 19.62, then our monthly at 15.85, the yearly at 15.01. That order is very, very important at this time of the year. 14.64—if we hold above that level, guys, then that tells me that the main indices are going to remain under pressure until we get past mid-September with the dollar .
DAX
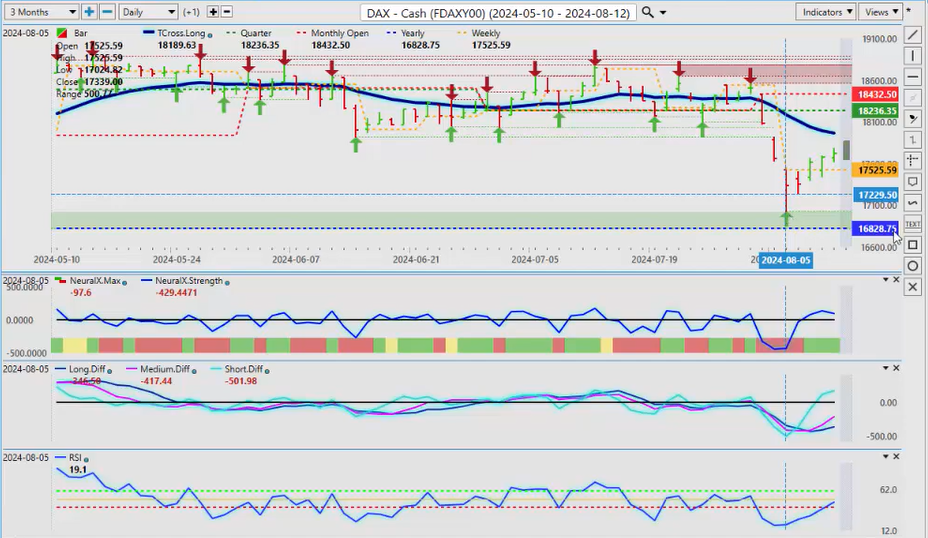
Now again, when we look at the European equity markets , they fell prey to the same thing on Monday. But once again, the current yearly opening price—while they were giving a death sentence to stocks and the stock indices—I’m not in that camp. We have to break down below 16,828 before we can make that call that the equity markets are officially in bear market territory. They are not, guys. If you attach a rolling performance model, you could make that argument, but it would be a false argument. And again, this is a line in the sand that is, again, extremely objective—it’s not subjective based on this or that. It’s based on a line that says, “Okay, we’re still positive on the year; we’ve retraced lower—now we could be getting ready to move higher.” This too will be a retracement to the T Cross Long , and that would be 17,971.
So once again, guys, keep an eye on these key levels. There is a clear buy signal with the MA Diff Cross that is forming on the way up, and as you can see, as it started moving back up, it was able to get back above its weekly opening price last week. So keep an eye on your weekly opening price too, guys, because it’s very, very important.
Euro versus U.S. Dollar
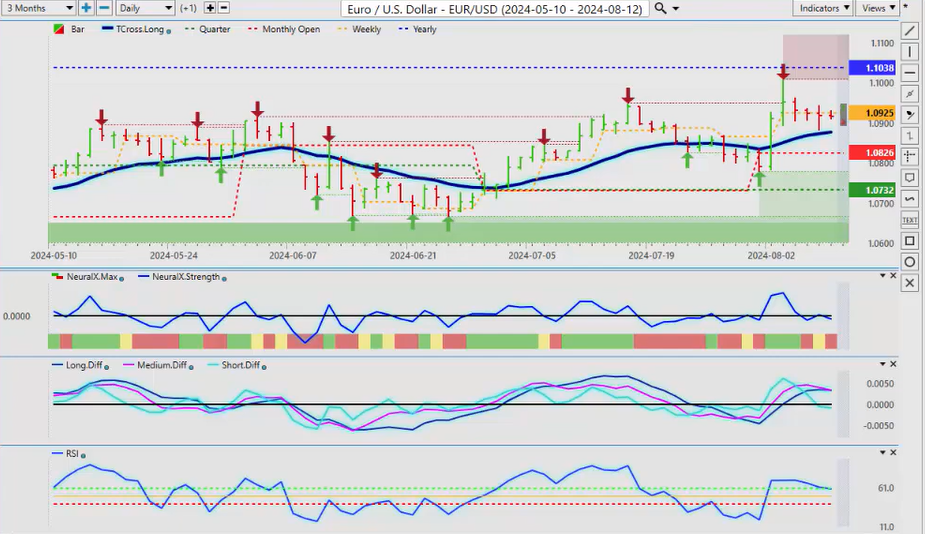
Now, when we look at some of our main Forex pairs, we did have some fun with this in the Vantage Point live training room this past week. Once again, guys, when we look at that current yearly opening price on the EUR/USD pair, the market was incredibly bullish on this pair. But once again, it must clear the yearly opening price. The EUR/USD pair has not been positive in 2024—that’s a fact, not fiction, right? So as we approach that yearly opening price, all of a sudden, it started to lose momentum. Now, we’re still currently holding. There is a positive here, guys, in that we’re above our T Cross Long at 1.0876, the monthly opening at 1.0826, and again, that very important quarterly opening price, which I believe we will test, at 1.0732. Now, I believe we will test that before mid-September, so on a pullback, that’s where I would be looking for longs—between the T Cross Long and that yearly opening—quarterly opening price, excuse me. For a trader that is on the sidelines in the month of August, you would set buy limit orders above 1.1038, and as soon as the EUR breaks—if the EUR breaks above that area—then you’ll have a long ready to go right out of the gate.
U.S. Dollar versus Swiss Franc
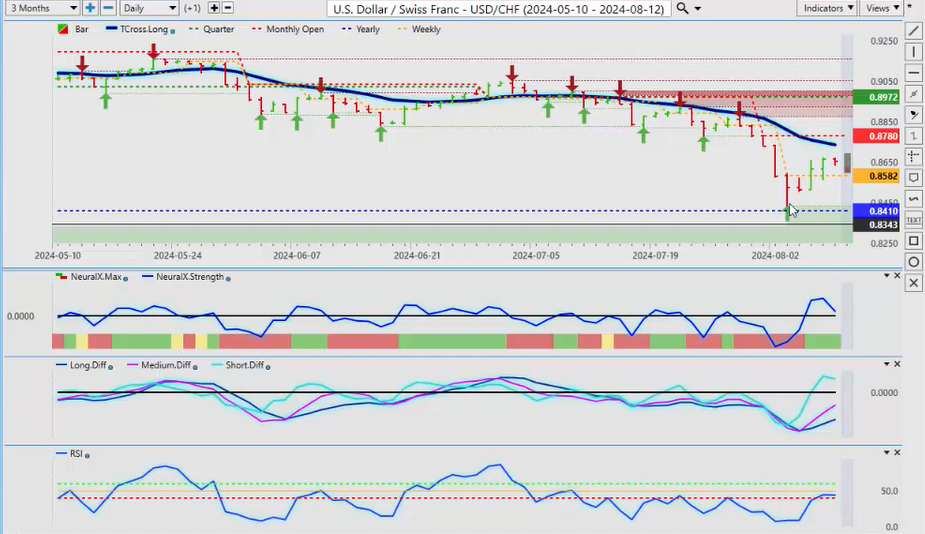
Now, the USD/CHF has recovered on this dollar strength—I believe it can recover more. But once again, to demonstrate the power of an unbiased tool like the current yearly opening price, we came right down to that area, and mysteriously, with no identifiable support, it reversed. And again, we’re still positive on the year, but I think that this is going to be a relatively shallow retracement higher. The quarterly opening at 0.8972—that’s the level you want to watch. But the first area of major resistance is the T Cross Long at 0.8736, which is likely going to be tested early in the week. But be careful of that Monday-Tuesday reversal that I’ve discussed. There is CPI data coming out, and I believe it will be slightly softer. But again, that’s subjective—it may be hotter, and that could fuel a dollar rally that we’re expecting anyway going into early September. So just be careful with those levels, and of course, the current monthly opening price at 0.8780.
British Pound versus U.S. Dollar
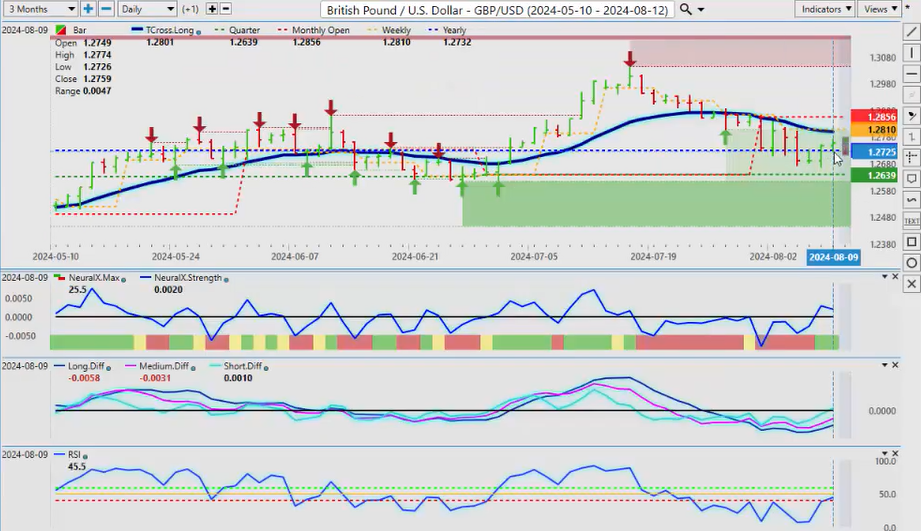
Now, the GBP/USD once again, you can see, is fighting it out. The battle lines are pretty much drawn here, guys, on the current yearly opening price at 1.2732, but now we’ve slipped below the quarterly and the monthly, and we’ve got our T Cross Long at 1.28—that is the critical level for next week’s trading. We need to overtake that, and then we need to get above 1.2856 and stay above that. I don’t think that’s going to happen, guys, until probably closer to October, but again, I could be wrong. So we use that current yearly opening price of 1.2732. We need a clean break of it, and you can see that it’s really struggling along here. The indicators from VP are warning that we could be getting ready to move higher—just watch these resistance levels.
U.S. Dollar versus Japanese Yen

Now, the USD/JPY remains all over the map here, guys, and it’s because of the Bank of Japan . But once again, that current yearly opening price, which most traders and investors don’t even look at—they’re wrapped up in some type of rolling performance model, throwing a whole bunch of different indicators and Fibonacci levels at things—and they miss the simplest thing: what price did this pair open the year at? It opened at 141.03, and it’s been above it all year. That is largely due to the carry trade, which I believe is going to start coming unwound if the Bank of Japan hikes again, which I think they will, and they’re going to leverage that to get their currency a little stronger. But it’s a fine line. So right now, our retracement—our T Cross Long at 150.69—shorts are currently heavily favored. But this is a fundamental trade of what happens to that very important carry trade, and when it comes apart or unwinds, it’s usually vicious. So be very, very careful with this.
U.S. Dollar versus Canadian Dollar
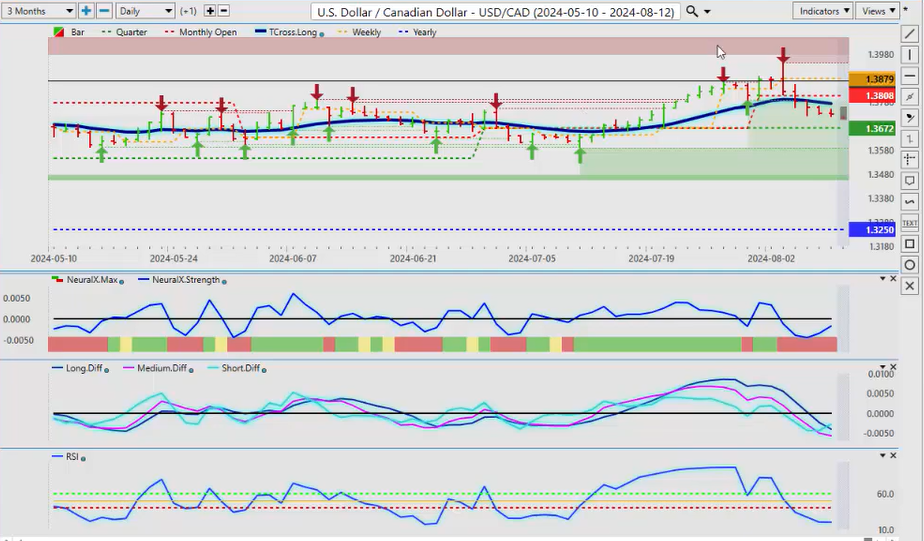
Now, the USD/CAD once again—a pretty terrible jobs number coming out of Canada on Friday. I think we lost around 2,800 jobs. But the seasonal pattern—what can save the Canadian dollar —is if the equity markets move higher. The high correlation the Canadian dollar has to the global equity markets and, of course, oil and some commodities . But the quarterly opening at 1.3672—that is the level to keep your eye on in next week’s trading. If we continue to hold above this level, then the USD/CAD pair will continue its uptrend, but if we break down below the quarterly, we could start that slow grind toward the current yearly opening price at 1.3250. The indicators in VP right now are very, very mixed on this one. This MA Diff Cross —as you update your software weekly, keep an eye on that pink line because if it crosses back over the blue line, that will confirm what I already think—that the Canadian economy is going into recession, or could be in recession right now, and a weaker Canadian dollar . Now again, if the U.S. does go into recession, that will really hurt the Canadian dollar because that’s their biggest trading partner. So keep an eye out to see if we get that contrarian signal to say that this uptrend is still in place and we’re getting ready to turn higher. But it is helpful to give everybody a line in the sand—above the yearly, above the quarterly, below the monthly—that’s the only thing here, guys. So 1.3672—keep your eye on that particular level all of next week.
Australian Dollar versus U.S. Dollar
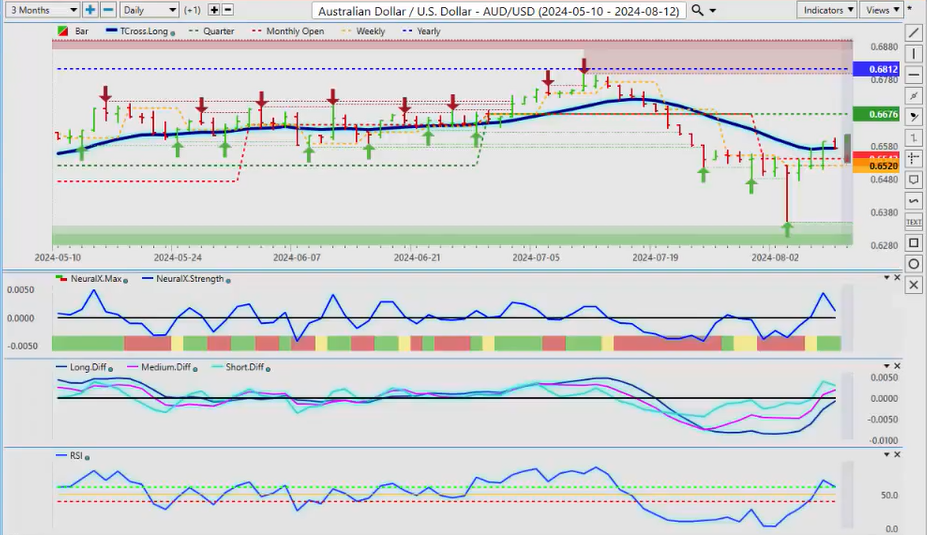
Now, the AUD , the CAD , and the NZD —all very similar trades, and they’re all highly correlated to equities . So right now, you can see that the AUD is really trying to push higher, but I believe it’s too early to call this a bull market. As I discussed several weeks ago, leveraging the current yearly opening price of 0.6812—that was an epic failure at that particular level. But I would argue we had some pretty good support down here in the lows around 0.6508, and then obviously, this pair got caught up in Monday’s nonsense. And again, I will reiterate—there is absolutely nothing in anything that’s come across my desk that would suggest the Fed needs to do emergency rate cuts. He should have cut months ago—yes, we all know that—but emergency rate cuts? No, no—we need to remove that language because there is no immediate emergency at all. So right now, for next week, our T Cross Long is 0.6572—we’ve got to hold above the T Cross Long if this has any chance at all. But if we slip below that monthly opening price, I believe that is likely—hopefully—the low for the year. I know hope is not a strategy here, guys, but this was a crazy bar, and I think they flushed out everything they needed—they flushed all the stops out that they could. So again, the low of that bar, 0.6350, is the support that we are going to use until such time as it breaks. But again, I would like to stay above—hold above—the monthly opening at 0.6542. That would confirm that the dollar is starting to weaken.
New Zealand Dollar versus U.S. Dollar
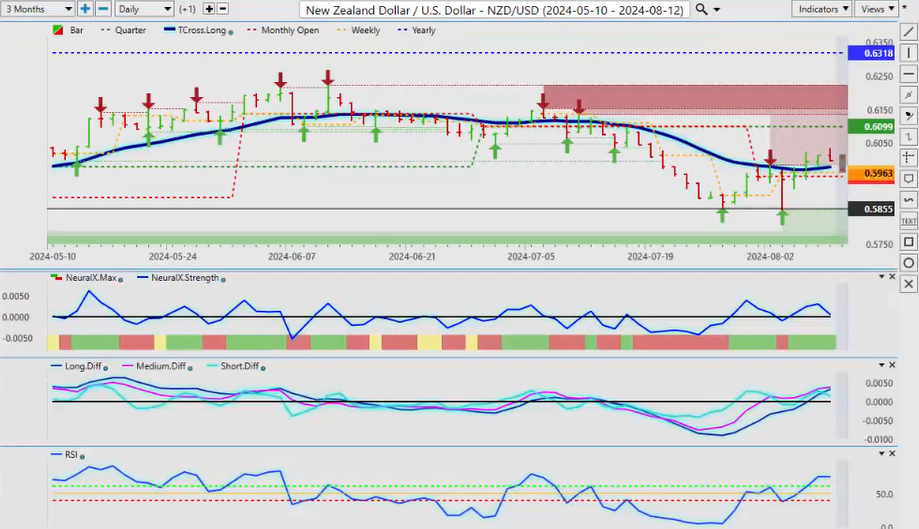
The NZD is slightly stronger than the AUD , and that’s because of the big selloff on the NZD a few weeks ago, and now it’s starting to recover. So our T Cross Long there is 0.5970. But right now, there is heavy support along that monthly opening price—that level, 0.5951, right there. As you can see, this pink line appears to be getting ready to cross back down. So what we can take from the stock traders can take from the USD/CAD , the AUD/USD , and the NZD/USD is that these currencies are often barometers for your stock market. If these three currencies weaken, then that tells me stocks are in trouble. So be very, very cautious in the first couple of trading days this coming week because it is a data-dependent week yet again.
With that said, this is the Vantage Point AI Market Outlook for the week of August 12, 2024.