Welcome to the Artificial Intelligence Outlook for Forex trading.
U.S. Dollar Index
Okay, hello everyone and welcome back. My name is Greg Firman and this is the VantagePoint AI weekly outlook for the week of September 16th, 2024.
Now, to get started this week, we’ll begin where we always do with that very important
US Dollar Index
which will be at center stage this coming week with the FOMC.
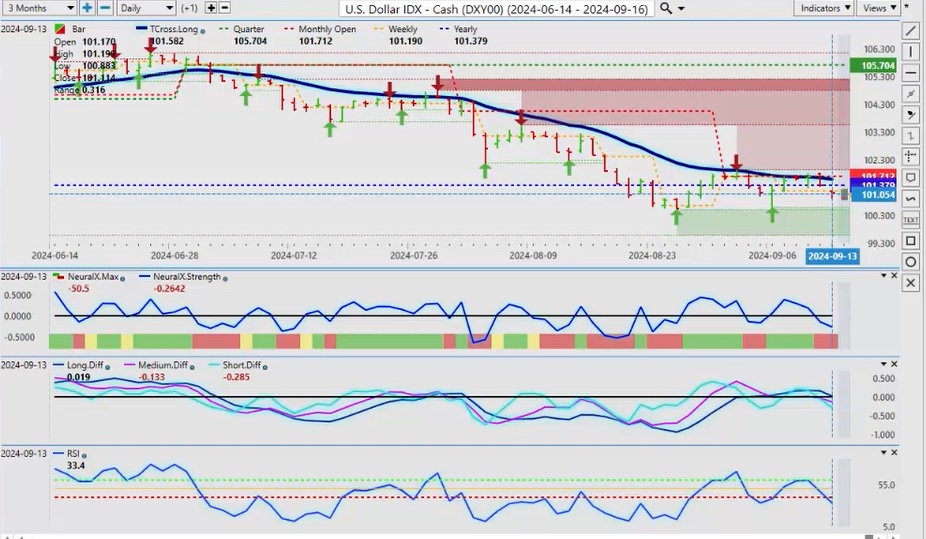
Now, what I will say, respectfully, is that the media is twisting a lot of information that is not factual. They are trying to bake in a 50 basis point cut, pushing gold higher, pushing the dollar down, pushing stocks up. But again, the FED has never suggested they were going to cut by 50 basis points. Several FED members have come out and confirmed that. So when we look at this, I believe this will be a case of buy the rumor, sell the fact. We get our FED, uh, 25, uh, quarter basis point cut, then we turn around and they start to reassess whether they want to be short the dollar .
As I’ve stated on almost every one of these outlooks, the seasonal pattern is the dollar is stronger in the month of September and then it sells off into October. So right now, 101 is our key level, the current yearly opening price. The indicators are bearish. I believe the dollar will be flat to slightly bearish until we get the FED. When we look at numerous other central banks, when they have cut interest rates, their currency is initially taken a hit and then is reversed higher. An example of that is the Euro , the Canadian dollar , to some degree the Kiwi . So again, all of these, the Swiss Franc , so I don’t expect anything different with the dollar , but always remember we are in the fiscal fourth quarter and in most cases, there’s demand for US dollars . So our key level here that we need to stay above next week is the 101 level. That is a very, very important, uh, level with the initial move pushing to the downside. We also have very strong verified support low down at the 100.51 area. That is the level to keep your eye on. Be very, very cautious of a bear trap down here because I believe that that is what they’re setting up and that ultimately in the month-end, the dollar remains strong.
S&P 500 Index
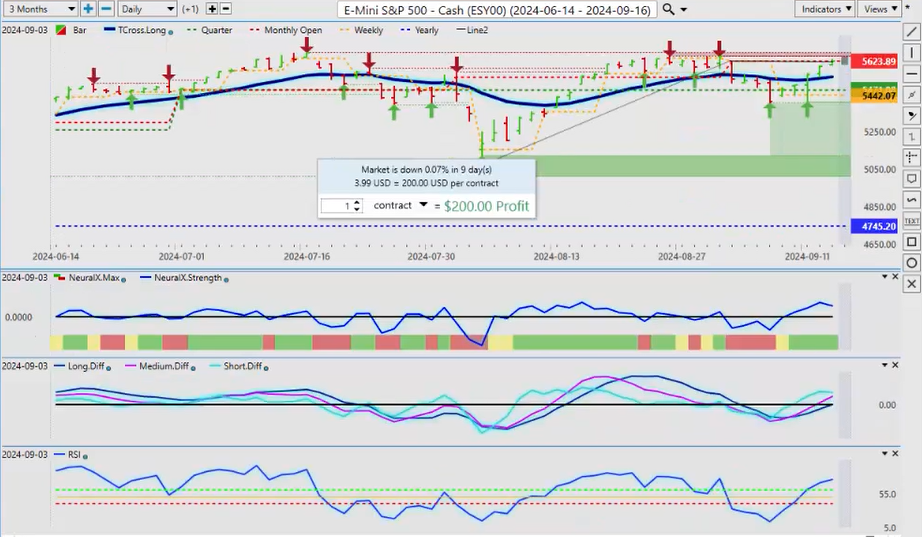
Now, when we look at the equity markets, once again, the media is spinning things that the stocks had such a great week. Well, that’s a half-truth at best. As you can see, stocks are actually still negative. The S&P 500 from a factual standpoint is still negative on the month. The actual monthly opening price, 5650 on the cash side. So when we look at this, even if we use the New York open as the monthly opening price, which I don’t recommend, I recommend using the Asian open at the beginning of the month, that level is 5650. So we’re actually negative, but even with that, the market is still down. So they have tried to spin this into the best week ever for stocks , but they failed to mention the significant drop that we’ve seen in the equities. That low, now on the S&P 500 , 5406 and I’ll respectfully submit that your resistance for next week will be 5650. Longs are very dangerous up in this particular area. Only, in my respectful opinion, the indicators are bullish here and I believe stocks can extend, but the FED is likely to say that we will be data-dependent and there is a 95% probability there is only a quarter basis point cut. The market is not going to get what they want, in my view. They will also discuss his concerns with the economy, the labor market, all of these things will play into that. So be very cautious up here. The indicators are bullish, but I believe there will be an expiry date probably by the end of the week that will be the end of the stock rally. But we will see. But just remember, the stocks are not even positive on the month. This rally is a recovery rally back up to the current monthly opening price.
Gold
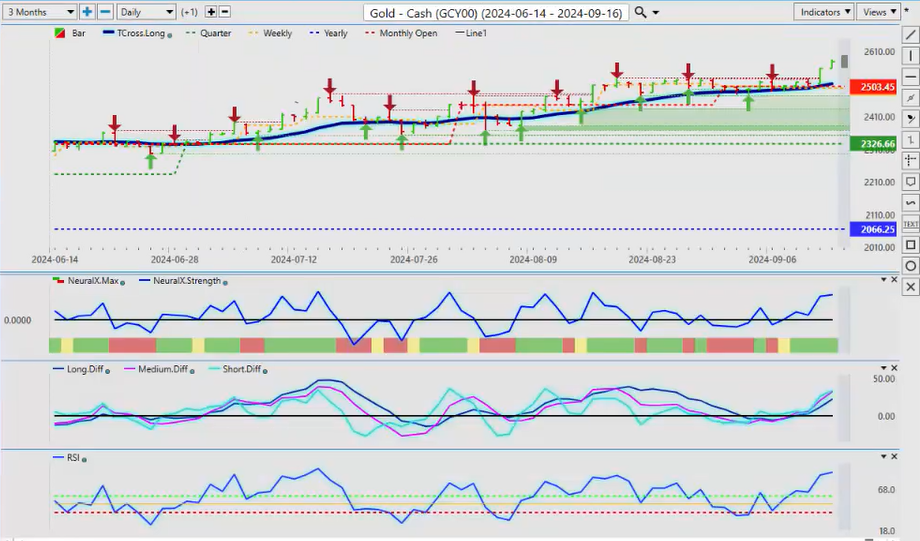
Now, when we look at gold , gold is out of fair value up at these particular levels and once again, you can see the bulk of this rally came on reversal Thursday, is what I call Thursdays, but it did come off our T-cross long, and that’s 2503. But I don’t feel, at this particular coming week and over the next three weeks, that gold will hold these gains. If we look, look at the last three, four, five months, gold has rallied up and then mysteriously dropped $100 an ounce. So I would be very, very cautious here with gold Longs. The predicted RSI sitting at 88.9. And again, I believe that gold will definitely rally into year-end, but it will likely struggle after we get the FED press conference on Wednesday. Very, very important to listen to that press conference. We already know there’s going to be a 90% probability of some type of cut, but that cut is likely only going to be a quarter basis point and then everything else from here on out will be data-dependent. People will realize that and likely exit gold Longs in the short term, but ultimately, we’re strong buyers of gold in mid-November into mid-January. So again, we’ll watch these levels, but our T-cross long is now at 2511. That would be the rec, if you’re so inclined to go long on gold here, that would be the area to watch for. I believe it will pull back to that pre, pre-Fed.
Bitcoin
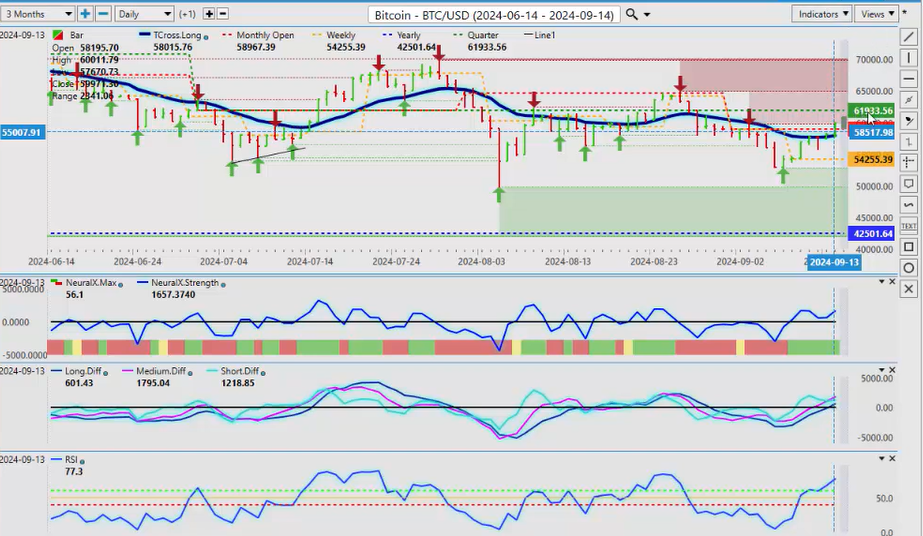
Now, when we look at Bitcoin , Bitcoin continues to push up but once again, in most cases, Bitcoin is at its strongest in late September into mid to late October. So while it does look promising that we can extend higher, if stocks pull lower and gold also moves lower after the FED, Bitcoin is likely to follow.
That would be our buying opportunity. Again, only in my respectful opinion, looking at seasonal patterns here. So right now, our T-cross long, 58,000. I cannot rule out another move down to 50,000 at the by the end of this month. But if we do, that would be a very good buying opportunity as ultimately I see Bitcoin extending higher this year and next year, uh, looking at those seasonal patterns. But right now, the indicators are bullish. Just be very cautious around 61,933.
That is the current quarterly opening price, very, very important and usually, it’s the fourth quarter where Bitcoin makes its big move.
Light Sweet Crude Oil
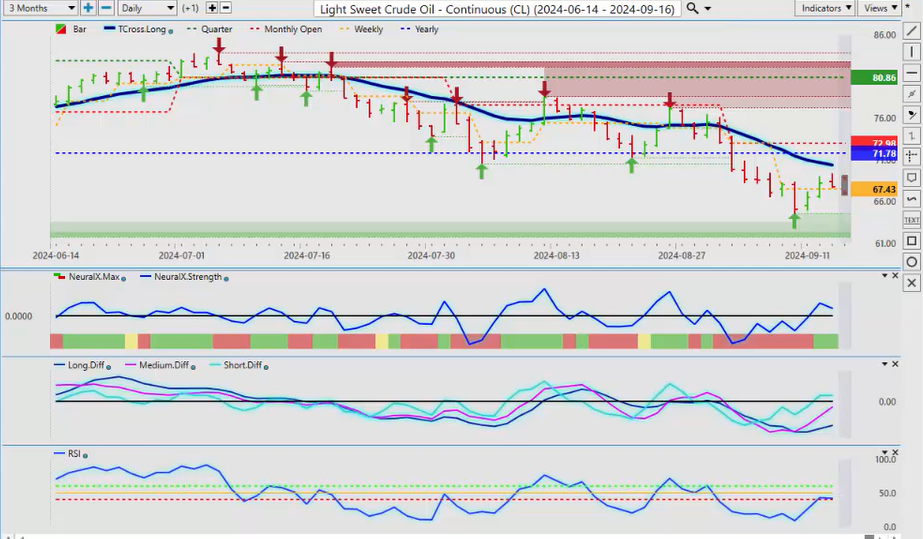
Now, when we look at light sweet crude oil, uh, once again, I’ve discussed this in the Vantage Point live training room and on here that, uh, once we break down below the yearly opening price, it’s a pretty easy trade. Now, we’ve recovered, we’re starting to recover but we’re still below our T-cross long. Now I do love energy, but I like the natural gas trade more than I like oil for in August and September. Then we’ll revisit this, see what kind of winter we’re having, that could boost oil . But right now, this is a corrective move higher while below the T-cross long at 7037 and our current yearly opening price at 7178. So if I was so inclined to try shorts, I would want it to be up at this particular level. I don’t want to get caught in a bear trap, but again, the supply of oil is building and demand is minimum. So it makes sense that oil ultimately broke down because we can see it testing the yearly opening price multiple times, retracing back to the T-cross long, and then you’ve got strike one, strike two, and then ultimately strike three, the yearly opening price playing a pivotal, uh, in my decision-making whether okay, they’re telling me I’m bullish down here and there’s a seasonal pattern in August on oil when there actually isn’t. That’s not factual, uh, the over the last 5 years, the seasonal pattern on oil has been down. So now we’ve pushed lower, we know exactly where our resistance is, and that is the area to watch for just understanding that there’s very little momentum looking at that predicted RSI.
Volatility Index ($VIX)
Now when we look at the VIX , the VIX will play a big part in this, and the VIX is still holding its ground on the T cross long, and that’s what makes me think that the equity markets will struggle above 5650. I would not personally, at this, in the month of September, not be a buyer, but that’s just me. So when I look at this, and I do a comparative analysis to the VIX , the VIX is firmly above its yearly opening price, 1464, the T cross long 1865. I would look to buy on this on a dip this coming week after we get the FED. But again, I’m pretty sure I know what the FED is going to say and what he’s going to do. He’s going to give a little bit to the Bulls and a little bit to the Bears, and he’s going to try and juggle this mess that he’s created by not cutting before now.
So again, and I’ve discussed this in multiple outlooks throughout the calendar year, I believe he will cut a quarter basis point into year-end, but then we’ll see what he’s going to do. Right now, the indicators are soft on the VIX , so we’ll monitor this. But remember, the current yearly opening price at 1464, the VIX is still positive, and that is a red flag in buying any global indices.
DAX
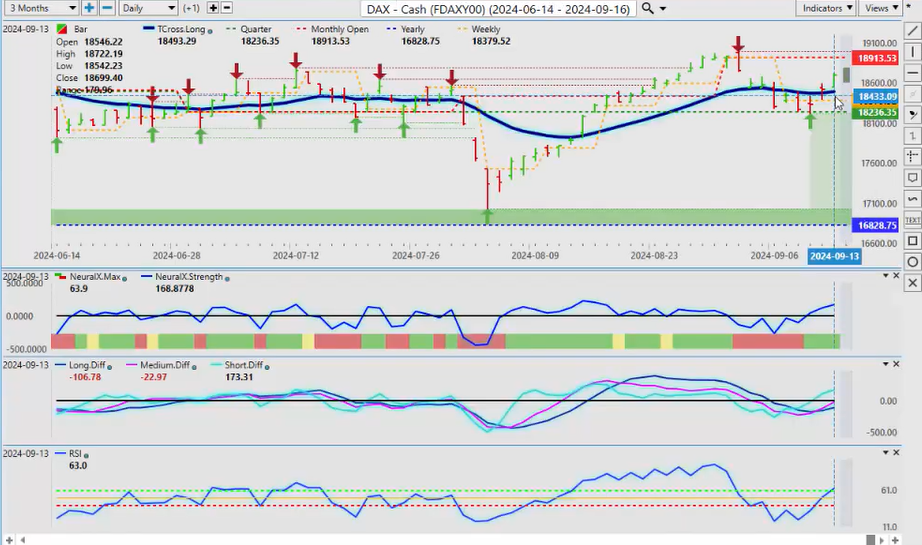
If we look at the DAX, the European Equity markets, they are actually starting to recover too. But when we look at the current monthly opening price, guys, this is what we need to make sure that we understand because the media continues to spin its web of fake news on almost a daily basis, and I would caution everybody on Monday to be very careful because that’s when they’re spinning their whip, saying how strong the European Equity markets are—it’s just not factual. Guys, we’re down 1.28% on the month; that’s fact, not fiction. When you put in a rolling performance model, it causes distortion. What they’re doing is measuring performance in the last three or four days or say, “Oh well, over the last 5 days, equities are the strongest rally we’ve ever seen.” That’s not true. Uh, it’s negative on the month, guys. So at the start of each month, that’s why Vantage Point has put in the monthly opening, the yearly opening, and the weekly and quarterly open so we don’t get caught up in this media spin with that rolling performance model. So be very cautious, but I think selling into 18,913 is reasonable in the month of September, and then we’ll revisit whether the global indices can move higher from mid-October to the end of the calendar year.
Euro versus U.S. Dollar
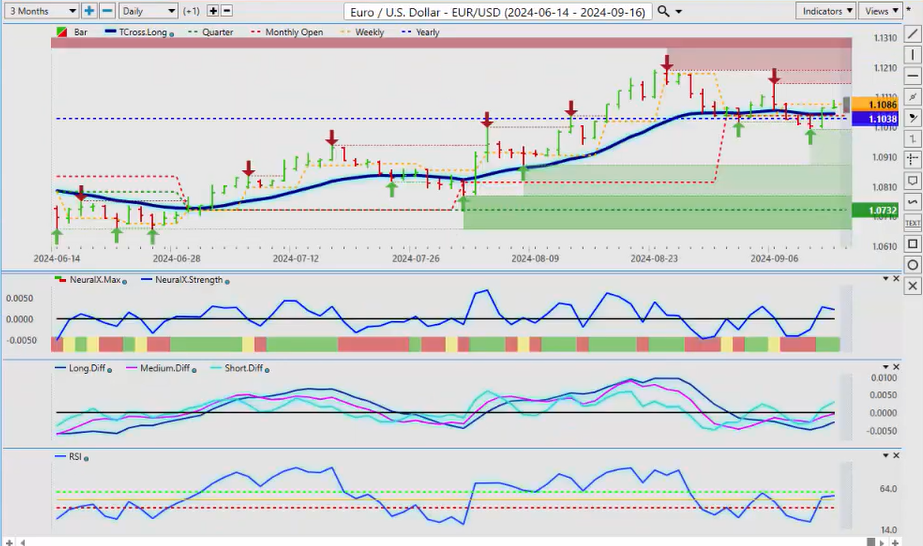
Now, when we look at some of the main Forex pairs, once again, the EUR/USD , all eyes are on the Euro pair, and you can see we’re just fighting it out down here around the TCross long and the yearly opening price. The Euro basically remaining almost flat on the overall week. You can see where we started the week; we opened the week at 1.1086, and we close the week at 1.1075. So, with all the ups and downs daily ups and downs, you can see when you simplify your analysis like this and have quality indicators, not quantity, then you see things slightly different and say, “Well, this was a big nothing burger on the week.” Right? So it still has our eyes on that Dollar Index and the FED, but right now, we’ve got a verified resistance high, and what we can do is I can show you on here using the verified zones how to bring a trend line in here.
So a trend line is going to come in just about 1.1150, where, and so watch that area very, very closely next week. Uh, I could see a false break higher, and then ultimately turning lower into the month-end. The monthly cycle on the dollar , the dollar is strong at the end of the month, end of the first week of the new month, and the seasonal pattern is historically speaking, uh, over the last 10 years, the Dollar’s been up 80% of the time in the month of September, and over the last five years, the Dollar’s been up 100% of the time in the month of September, closing above its opening price. So we’ll monitor this. Right now, the indicators here are quite mixed; you can see that predicted RSI is not showing a lot of momentum.
U.S. Dollar versus Swiss Franc
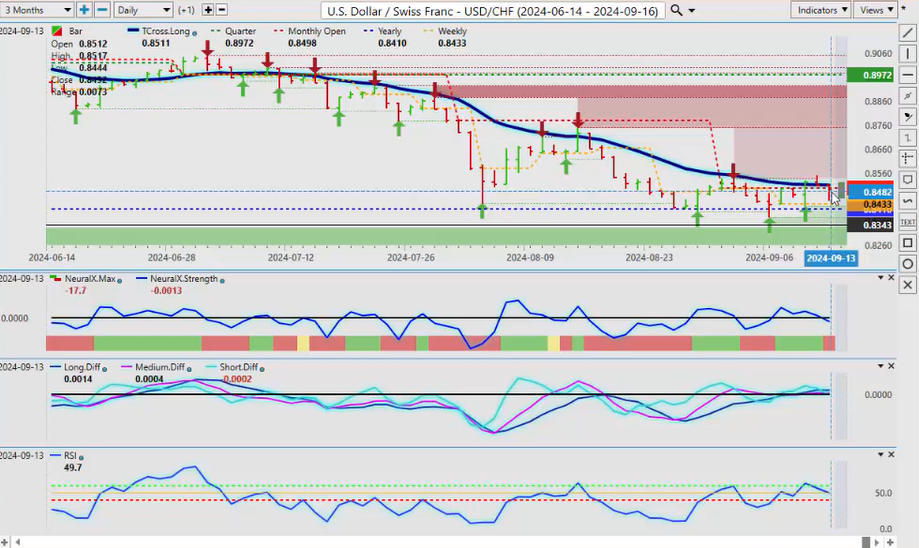
Now when we look at the US/Swiss Franc , I think we may have a buying opportunity next week, but the carry trade, guys, is the problem.
So once again, you see the importance of the current yearly opening price because it’s objective, not subjective. It’s a line in the sand; the current yearly opening price, this is where the battle lines are being drawn, and that is right at 8410. So I believe that we can push higher off this, but in a moment, I will mention the dollar/Yen , the Swiss Franc will get caught up in this carry trade unwinding, and I think that that is what’s going to happen in the year-end; they will start bailing out of the carry trade that will ultimately send this pair lower, but for now, for the month of September, we still have the potential for Longs. Our predicted differences are above the zero line, we don’t have confirmed downside momentum with the predicted RSI, the neural index is chopping back and forth, but the predicted differences are warning that there’s still upside potential, we just need to clear 8511.
British Pound versus U.S. Dollar
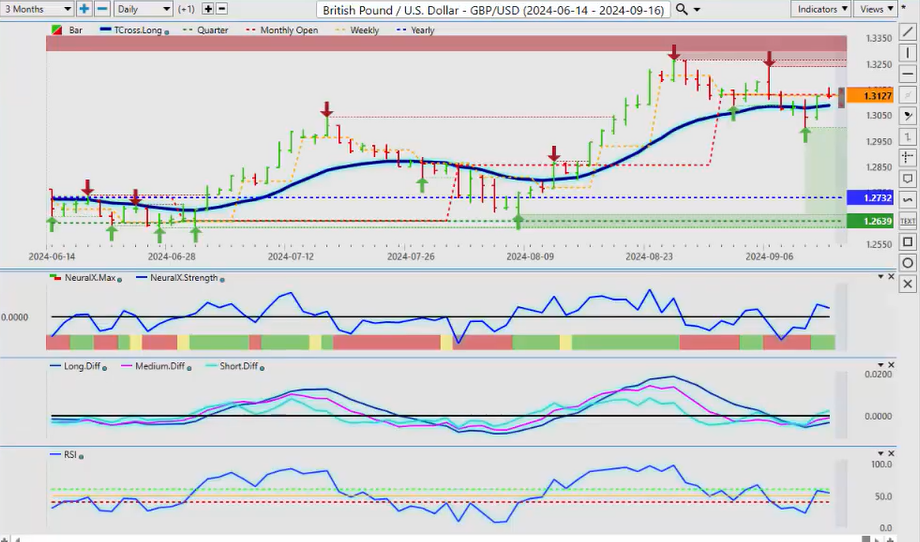
Now, the pound/dollar also recovering on the rumor mongering uh, going around about a 50 basis point cut, uh, I don’t see any pathway, and it would be a critical mistake if he does it, uh, again, uh, Roger Ferguson, a number of FED, only there was Dudley I think, the one FED member that did say he’s all for a 50 basis point cut, um, no, that’s not, uh, we haven’t seen 50 basis point cuts from the Bank of Canada, the Swiss National Bank, uh, the Bank of England.
Go again, guys, we’ve got a you don’t want to shock the market here, and a 50 basis point cut would do that. So I believe the pound/dollar will struggle here, uh, will definitely struggle around this area, a breakdown below the T cross cross long at 1.388 would allow us to sell this at least into month-end and maybe into the first week of October, but uh, again, the resistance areas are drawn in here for us to see because again, this is an Outlook, guys, not a recap of something that’s already taken place. So that high, 1.3266, we’ve not broken, we’ve got an additional verified resistance high at 1.3239, that is a lower high, guys, that’s what that is. So when we look at this, once again, it’s telling me that the dollar is not as weak as what they’re trying to make it out to be. So be very cautious with this one, but a breakdown below our T cross long, which we did see, uh, this past week, and the British pound , as you can see, it basically finished the week exactly where it started or slightly negative, but the media, the short-term traders, will spin this as it’s super bullish. Well, maybe it is, but uh, the indicators in VP are very conflicted, and the main thing I’m looking at here is it’s not showing momentum. Most short-, medium-, short- to medium-term indicators, even some of your long-term indicators do not see or understand seasonal patterns. So again, we’ll monitor this right now, but the British pound is nowhere near as strong as what it looks, same as the Euro.
U.S. Dollar versus Japanese Yen
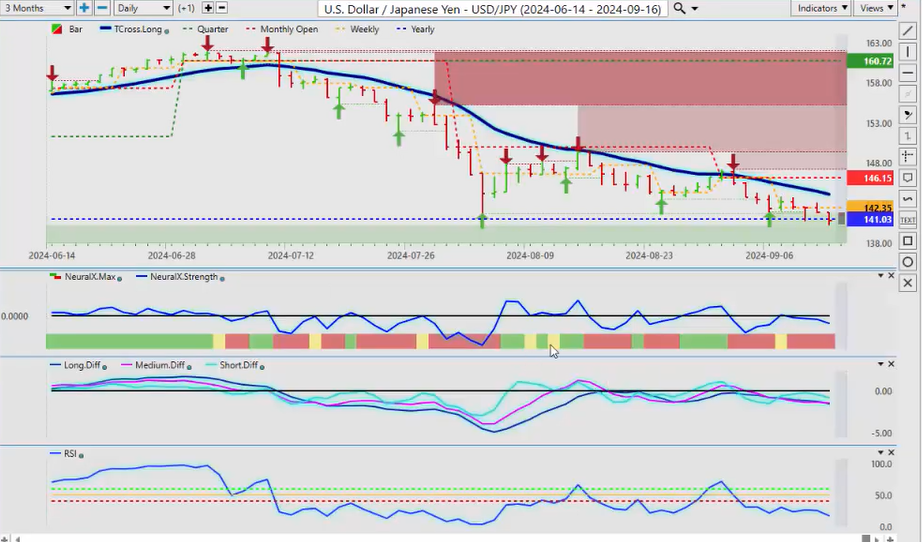
Now, with the dollar/Yen , uh, this is going to be one to watch here, guys, uh, because again, we’re right on this is, this is where the bulls and bears are fighting it out, right on the current yearly opening price.
Ultimately, we lose this, guys, uh, in my view, because of the carry trade. If the FED basically tells the market that he’s going to cut into year-end pretty much on a monthly basis, nothing’s going to change, that they are going to dump out of the dollar/Yen long trade, at that will also affect Euro Japan, Great Britain Japan, Aussie Japan, CAD Japan, all of these pairs will drop significantly. I think we have some very good opportunity into year-end shorting, uh, or going long, excuse me, the Japanese Yen which would be shorting dollar/Yen , shorting those cross pairs, but I also think we should be cautious about doing that until we get to the first week of October or end of the month. But if we lose this yearly opening price and we can stay below it, then we know exactly where our new resistance will be, that will be at the yearly opening price at 14103. That’s the way we want to look at playing this, guys, objectively, not bringing in short-term indicators that will cause confusion. This is the area to watch very closely, and of course, our critical Vantage Point T cross long at 14409.
Australian Dollar versus U.S. Dollar
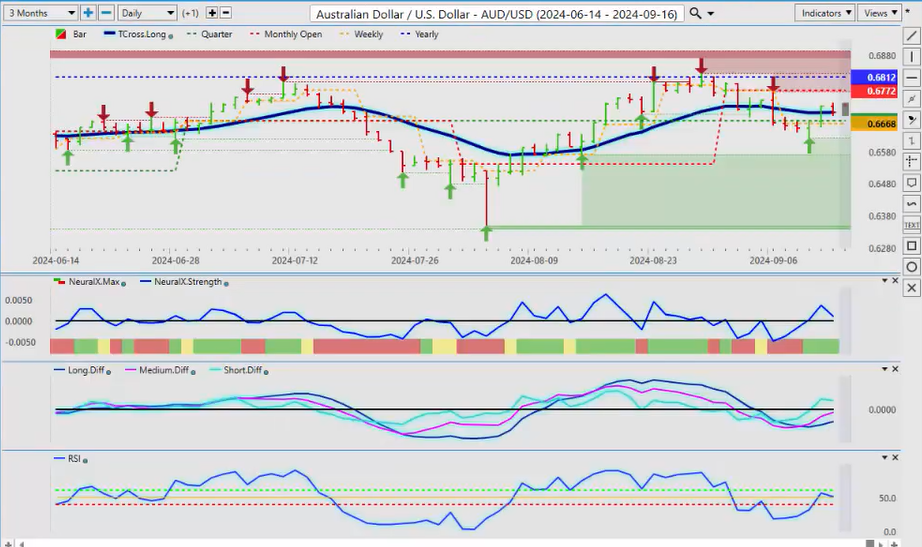
Now, with the Aussie and the Kiwi , this will be another interesting week
for these two. If stocks pull lower, then so will the Aussie/US and New Zealand/US , and US/Canada will go higher.
U.S. Dollar versus Canadian Dollar
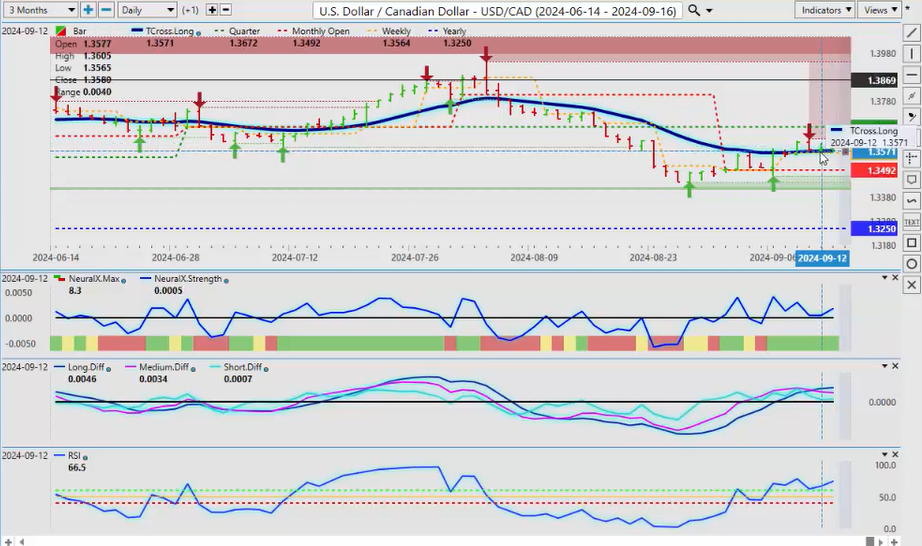
Now, when we look at US/Canada , first, you can see that US/Canada is holding right on the Vantage Point T cross long, virtually every day last week. So the T cross long and the monthly opening price, those are your supports here, and they’re backed up by the yearly opening price at 1.3250. So the monthly opening price at 1.35, a lot of activity down here, we can see this clear as day, right? And then we come up into the new month, and we can, this is very, very, or the new week, excuse me, and you can see how it’s staggered. So the quarterly opening price, 1.3672, yes, I believe there will be some type of dollar sell-off pre Fed or during the FED, but after that, remember, the interest rate differential between the Bank of Canada and the FED favors, still favors the FED, and Canada, the Canadian economy is very dependent on the US economy, so if the US dollar goes down, in most cases, the Canadian dollar will follow. So keep an eye on our TCross long, 1.3574, and the monthly opening price, our big level, 1.35, 1.3492.
Now looking at that with the
Aussie
, you can see that the
Aussie
once again has not been able to break above its current yearly opening price; it continues to fail into this, and this is an objective tool, a point-and-time tool in the Vantage Point software that helps traders understand how important it is, what is really defined as bullish or bearish. Well, again, you could define that with the T cross long, which I do, but I also add in the weekly, the monthly, these other levels, so I have a definitive answer because I just can’t trust what the media is saying on anything. Uh, somebody is feeding them information that is blatantly false, so right now.
I believe the
Aussie
is going to push higher to the monthly opening and then it’s going to struggle. Now, if
stocks
can recover into year-end, that’s when we buy the
Aussie
. But right now, the TR cross long, 6702, we need to hold above that.
New Zealand versus U.S. Dollar
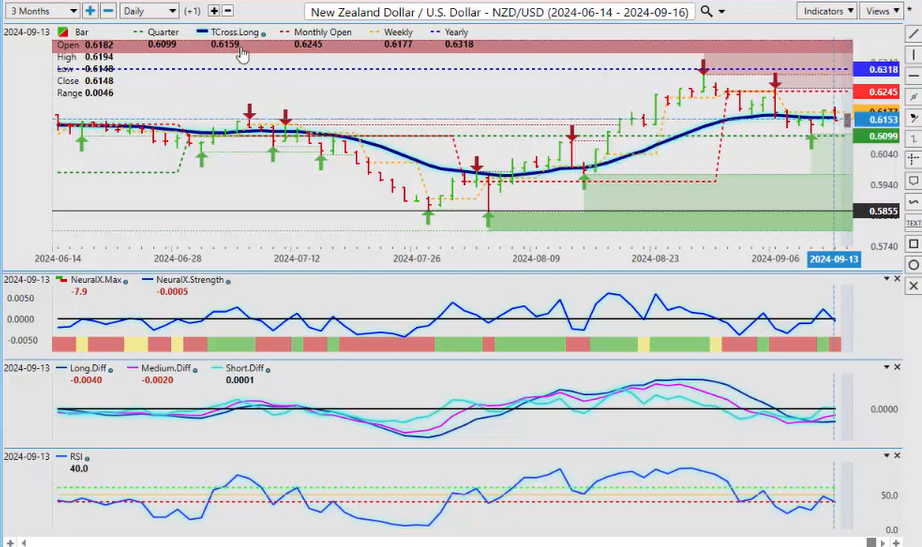
The Kiwi is the exact same trade, almost, guys. You can see they both rise at the same time, but the TR cross long there, 6159, uh, I believe it’s going to struggle. But you can see the structure, the market structure of the yearly opening at 6318, the monthly at 60245, and then we come down to even the weekly at 6177. So, using those levels with the Vantage Point predicted indicators, it gives the trader a very strong edge in very, very difficult trading times. We also apply our MA diff cross, which tells us which is a rever, a contrarian indicator, and a trending indicator; we want both, guys. So right now, we’ve got a mixed signal here. It will be a very, very choppy volatile week, but after we get past the FED, I think we will have some clear trending moves into the month-end. So with that said, this is the Vantage Point AI Market Outlook for the week of September the 16th, 2024.