| This week’s A.I. Asset Spotlight is Gold $GC |
The central tenet of technical analysis is that what everybody knows is reflected in the current price of an asset. Sometimes a chart can tell you a lot. Sometimes it fails to communicate anything at all. Today we will be diving deep into looking at Gold. I have learned to recognize that Gold is a report card on the U.S. Treasury and the Federal Reserve. When Gold moves, it is not supposed to make traders and investors rich. The entire rationale for Gold is as a store of value and protection of purchasing power over the long term. When Gold is increasing in price it empowers investors to understand what Gold is attempting to communicate about the economy and money in general.
In this asset study we will look at the current Macroeconomic environment and study the following indicators to get a current synopsis perspective on Gold.
In this stock study we will look at the following metrics and indicators.
1. 52-week high and low boundaries
2. The Best Case – Worst Case Scenarios
3. The WT Finance Institute A.I. Predictive Blue Line Analysis
4. Neural Network Forecast
5. Daily Range Forecast
6. Intermarket Analysis
7. Our Trading Suggestion
Owning gold as an investment and a store of value has been a trusted strategy for centuries. Here are the top ten reasons and the underlying philosophy for investing in gold:
**Wealth Preservation**:
– Gold has historically preserved wealth through economic downturns, maintaining its value as paper currency depreciated.
**Inflation Hedge**:
– Gold prices often rise when inflation takes hold. Since its price increases in response to events that cause the value of paper investments, like stocks and bonds, to decline, it serves as a hedge against inflation.
**Diversification**:
– Gold provides portfolio diversification. Its performance tends to be inversely correlated with the stock market, which is beneficial during times of market volatility.
**Currency Hedge**:
– Gold is a strong hedge against currency fluctuations, particularly in the U.S. dollar, which is the world’s primary reserve currency. When the dollar declines, gold prices in dollar terms typically rise.
**Safe Haven**:
– During periods of political and economic uncertainty, gold is seen as a safe haven asset that can maintain its value and provide stability.
**Limited Supply**:
– Gold’s supply is limited; mining can be expensive and challenging, which means that its scarcity supports its long-term value.
**Tangible Asset**:
– Gold is a tangible asset. Unlike stocks and bonds, which represent paper promises, gold is a physical commodity that you can hold, which has intrinsic value.
**Portfolio Performance**:
– Adding gold to a portfolio can enhance performance, especially in times of extreme market stress or when inflation is high, due to its negative correlation with other asset classes.
**Global Asset**:
– Gold is universally accepted around the world and can be sold in any country. Its global acceptance makes it an ideal investment for geopolitical diversity.
Philosophical Underpinnings:
The philosophy behind gold investment is rooted in its historical role as money. Unlike modern paper currencies that are subject to government control and economic variables, gold retains value independently of these factors. It’s worth is intrinsically perceived and universally recognized, transcending political and economic boundaries. This perception underpins its role as a “crisis commodity,” relied upon for its stability in times of economic instability. Investing in gold is often seen as a conservative strategy to protect against both overt economic crises and the erosion of wealth through less visible means, such as inflation and currency devaluation.
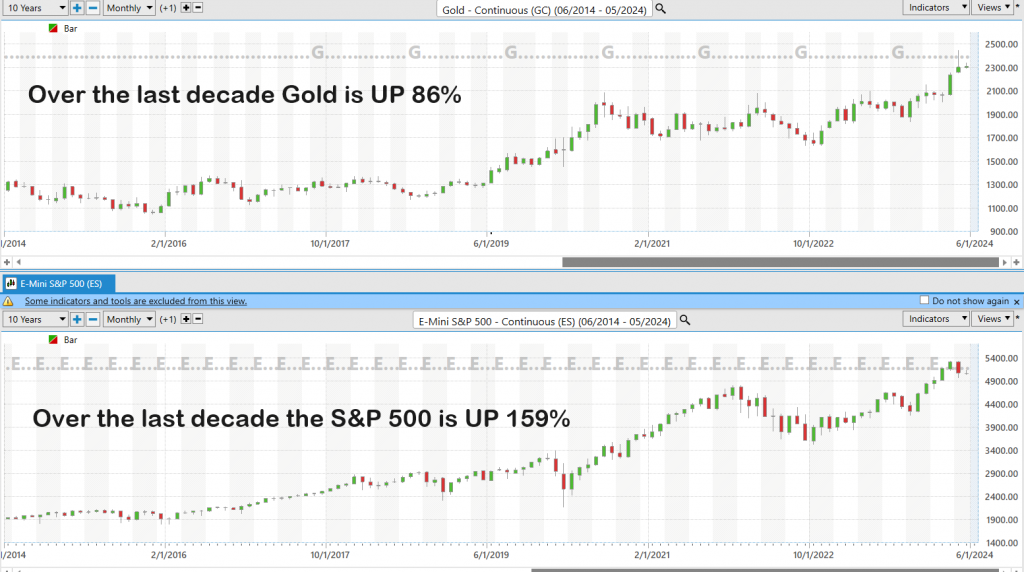
Let’s perform a multi-timeframe analysis on Gold going back 50 years. In this analysis I calculated the price of Gold on January 1 st on each year going back 50, 40, 30, 20 and 10 years, respectively. I then computed the percentage gain from each time frame. Most importantly, I measured the number of ounces that were equivalent to $1 million U.S. dollars over each timeframe.
When you perform a multi-timeframe analysis of gold prices, spanning several decades as illustrated, a clear and comprehensive picture emerges, revealing the profound extent of currency debasement over time. This analysis effectively demonstrates that the perceived increase in gold’s value is more accurately a reflection of the substantial depreciation of the currency.
As we observe the number of ounces of gold that $1,000,000 could buy drastically decreasing from 9,434 ounces in 1974 to just 484 ounces by 2024, it’s evident that gold’s purchasing power remains relatively stable, while the purchasing power of the currency has eroded. This shift underscores a critical insight: gold has not so much increased in intrinsic value; rather, the currency used to buy it has significantly weakened, highlighting gold’s role as a steadfast store of value in the face of currency dilution.
The takeaway is obvious when you look at Gold over numerous longer term time frames: Currency debasement is the name of the game in the macro-economic framework. This analysis was done in U.S. Dollars which are the reserve currency of the world. As the reserve currency of the world, it is safe to assume that historically the U.S. dollar has also been the strongest fiat currency in the world. So, simply imagine how bleak the fiat outlook is when measured in other less popular foreign currencies. If currency debasement is this apparent in the United States it is beyond comprehension is lesser developed countries and economies.
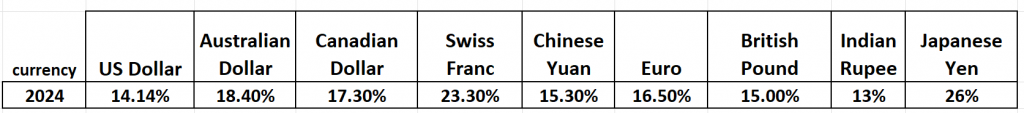
Here is a table of how Gold has performed in 2024 against the major foreign currencies:
Let’s dive into the crux of the matter—Jerome Powell and the Federal Reserve are seemingly on a path to ease monetary policy, considering multiple rate cuts and halving the pace of Quantitative Tightening, even though inflation remains a thorn in the side of businesses, as revealed by recent business surveys. Despite the Fed missing its 2% inflation target for three consecutive years, with CPI continuing its upward trajectory, Powell seems undeterred.
It seems that Jerome Powell and the Federal Reserve are stubbornly determined to slash interest rates and decelerate their Quantitative Tightening efforts. Now, one has to wonder, why such a relentless push in this direction? Well, it’s clear as day: the Fed’s priorities are skewed towards the banking sector, seemingly indifferent to the crumbling purchasing power of the dollar and the eroding living standards of everyday Americans. Our banks are drowning, with their assets tied up primarily in mortgage bonds and Treasuries that are currently underwater. Unless U.S. Treasuries post a significant rally, this will be the fourth year in a row that U.S. Bonds have lost a significant amount of value.
By chopping down these interest rates, the Fed is attempting to relieve some of the suffocating pressure on these sinking bond prices. U.S. Treasuries were once hailed as the gold standard for savers, synonymous with safety and reliability, offering a secure place for preserving capital. However, this condition has markedly shifted since March 2020; Treasuries have turned into a horrific investment, with plummeting returns amidst rising inflation and increasing interest rates. This shift creates a daunting economic environment for the U.S. Treasury as it faces the colossal challenge of refinancing trillions of dollars of American debt under these less favorable conditions.
But there’s more to this financial saga—right now, we’re facing a corporate refinancing wall. A staggering $1.8 trillion in corporate debt is queued up for refinancing by the end of 2025, and would you believe it, refinancing costs have surged by 45%. If that wasn’t enough, let’s not overlook the U.S. government’s own fiscal predicament. Interest payments on its colossal publicly traded debt are projected to skyrocket to a mind-boggling $1 trillion by 2025. As the national debt balloons, so does the burden of financing it.
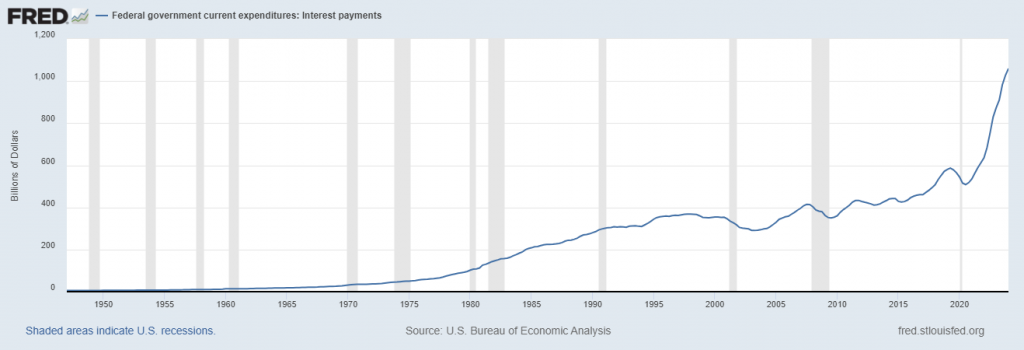
And then, there’s the American consumer to think about. Household debt has skyrocketed to an overwhelming $20 trillion, up significantly from $15.6 trillion just a few years ago in 2019. Americans are now saddled with more revolving credit than they had during the onset of the global financial crisis. This hefty load of credit card debt, home equity lines of credit, and personal loans has culminated in a staggering $200 billion loss in income throughout the Fed’s current cycle of tightening. With all these factors at play, it’s no mystery why Mr. Powell is in such a rush to slash borrowing costs. It’s a desperate move to keep the wheels turning, but at what cost to the average American and the long-term stability of our economy.
The prevailing narrative trumpeted by the usual suspects is that the U.S. economy is robust, and inflation will soon taper back to the coveted 2% target. But, folks, don’t be fooled—the reality couldn’t be further from this fantasy. Inflation is mercilessly ravaging the middle class.
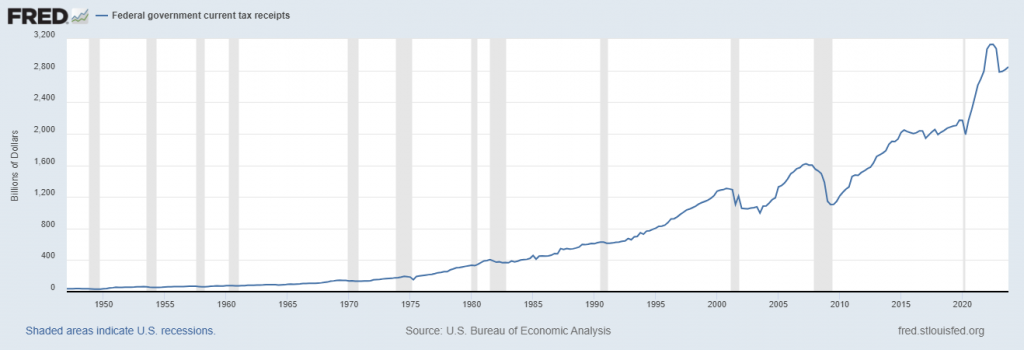
Here’s a chart of Total tax receipts to the U.S. government. Observe how they are down 11.4% over the past year. A simple question to ask is how can you have a robust and thriving economy when tax receipts which are transactional in nature are down double digits? The obvious answer is that the economy is neither strong nor robust.
Take a gander at the retail sales, which reportedly surged by 0.7% in March, smashing past the Dow Jones consensus estimate of a mere 0.3% increase. Strip away the auto-related sales, and you see a jump of 1.1%, again outpacing forecasts. The core control group, which is crucial for GDP calculations, also posted a 1.1% rise. Wall Street and the mainstream financial media were quick to celebrate these figures as signs of robust consumer spending. But here’s the kicker—they conveniently omit that these figures are in nominal terms. What this so-called increase really
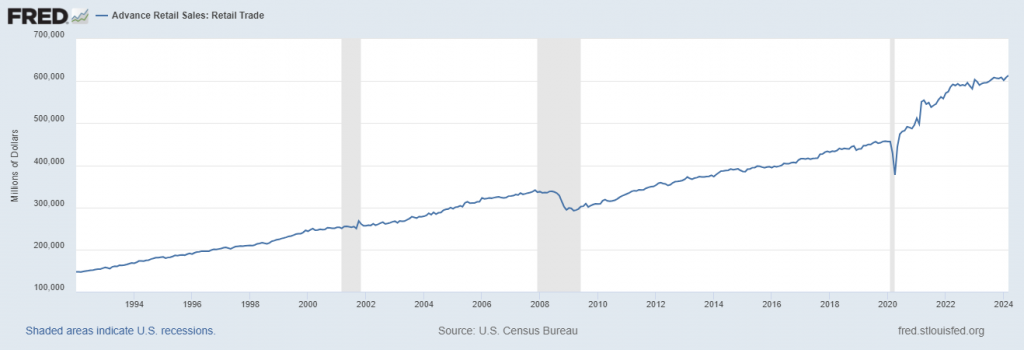
represents is not more goods being moved but higher prices across the board. Indeed, the 6% leap in the CRB Index’s 19 commodities this March likely translated directly to a sharp uptick in consumer prices. So, if you’re looking for the real scoop on consumer spending, it likely took a nosedive.
If retail sales were adjusted for inflation, that chart would be sloping downwards in a big way.
But it’s far easier to paint a rosy picture of a strong economy than to admit that we’re in the grips of soaring inflation, an issue our government seems ill-prepared to manage without sending our financial systems into a tailspin. In fact, it appears that our central bank is gearing up to push the inflation rate even higher.
As inflation spirals, it drives up yields. Remember, the Fed might dictate short-term interest rates, but it has no hold over the long-term counterparts, which are currently skyrocketing. This spike in yields is placing immense pressure on the real estate market. In March, housing starts plummeted by 14.7%, far exceeding the modest 2.4% decline anticipated. Building permits weren’t far behind, dropping 4.3% against expectations of a slight 0.9% fall .
With the home price-to-income ratio at historic highs and climbing mortgage rates, taxes, and insurance costs, the dream of homeownership is slipping out of reach for an increasing number of Americans. Let’s face it: You cannot claim to have a strong economy when real estate transactions are stalled, and home prices are so severely misaligned with what the market can realistically support.
It’s clear, our central bank is prioritizing the financial health of banks over the purchasing power of the U.S. dollar and consumer living standards. With significant assets in mortgage bonds and Treasuries now underwater, the Fed’s strategy seems to be aimed at alleviating the pressure on bond prices through lower rates. Additionally, a staggering $1.8 trillion in corporate debt faces refinancing by the end of 2025, with refinancing costs jumping 45%.
On a brighter note, the resilience of gold prices, fueled by geopolitical tensions and central banks’ diversification from U.S. dollars to gold, highlights the ongoing demand for this traditional safe haven. Notably, central banks, including those of Turkey and China, are actively increasing their gold reserves. At the same time, retail interest in physical gold remains robust, underscored by Costco’s venture into selling gold bars and silver coins, making precious metals more accessible to the average investor.
Imagine the scenario where home prices and stock valuations recalibrate to their historical norms relative to incomes and GDP—this would necessitate a plummet of about 40% from today’s inflated levels, a dire prospect that could destabilize the banking system and throw our economy into turmoil.
Turning to the bull market in gold, often deemed the truest form of money, we’re seeing a clear reflection of the harsh realities of our economy, rampant inflation, and the unsettling insolvency of the U.S. government. Why the surge in gold prices? Look no further than the current geopolitical tensions, notably exacerbated by Iran’s direct assault on Israel—a retaliation for an attack on its diplomatic facility in Syria. Furthermore, there’s a robust trend of foreign central banks diversifying their reserves away from U.S. dollars to gold, safeguarding their assets from the reaches of international sanctions and confiscations. Notably, the World Gold Council’s January 2024 report highlighted significant purchases by Turkey and China, adding a substantial 39 tons to their gold reserves, showcasing a strategic shift towards more stable assets.
Amidst central banks’ aggressive accumulation of gold, there’s a contrasting trend among private investors who have been divesting from paper gold, causing noticeable outflows from ETFs—a stark $2.8 billion loss over eight months. Yet, the narrative changes in the retail sector, where investors are increasingly drawn to physical gold and silver, spurred by Costco’s entry into the market. This move has democratized access to precious metals, making it feasible for everyday people to invest in gold at competitive prices, further evidenced by the constant stock shortages due to high demand. Costco’s venture is not just a business strategy; it’s a testament to the growing appeal of tangible assets in these uncertain times.
In my view, the driving force behind the surge in consumer demand for gold is a growing realization among investors that the Federal Reserve is struggling to maintain control over inflation and has entered a prolonged phase of suppressing interest rates. Essentially, our central bank appears trapped in a cycle where it must continuously print trillions of dollars each year, adding fuel to the inflationary fire, while simultaneously buying up Treasuries to keep interest rates from skyrocketing. This scenario leads to falling real interest rates, where nominal rates lag behind inflation, a desperate measure by the Fed to mitigate the U.S. government’s precarious financial state. Historically, these are the conditions under which gold flourishes.
It may seem unthinkable that such a scenario could unfold in the United States. Yet, who would have imagined two decades ago that we would see the U.S. running annual deficits in the trillions, largely financed by Federal Reserve actions? Unfortunately, it appears that Washington D.C. is steering our robust economy towards one crisis after another in the hopes of kicking the can down the road a little longer. The landscape for investors is evolving swiftly, signaling that traditional buy-and-hold strategies may require significant adjustments to adapt to these new economic realities.
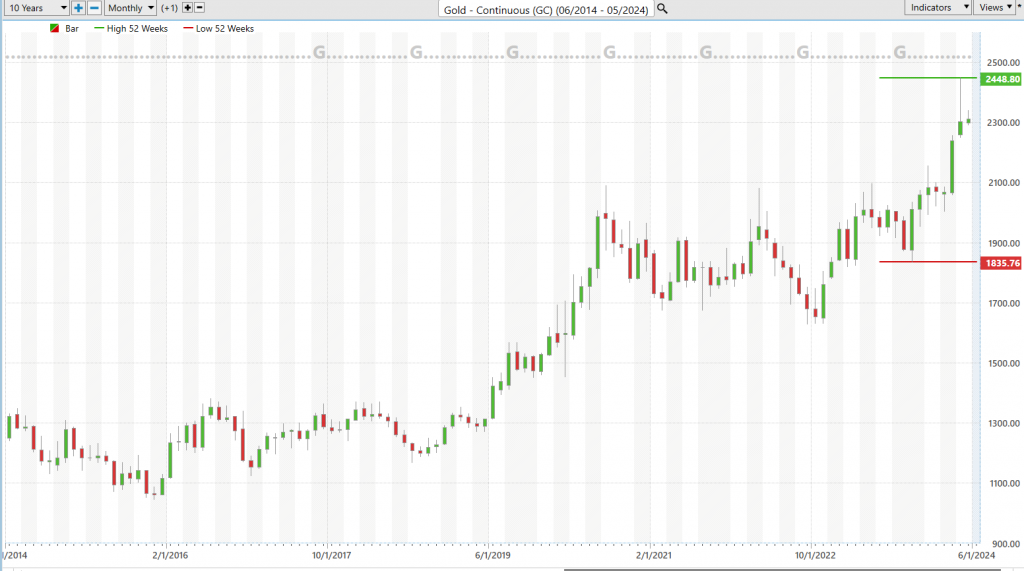
52 Week High and Low Boundaries
We always emphasize the importance of monitoring a stock’s 52-week high and low points, which essentially serve as a performance report card over the past year and offer a comparative perspective against the broader market.
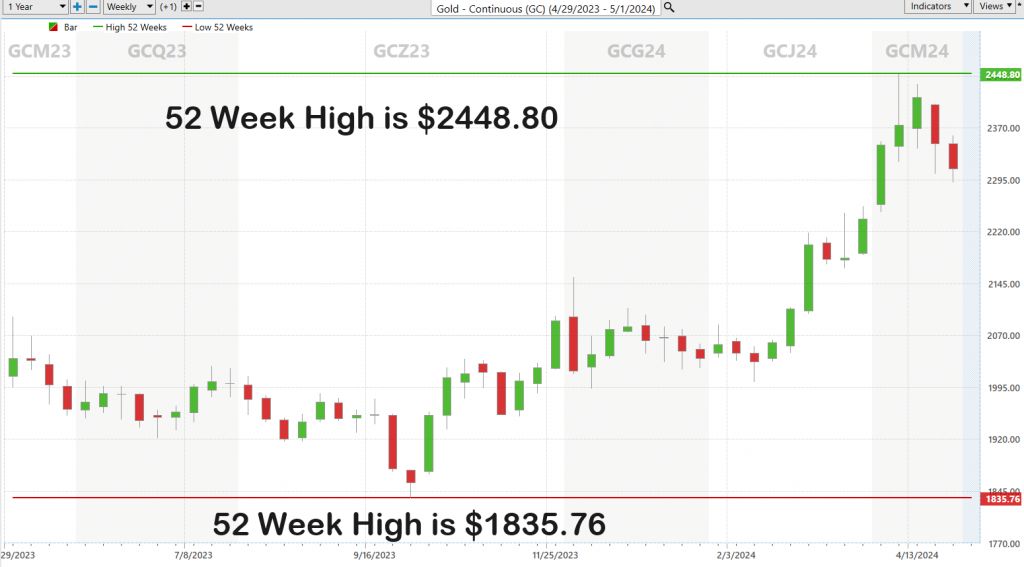
For example, in the last 52 weeks, gold has fluctuated between a high of $2448.80 and a low of $1835.76, marking a trading range of $613.04, or 27% of its current price. Notably, gold is trading at the 77th percentile within this annual range.
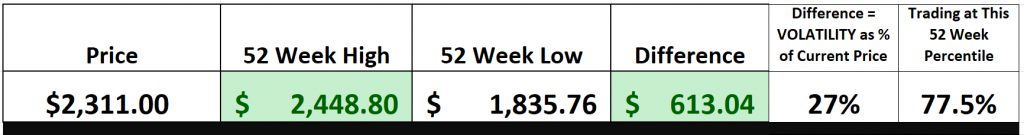
In the financial universe, the 52-week thresholds are not mere figures—they’re vital indicators of a stock’s robustness and market sentiment. These benchmarks symbolize the peak and trough of a stock’s journey through the year, providing crucial psychological reference points for investors. When a stock approaches its 52-week high, it’s generally seen as a bullish signal, suggesting strong demand and potential for further gains—attributes that draw investors seeking solid performance.
Conversely, a dip to a 52-week low might raise red flags, potentially indicating underlying issues and prompting investors to sell off to recalibrate their portfolios. These levels have stood the test of time in market analysis, offering invaluable insights that help decode market dynamics and investor behavior.
These metrics are beneficial for both seasoned traders and newcomers, providing a live tutorial on market forces and trading psychology, illustrating how external events like economic updates or news can sway investor sentiment and impact stock prices.
Ultimately, the 52-week markers offer more than just a snapshot of stock performance—they weave a narrative about market sentiment, opening a window into the collective mindset of the investment world. This insight is crucial, whether you’re maneuvering through short-term market swings as a day trader or plotting strategic entries and exits as a long-term investor. Such understanding, distilled from decades of market observation, encapsulates the enduring wisdom and evolving analysis of the financial landscape.
Here’s a look at the 52-week journey of gold, encapsulating its performance over the past year.
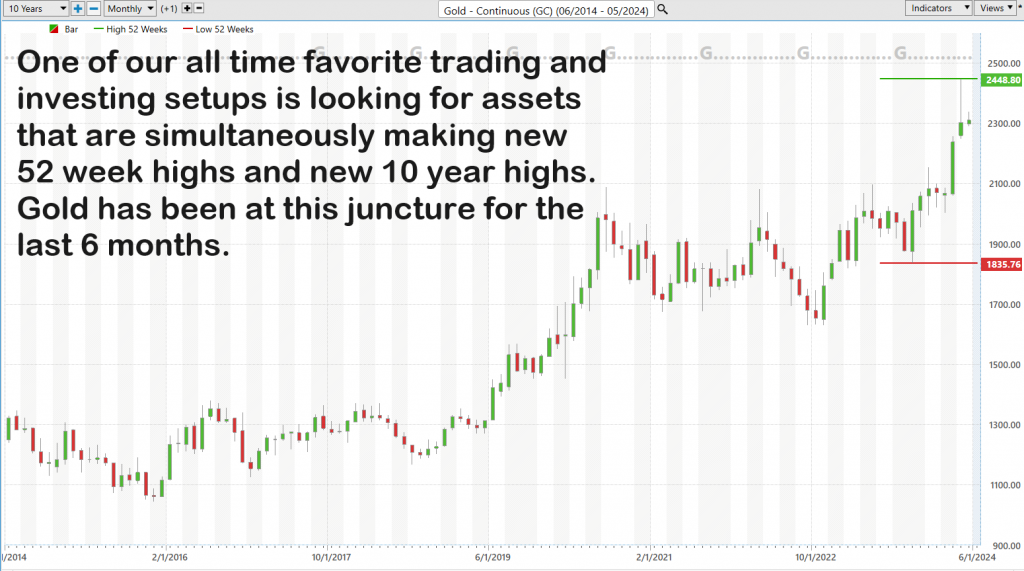
To truly understand the long-term trajectory of a stock, it’s essential to broaden your perspective—consider it akin to viewing a landscape through a panoramic lens. This broader view, such as analyzing a 10-year chart, doesn’t merely recount the past year but places it within a decade-long context, offering a clearer, fuller view of enduring trends. This approach, rich in data and insight, is indispensable for anyone dedicated to comprehending the forces that drive market trends.
Best-Case/Worst-Case Scenario
Every trader, whether a titan of Wall Street or a novice just starting out, needs a grounded understanding of risk and reward to navigate the markets successfully. One of the most straightforward yet profoundly effective methods to gain this perspective is what I like to call the “Feast or Famine” analysis. This approach entails a thorough examination of an assets performance over the past year by measuring the strength of its rallies against the depth of its declines. This isn’t just about numbers; it’s a practical exercise that teaches traders about normal price action and inherent volatility, fostering a realistic view of risk.
Consider this method akin to setting up a financial radar system, allowing you to understand the magnitude of prosperity or depths of declines that an asset has had. By dissecting the best and worst periods of market performance over the past year, you acquire crucial insights into both the potential upsides and pitfalls of your investments. This strategic analysis does more than just deepen your market understanding—it equips you with the tools to handle the inherent volatility of trading, enhancing your confidence and control over your investment decisions.
Here’s how it works: in the best-case scenario analysis, you map out the most significant rallies, giving you insight into potential gains and the psychological climate of the market over the past year.
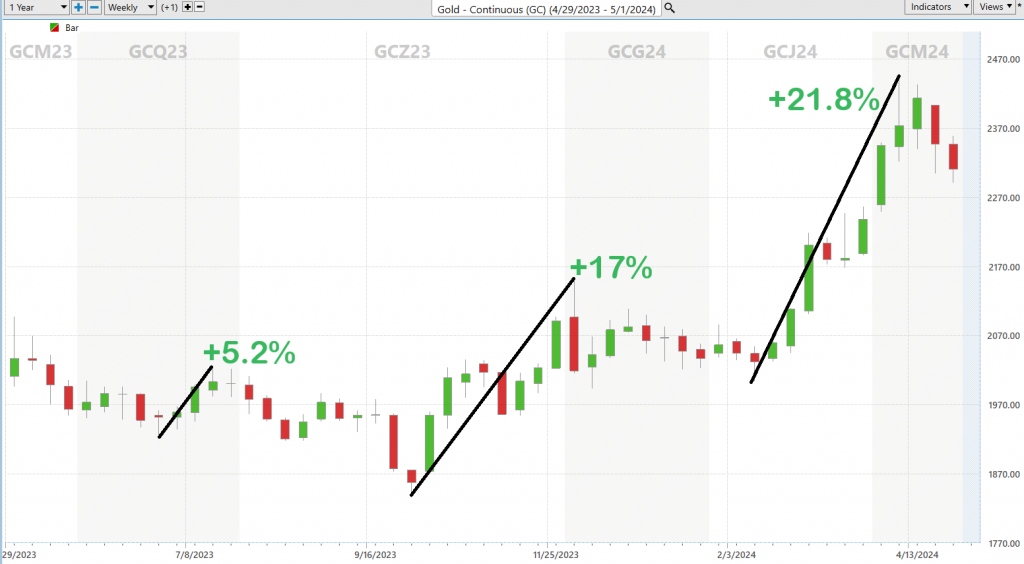
Conversely, by examining the worst declines, you familiarize yourself with the possible risks, preparing yourself for the toughest times that could lie ahead.
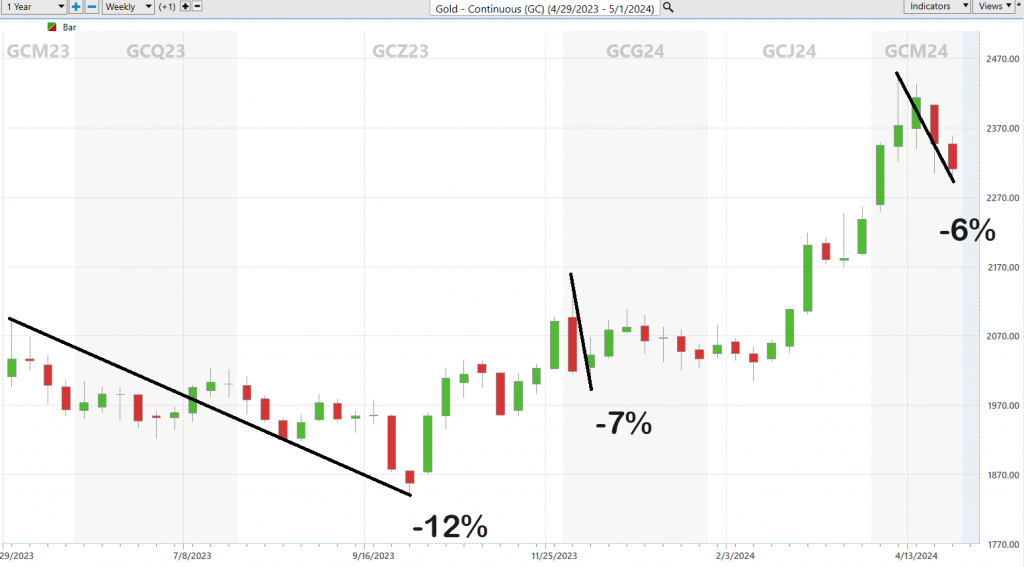
Before you commit your hard-earned money to the market, take a moment to perform this detailed analysis. Think of it as illuminating your path through the financial landscape, arming you for any uncertainties that might come your way. This method transcends mere clever investing; it’s about crafting a strategy that aligns with your financial aspirations and risk tolerance. By applying such analyses, especially over longer time frames, you don’t just prepare financially—you also fortify yourself psychologically by basing your decisions on historical norms.
Moving forward, a comparative analysis of Cash Gold to the broader stock market average also highlights and illustrates the rewards and risks of investing in the barbarous relic. I am always fascinated by the reality the reality that most traders are completely unfamiliar with Gold’s performance.

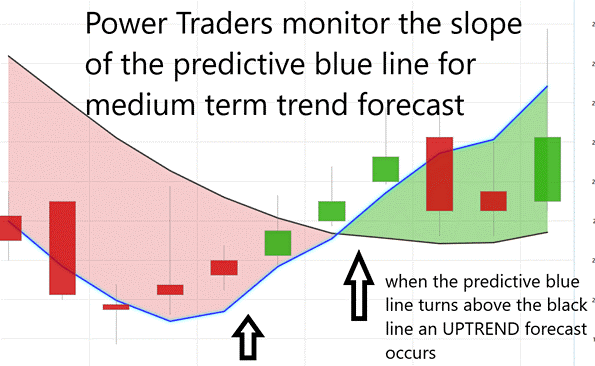
The WT Finance Institute A.I. Predictive Blue Line Analysis
Here are our guiding principles in trading that are revolutionizing the way we approach the markets:
**Trend Analysis**: Understanding the trajectory of the predictive blue line is crucial for forecasting the future direction of stocks like $UAA. A rising slope on this line suggests a bullish trend, signaling an increase in the stock’s price, while a downward trajectory warns of a potential fall, signaling traders to brace for a possible decline.
**Value Zone Identification**: This predictive blue line defines what we call the ‘Value Zone.’ For savvy traders, this means pinpointing prime buying opportunities when the stock’s price hovers at or dips below this line during an upward trend. Conversely, it’s a cue to consider selling when the price ascends above this line during a downward trajectory.
**Market Positioning**: A downtrend in the predictive blue line should alert traders that it might be time to sideline their investments or hedge against anticipated drops. This strategic positioning is essential for managing risk in an uncertain market.
Leveraging advanced artificial intelligence, like that employed by WT Finance Institute Software, has transformed trading strategies, particularly with assets like Gold. The predictive blue line serves not merely as a tool but as a beacon through the often-opaque waters of trading, steering investors towards potentially profitable ventures.
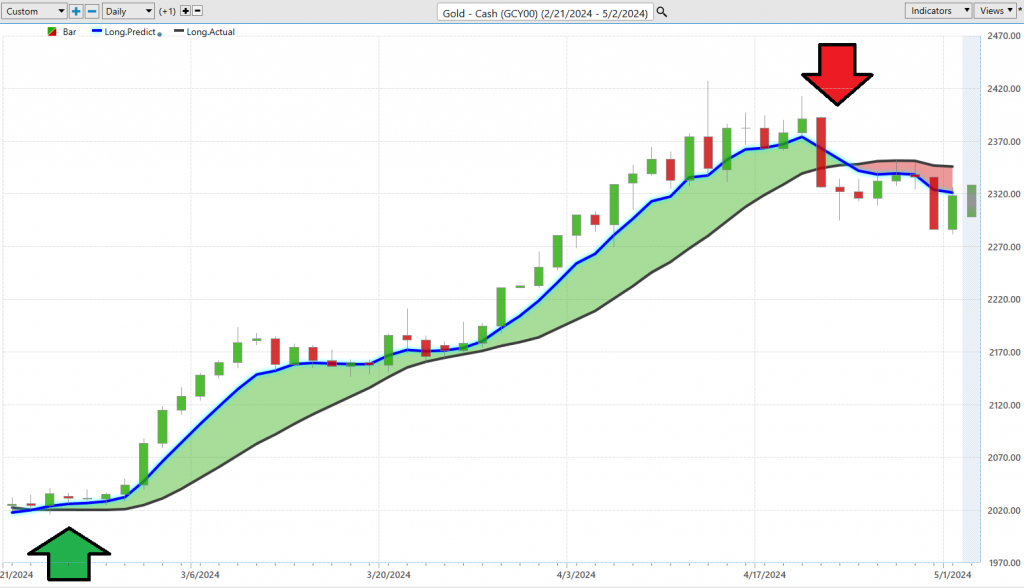
The predictive blue line, developed by WT Finance Institute, stands out as more than just an analytical tool—it’s a direct gateway to understanding market dynamics. This AI-powered line offers real-time insights and foresight, giving traders the upper hand by anticipating market movements before they unfold. With AI-driven analysis, WT Finance Institute decodes complex intermarket relationships and predicts upcoming shifts, offering traders a definitive edge in a rapidly changing market landscape. By adopting such cutting-edge technology, investors not only navigate but also capitalize on market opportunities, safeguarding their investments against volatility. This integration of sophisticated AI with intuitive market tools like the blue and black lines illuminates the path for traders, enhancing their ability to traverse the financial market’s uncertainties with greater confidence and precision.
Observe how effectively the blue line has charted the course for trends in gold. Yet, before committing to a trade based solely on one indicator, we also seek validation from additional AI tools to ensure our moves are well-founded.
Neural Index (Machine Learning)
Neural networks in trading are groundbreaking computational models, mirroring the human brain’s structure and function. These models are built with layers of interconnected nodes, or “neurons,” which perform complex calculations and process data much like our brains process sensory input. In the realm of trading, these neural networks are particularly adept at recognizing patterns, allowing them to discern complex, nonlinear relationships within market data that might elude human traders or traditional statistical approaches. This skill is invaluable in the ever-changing landscape of the financial markets, where these models continuously evolve and learn from new data.
The deployment of neural networks in trading is nothing short of revolutionary. They equip traders with a cutting-edge tool that can predict market trends, thereby enhancing decision-making, optimizing risk management, and potentially boosting returns. These networks sift through massive datasets to detect patterns and correlations that are not apparent to even the most seasoned traders, essentially providing them with the ability to anticipate market movements. This predictive capability enables traders to spot profitable opportunities and nascent trends swiftly, affording them a substantial edge in making prompt and well-informed trading decisions.
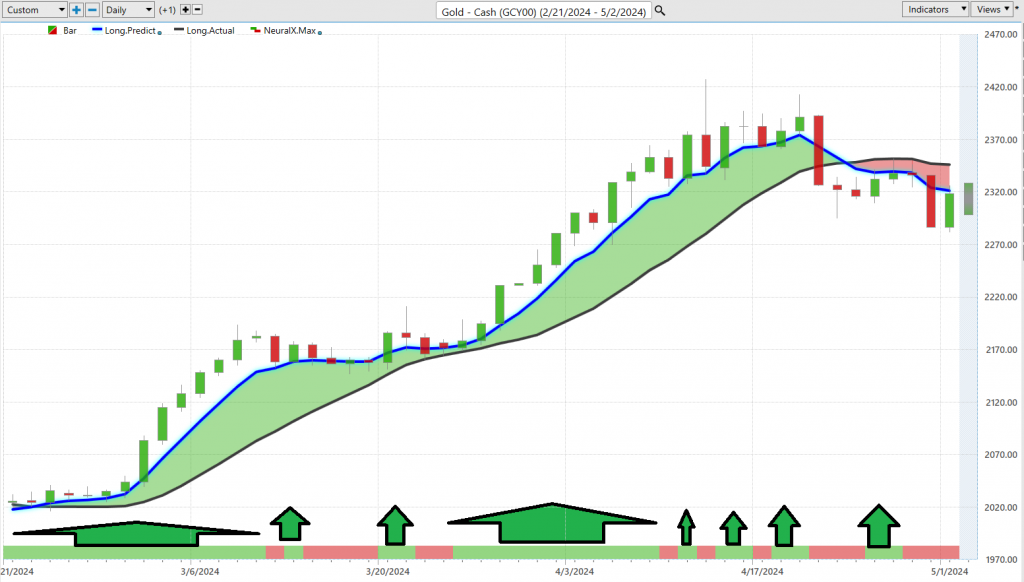
For example, in trading platforms like WT Finance Institute, the neural network indicator acts as a strategic asset. It is visually represented on charts, often illuminated in green to signal robust market conditions or red to indicate potential downturns. The synergy created by integrating neural networks with conventional charting tools, such as the Predictive Blue Line, significantly amplifies the efficacy of these instruments by offering “double confirmation” signals. This layered approach does more than just guide traders to likely profitable engagements; it also shepherds them through the intricacies of the market with unmatched precision and foresight. This advanced technology fundamentally enhances trading strategies, proving indispensable for traders intent on utilizing state-of-the-art technology to dominate the market.
What sets WT Finance Institute owners and power traders apart is their methodical search for alignment between the Neural Index and the Predictive Blue Line, aiming for high-probability short-term trading opportunities. When both indicators point in the same direction, it signals a trading opportunity with very high probability, bolstering confidence in their strategic choices.
The WT Finance Institute A.I. Daily Range Forecast
All traders must clearly differentiate between dreams of rewards versus the threat of loss.
Over the last 25 years the largest annual trading range of gold has been about 19% of the high price of each year. This metric aligns with what we uncovered earlier in the best-case/worst case scenario analysis and also provides insight into what is considered to be normal historically in terms of pullbacks.
I always urge investors to do their own due diligence and perform their own calculations.
Here is some data that the majority of traders and investors are unaware of.
On January 1, 1974, Gold was trading at $106 per ounce.
On May 1, 2024, Gold closed at $2169 per ounce.
This represents a gain of 1,946% which works out to roughly a 6% annualized rate of growth and return compounded over a half a century.
Now compare that value and metric with the growth of the m2 money supply.
The average annual growth rate of the M2 money supply over the last 50 years is typically estimated to be roughly 6%.
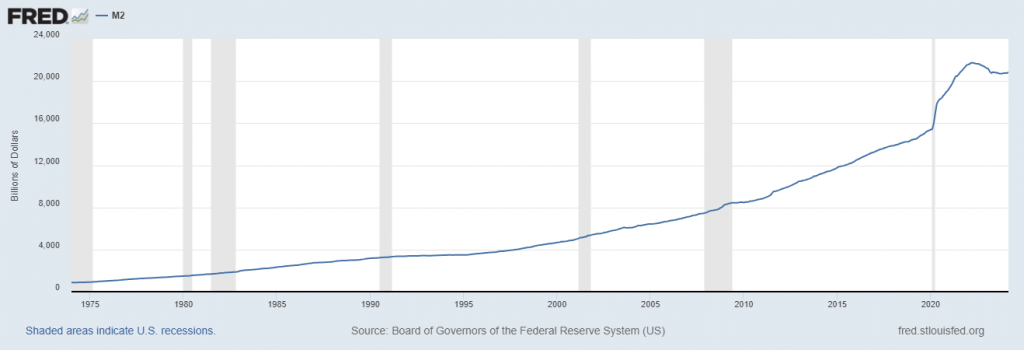
This growth rate underscores the substantial increase in the monetary base over the decades, reflecting both the expansion of economic activity and the various phases of monetary policy aimed at managing economic cycles. More importantly it also underscores the reason for the massive increase in Golds price. The currency has been massively debased.
Navigating the complexities of market entry and exit points is a formidable challenge for traders, exacerbated by the often-deceptive nature of market volatility. In this context, WT Finance Institute Software emerges as a critical tool for short-term traders, providing them with the ability to isolate and forecast daily trading ranges for each trading day.
The mastery of market dynamics goes well beyond simple access to data; it demands the conversion of this data into actionable strategies. This is where advanced technologies like artificial intelligence (A.I.), machine learning, and neural networks play a pivotal role. These technologies serve as sophisticated navigational aids in the turbulent seas of the financial markets, offering traders clear insights into market trends and remarkably precise forecasts of trading ranges. This capability significantly reduces the guesswork that traditionally clouds trading decisions.
Consider, for example, the accompanying chart of Gold. It demonstrates the WT Finance Institute A.I. Daily Range Forecast’s remarkable precision in predicting daily trading ranges, a boon for those looking to swing trade the gold market. This tool doesn’t just forecast; it provides a crystal-clear depiction of expected daily market movements and delineates market trends and projected trading ranges. Such clarity empowers traders to strategize their market entries and exits with enhanced confidence.
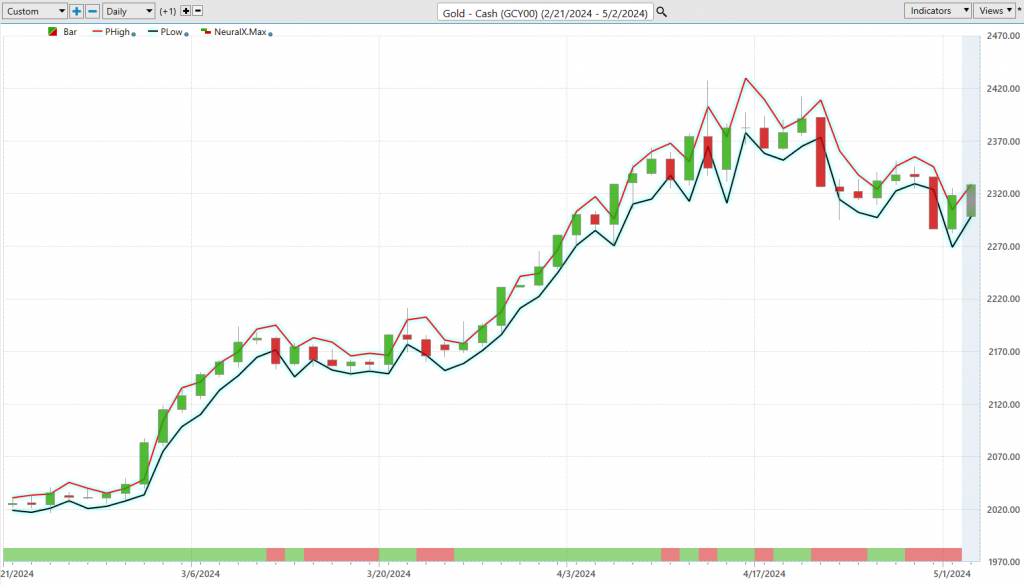
By leveraging such sophisticated analytics, traders are able to transform complex market data into pragmatic, actionable trading strategies. This not only opens doors to substantial growth opportunities within unpredictable financial markets but also underscores the importance of precision in predictive analytics for traders aiming to effectively leverage market dynamics to their advantage.
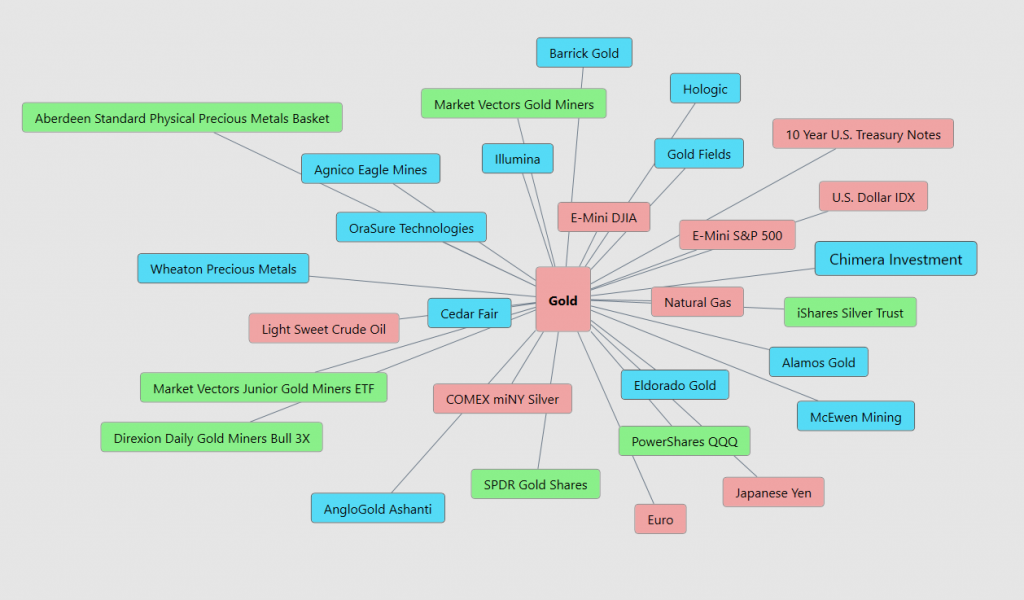
Intermarket Analysis
Intermarket analysis is a sophisticated trading strategy that examines the correlations and relationships between different asset classes like equities, bonds, commodities, and currencies. This method extends beyond analyzing a single market in isolation and explores how these asset classes interact and influence each other. The foundational theory of intermarket analysis posits that these markets do not function independently but are interconnected through a complex network of influences, impacting each other’s performance.
For gold investors and traders, intermarket analysis offers invaluable benefits. It provides predictive insights into how shifts in other markets can affect gold prices, which is crucial during times of economic uncertainty when gold is often viewed as a safe haven. By analyzing movements in the forex market, particularly the U.S. dollar against other major currencies, traders can better predict changes in gold prices. Additionally, this analysis aids in identifying inflation trends and understanding commodity correlations, which are essential for managing risks and making informed decisions on when to enter or exit positions. Overall, intermarket analysis not only deepens investors’ understanding of market dynamics but also enhances their strategic capabilities in navigating the complexities of a globally interconnected financial landscape. Studying the intermarket analysis graphic below also offers some hidden gems that have not been discovered by the financial media.
Our Suggestion
We are in a Presidential Election year. The concept that the party in power during a presidential election year might paint an excessively rosy picture of the nation’s economic and social landscape is deeply entrenched in the “political business cycle” theory that political scientists often discuss. This maneuvering is a deliberate effort to skew public perception, making everything appear splendid under their governance, hence boosting their chances of reelection. The tactics employed can range from ramping up government spending, cutting taxes, to introducing quick economic fixes—strategies designed to give the economy a short-term uplift and sway voter sentiment.
This strategy also involves the careful timing of policy rollouts to ensure that the electorate feels these economic ‘highs’ just as they head to the polls. However, these maneuvers often draw significant criticism for prioritizing electoral gains over long-term economic stability, raising concerns about the sustainability of such policies. It’s a calculated gamble, with the ruling party betting on the electorate’s focus on immediate gains over future repercussions, a strategy that underscores the tactical, if not cynical, use of power in the political arena. This political business cycle occurs on both sides of the aisle.
Amid the economic tempest that is 2024—marked by inflation, escalating international conflicts, ballooning debt, soaring taxes, and climbing living costs—your financial stability hangs in the balance. Gold stands as a crucial lifeline. Witnessing unprecedented price surges in 2023 and 2024, with predictions by JP Morgan of even higher peaks by 2025, gold should be at least 10% of your liquid portfolio to act as a counterbalance to central planners.
Keep in mind that over the last 2 years Central banks globally have been amassing gold, underscoring its timeless value in times of crisis. Gold offers a robust shield against the erosion of wealth due to inflation and market volatility, safeguarding your assets amid growing uncertainty. It’s no wonder savvy investors are gravitating towards gold, recognizing it as a pivotal asset for wealth preservation in these chaotic times.
Short term traders should follow the artificial intelligence for daily guidance and practice good money management on your trades.
Let’s Be Careful Out There!
It’s Not Magic.
It’s Machine Learning.
Disclaimer: THERE IS A HIGH DEGREE OF RISK INVOLVED IN TRADING. IT IS NOT PRUDENT OR ADVISABLE TO MAKE TRADING DECISIONS THAT ARE BEYOND YOUR FINANCIAL MEANS OR INVOLVE TRADING CAPITAL THAT YOU ARE NOT WILLING AND CAPABLE OF LOSING.
WT Finance Institute’S MARKETING CAMPAIGNS, OF ANY KIND, DO NOT CONSTITUTE TRADING ADVICE OR AN ENDORSEMENT OR RECOMMENDATION BY AI Wealth Creation 4.0 OR ANY ASSOCIATED AFFILIATES OF ANY TRADING METHODS, PROGRAMS, SYSTEMS OR ROUTINES. WT Finance Institute’S PERSONNEL ARE NOT LICENSED BROKERS OR ADVISORS AND DO NOT OFFER TRADING ADVICE.