| This week’s a.i. Stock Spotlight is Levi Strauss ($LEVI) |
Levi Strauss & Co., known globally by its brand Levi’s, stands as a testament to longevity and innovation in the apparel industry, especially in the denim sector. This narrative not only reflects on its historical and financial journey but also weaves in lesser-known facts that underscore its cultural and business significance.
Founded in 1853 by Levi Strauss during the California Gold Rush, Levi’s started as a wholesale dry goods business in San Francisco, eventually evolving into a global icon in the denim industry. The turning point came when Levi Strauss and Jacob Davis patented the process of adding rivets to pants, marking the birth of the world’s first blue jeans.
Levi’s underwent various financial phases; it initially went public in 1971, privatized in 1985, and re-entered the public markets in 2019. Its financial strategy has been marked by cautious debt management, ensuring resilience against economic downturns.
When you study the financials of the company all you have to do is look at Revenue and Earnings to recognize that the apparel niche is highly competitive and that $LEVI is having challenges growing earnings long term but is having an impressive run over the past 52 weeks.
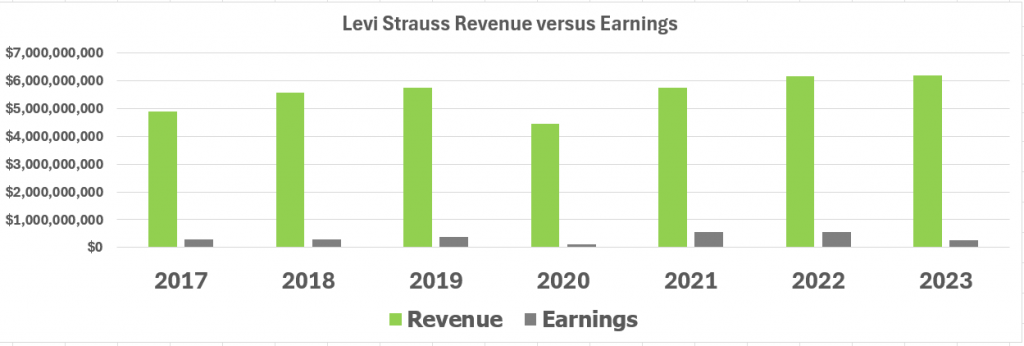
Revenue is growing slowly while long-term earnings are being squeezed.
But let’s look at the numbers here because they tell a story. Levi Strauss & Co. has been delivering a punch above its weight in the earnings ring over the past year. Over the past four quarters, the company has not just met, but exceeded earnings expectations, consistently outperforming the consensus estimates set by Wall Street’s soothsayers. On April 3, 2024, Levi Strauss came through yet again, reporting an earnings per share (EPS) of $0.26, handsomely topping the consensus estimate of $0.21, while also surpassing revenue expectations by 1.47%.
Looking forward to the current fiscal year, expectations are set for Levi to post earnings of $1.27 per share on a revenue backdrop of $6.36 billion. That, my friends, represents a robust 15.45% surge in EPS with a solid revenue growth of 2.88%. And the horizon continues to look bright into the next fiscal year, with projected earnings climbing further to $1.46 per share and revenue forecasts stretching to $6.67 billion. This outlook suggests a year-over-year growth of 14.96% in EPS and 4.98% in revenues. These figures aren’t just numbers; they’re a testament to a company that’s consistently pushing the boundaries of performance and profitability in the highly competitive apparel market. Levi’s is not just wearing the jeans; they’re making them and making them count.
In a brilliant stroke of what some might call serendipitous marketing, Levi Strauss & Co. recently experienced a notable uptick in its visibility and consequently, its stock value, following a mention by Beyoncé in her new song “Levii’s Jeans” from her album “Cowboy Carter”. The song, sprinkled with a dash of playful reverence to the iconic denim brand, not only caught the attention of Beyoncé’s vast fan base but also resonated widely across social media platforms and the general public.

Responding with equal whimsy, Levi’s altered its Instagram handle to “Levii’s”, cleverly adding an extra ‘i’ to mirror the song’s spelling—a nod that was both an acknowledgment and a thank you to the artist. The brand further tweaked its Instagram bio to “FKA Levi’s” and incorporated a bee emoji, a subtle homage to Beyoncé’s devoted followers, the Beyhive.
This modern saga of celebrity endorsement underscores a significant shift in branding and marketing strategies, where cultural influence and social media savvy can translate into real economic value. After Beyoncé’s mention, Levi’s saw a striking 20% surge in its stock price, underscoring the potent impact of pop culture on consumer behavior and brand engagement. This phenomenon is not new—recall the “Red Lobster” line in Beyoncé’s 2016 song “Formation”, which reportedly boosted the restaurant chain’s sales by 33% shortly after the song’s release.
What’s compelling here is the informal yet impactful collaboration between Beyoncé and Levi’s through her lyrics, showcasing a trend where the lines between entertainment, consumer culture, and corporate branding blur. The strategic confluence of music, fashion, and business not only cements Levi’s enduring relevance in the denim industry but also illustrates the increasingly symbiotic relationship between pop culture and business dynamics.
But critics pounce on these endorsements as an opportunity for struggling companies to manufacture “meme stocks.” To many this is a valid concern . But, Levi Strauss is making a significant pivot in its business strategy. The iconic denim giant is striving for a balanced sales approach—aiming to sell almost equally through its own branded stores and via other retail partners. Currently, direct-to-consumer sales make up 40% of its total, marking a strategic shift towards greater control over its brand and customer relationships. However, it’s worth noting, Levi Strauss is holding back on divulging same-store sales figures, leaving some cards close to the vest as it navigates this transition.
Here’s a little wrinkle in the story: Levi’s is undergoing some major shifts, but it’s tough to gauge the actual performance of its own stores. Historically, Levi’s bread and butter has been wholesaling—selling its jeans and jackets to other retailers who then flip the merchandise to you and me. That wholesale business still represents a whopping 60% of Levi’s revenue. Meanwhile, their direct-to-consumer game, which includes those Levi’s stores we see at the mall and their online sales, has ramped up to account for 40% of their total revenue as of the third quarter. The big question remains, how well is this strategy working? Levi’s is playing it close to the vest and not giving up the goods on their same-store sales numbers.
The core of Levi’s revenue stems from its denim products, supplemented by a diverse range of casual wear, accessories, and footwear, channeled through segments in the Americas, Europe, and Asia. The brand’s significant revenue source is its direct-to-consumer sales, including e-commerce and company-operated stores, highlighting a shift in retail strategy particularly accelerated by the pandemic.
Despite its stronghold in denim, Levi’s faces intense competition from brands like Wrangler, Lee, Diesel, and broad-spectrum apparel companies like Nike and Adidas, pushing Levi into continuous innovation and expansion. Its recent acquisition of Beyond Yoga in 2021 exemplifies its strategy to diversify beyond traditional denim.
Strengths of Levi’s include its iconic brand reputation and loyal global customer base. However, its focus on denim is a double-edged sword, posing a risk as consumer preferences shift towards athleisure and casual wear. Opportunities for growth lie in emerging markets and expanding digital sales, while threats include economic volatility and supply chain disruptions.
Levi’s has not only shaped fashion but also culture.
Wall Street views Levi as a stable investment with robust brand equity. Analysts focus on its strategic direct-to-consumer initiatives and international growth potential, positioning it as a leader in the denim segment, despite broader apparel industry challenges.
Levi Strauss & Co.’s journey from a San Francisco dry goods store to a global denim powerhouse reflects its adaptive strategies and deep cultural impact. It illustrates a company not just surviving but thriving by constantly reinventing itself in the face of shifting market dynamics and consumer preferences. For traders and market watchers, Levi’s embodies a blend of historical legacy with modern market acumen, making it a fascinating subject in the landscape of global apparel.
In this stock study we will look at the following metrics and indicators.
1. Wall Street Analysts’ Estimates
2. 52-week high and low boundaries
3. WT Finance Institute A.I. Predictive Blue Line
4. The Best Case – Worst Case Scenarios
5. Neural Network Forecast
6. Daily Range Forecast
7. Intermarket Analysis
8. Our Trading Suggestion
We don’t base decisions on things like earnings or fundamental cash flow valuations. However, we do look at them to better understand the financial landscape that a company is operating under.
Wall Street Analysts’ Estimates
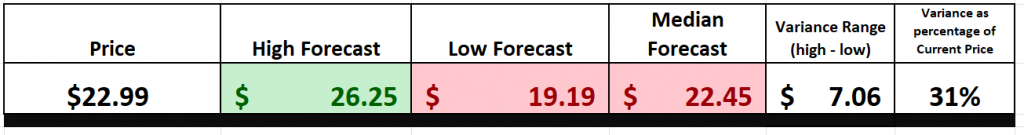
18 Wall Street analysts have provided their 12-month price targets $LEVI. The consensus suggests a median target of $22.45, with projections ranging from a low of $19.19 to a high of $26.25.
In this segment of our analysis, we focus on the disparity in forecasts provided by the most optimistic and the most pessimistic analysts on Wall Street. Such a differential offers insight into the expected range of market volatility for the upcoming year. Presently, this variance stands at $7.06, equating to approximately 31% of the current stock price. This level of forecasted volatility aligns with typical market expectations, suggesting a standard range of price fluctuations based on differing analyst viewpoints. This measure is crucial for investors seeking to understand the breadth of potential market movements within the year.
52-Week High and Low Boundaries
In the world of trading, keen observers often look to a stock’s 52-week trading range as a sort of fiscal report card, providing a clear snapshot of performance within the broader market context over the past year.
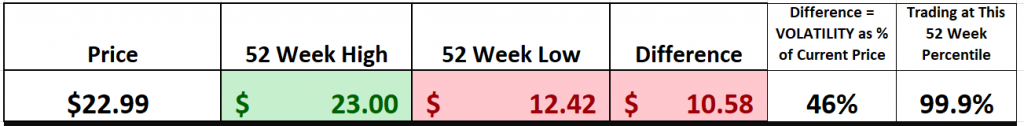
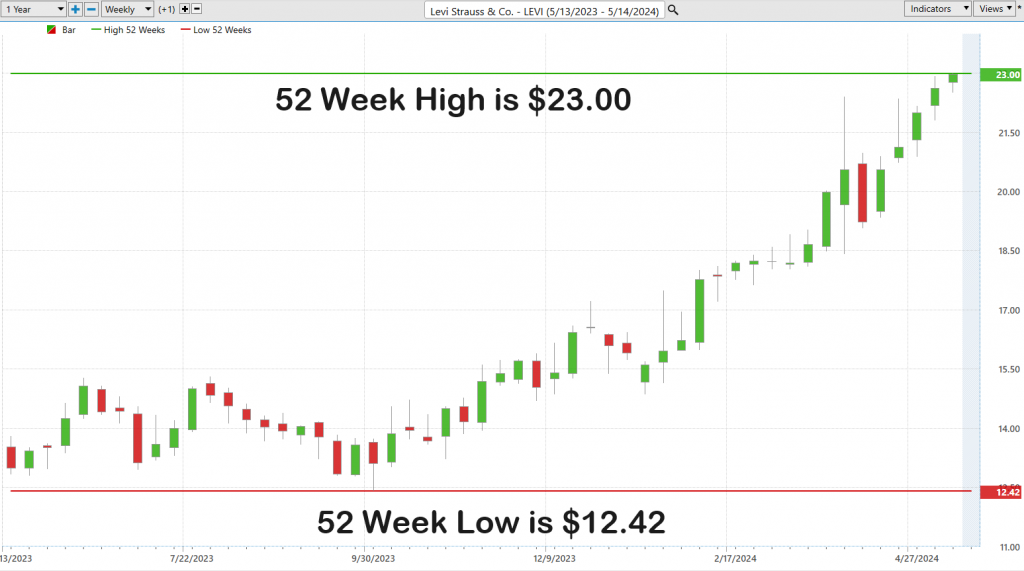
Consider Levi Strauss & Co. ($LEVI), which has demonstrated significant market activity: over the last 52 weeks, it has peaked at $23.00 and bottomed out at $12.42. This range—$10.58—reflects a 46% variance relative to its current price, indicating a robust level of volatility and investor interest.
Moreover, currently trading at its 99th percentile over the same period, $LEVI showcases not just resilience but perhaps an underappreciated potential within the market’s dynamics, pointing towards strategic considerations for traders and investors alike. This high percentile ranking suggests that Levi’s stock is performing exceptionally well compared to its previous year’s valuation, making it a noteworthy topic for further analysis and discussion.
The 52-week high and low markers are more than mere numbers—they are vital indicators of a stock’s health and investor sentiment. These metrics act as psychological benchmarks within the trading community, much like a thermometer measures temperature. When a stock reaches its 52-week high, it typically signals robust demand and investor confidence, suggesting potential for further gains. This momentum often attracts investors searching for strong market performers.
Conversely, a stock hitting a new 52-week low might raise red flags, indicating possible underlying issues and often precipitating a sell-off as market participants reassess its value. These highs and lows, steeped in decades of market history, are crucial for technical analysis, offering insights into market dynamics and the psychological forces that drive trading decisions.
These indicators are invaluable for both seasoned traders and novices. Observing these fluctuations provides a practical lesson in market trends and the impact of external events like economic shifts or news releases on stock prices. They narrate the ongoing story of market sentiment, revealing the collective mindset of the investment community.
This perspective is essential for anyone engaged in the market, whether for quick trades based on short-term movements or long-term strategic investments. The knowledge gleaned from these indicators is rooted in generations of market observation, reflecting both the enduring nature and the adaptive intellect of the financial markets.
Here is the 52-week chart which isolates the journey $LEVI has had over the past year.
To truly understand the long-term trajectory of any stock, such as Levi Strauss & Co. ($LEVI), one must adopt a panoramic view, extending the analysis beyond the short-term window to encapsulate a broader, longer-term trend. This method offers a more comprehensive understanding of the stock’s performance, situating recent movements within a longer timeline, thereby providing not just data, but deep insights into the underlying trends that influence the market’s daily fluctuations.
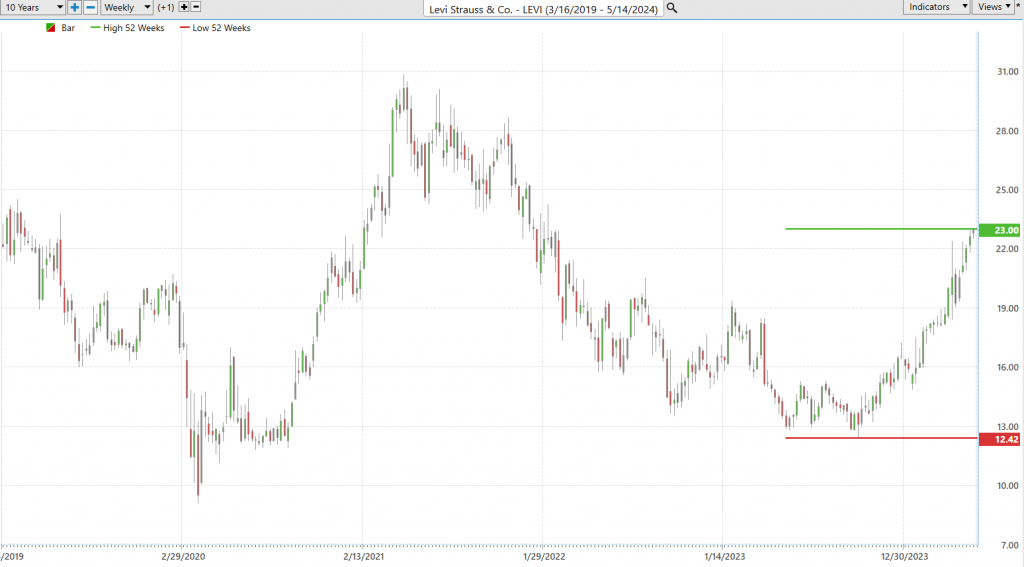
By doing so, one observes a pattern of broad consolidation over the years, punctuated by recent, explosive upward movements. Such contrasting patterns underscore the complexity of market dynamics, making it essential for traders and investors to delve deeper into these trends. This extended view is critical to accurately assess the risks and potential rewards associated with investing in $LEVI, guiding more informed, strategic decision-making in portfolio management. This kind of in-depth analysis is indispensable for anyone serious about understanding the forces that shape market trends over the long haul.
Best Case – Worst Case Scenario
In the realm of trading, achieving a nuanced understanding of risk and opportunity is pivotal. This is particularly true when considering that volatility in the market acts as a double-edged sword—it can both create and erode wealth with equal swiftness. Thus, a conservative approach to trading emphasizes the need to constantly weigh real risk against real opportunity.
To systematically engage in this kind of analysis, traders must develop an objective understanding of what can be termed “financial weather patterns.” This involves closely examining a stock’s historical performance, specifically looking at how the stock has fared during periods of market rallies compared to its behavior during downturns. By reviewing the past year’s trading data to compare the magnitudes of both rallies and declines, traders can gain a practical sense of the stock’s typical price actions and inherent volatility.
This method, which could be dubbed the “Feast or Famine” analysis, serves not just as an analytical tool but as a strategic framework for setting realistic expectations about a stock’s future performance. It equips traders with the ability to discern between what might merely be a passing storm and what could turn out to be prolonged unfavorable weather, financially speaking.
Such analysis provides traders with a clear-eyed view of potential returns juxtaposed against potential pitfalls. By understanding the best and worst historical performances of the market, traders can equip themselves with crucial insights into the stock’s prospective risks and rewards. This kind of informed understanding is essential, allowing traders to navigate the market’s ups and downs with increased confidence and control, preparing them for both optimal outcomes and the worst scenarios.
Ultimately, this conservative approach clears the fog of uncertainty that often clouds investment decisions, fostering a more disciplined and principled trading strategy that respects both the potential and perils inherent in market volatility.
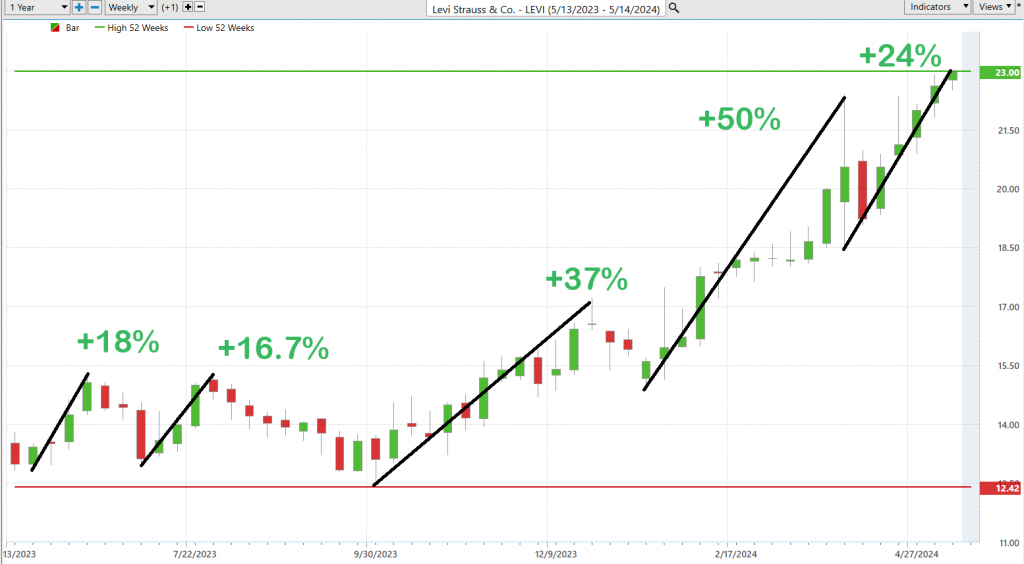
– **In the Best-Case Scenario**: In this analysis, you’re identifying the most significant short-term rallies over the past year. This process provides insights into the peak performance levels and the trading psychology that was prevalent during those times. It’s about maintaining an awareness and establishing realistic expectations based on what has historically occurred in the market.
– **In the Worst-Case Scenario**: Reverse the analysis to focus on the most significant downturns. This method equips you with an understanding of potential risks, preparing you for the possibilities in a worst-case scenario.
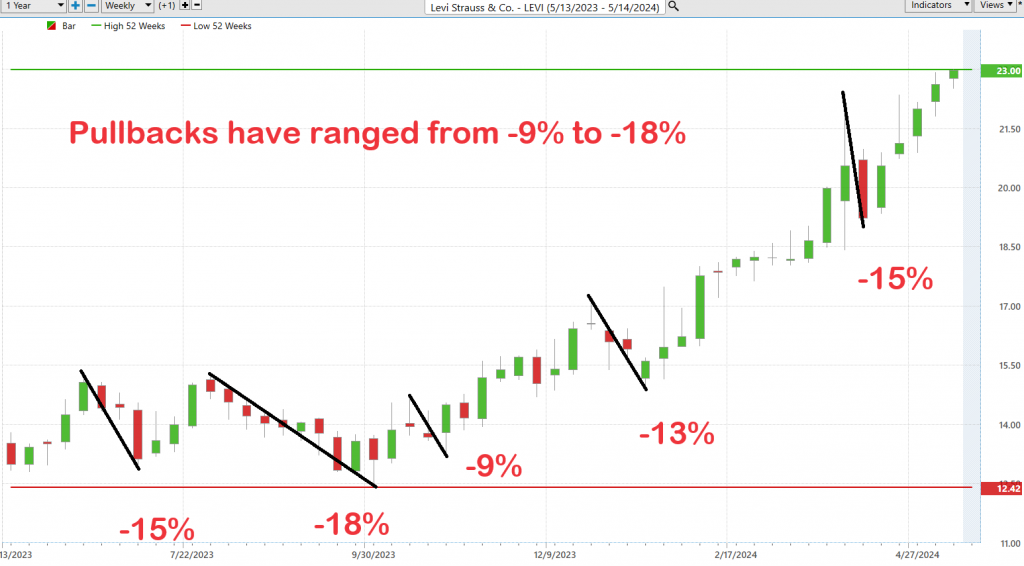
Before you commit your hard-earned money to the markets, it’s crucial to conduct a thorough analysis—consider this your financial flashlight, illuminating the path ahead and bracing you for potential uncertainties. This approach extends beyond just smart investing; it’s about crafting a strategy that aligns with your financial goals and risk tolerance. By diving deep into the data, we see the risk-reward landscape for $LEVI over the past year, noting that the stock has seen declines ranging from 9% to 18%, alongside rallies of 16% to 50%. This detailed understanding equips you to make well-informed, personalized trading decisions, preparing you to navigate the inherent volatility in $LEVI’s market performance effectively.
Moving forward, a comparative analysis of $LEVI against broader market indices is crucial. This comparison not only highlights where $LEVI has outperformed or underperformed in relation to the broader market.
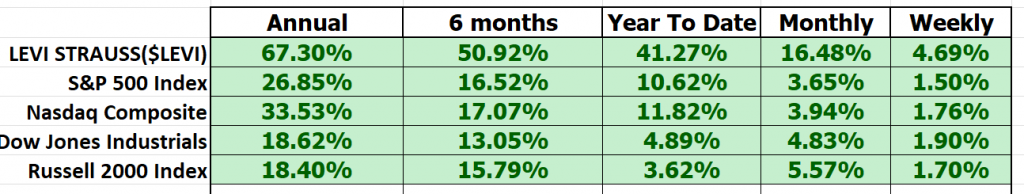
We can see that $LEVI has massively outperformed the broader stock market indexes.
A critical component of this analysis involves assessing $LEVI’s volatility relative to the broader market, through the lens of the beta coefficient. Beta is a measure of a stock’s volatility in relation to the overall market; a beta of 1 suggests that the stock moves in concert with the market, a beta above 1 indicates higher volatility, and a beta below 1 denotes lower volatility. Levi Strauss ($LEVI) has a beta of 1.19, indicating that the stock is more volatile than the market average. This means that the stock’s price movements are 19% more pronounced in comparison to the overall market movements.
These simple practical steps now lead us into the Artificial Intelligence analysis.
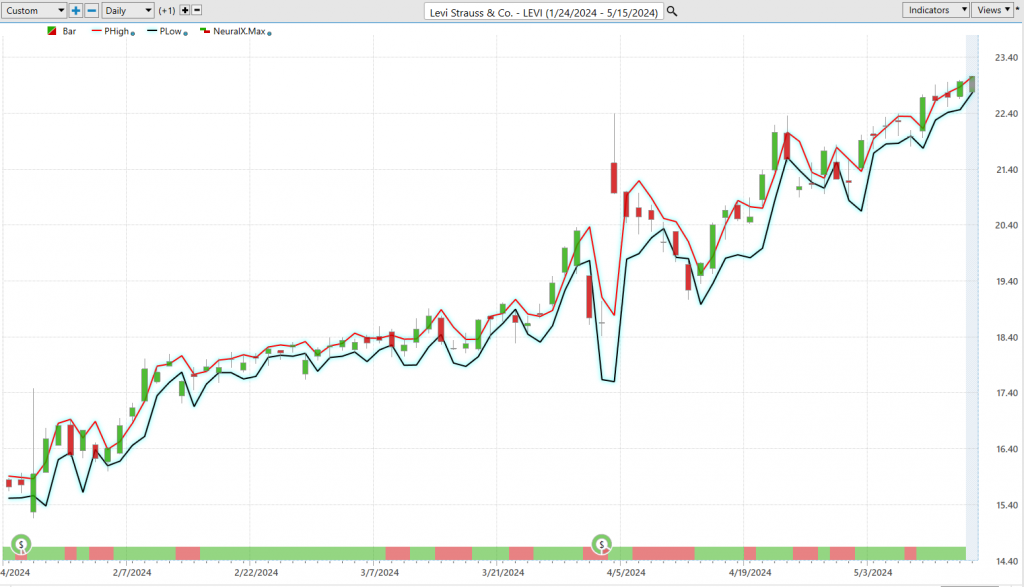
WT Finance Institute A.I. Predictive Blue Line
WT Finance Institute A.I. Predictive Blue Line Analysis
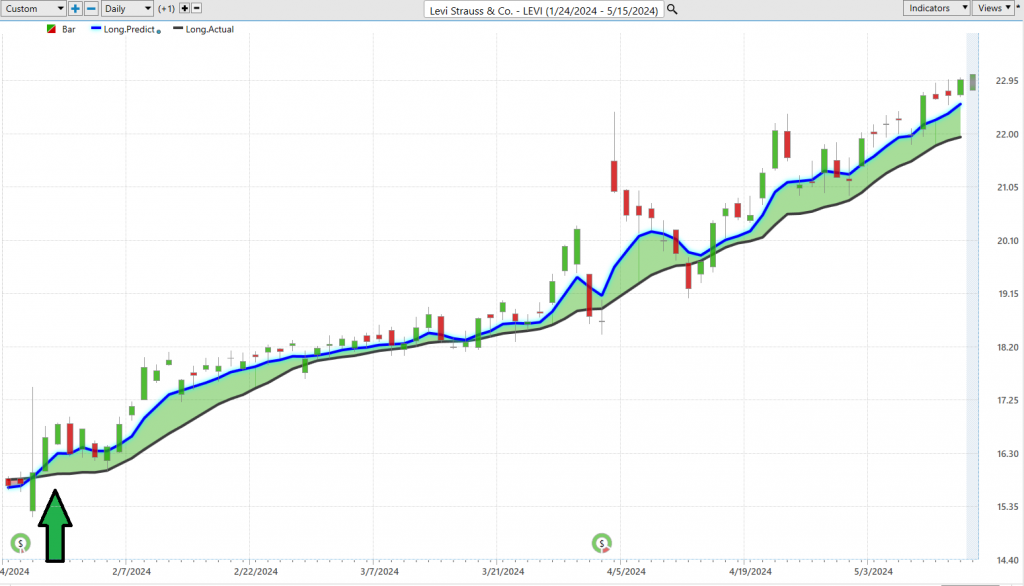
Our analytical methodology for assessing Levi Strauss ($LEVI) hinges on a pioneering feature known as the predictive blue line, integral to our charting approach:
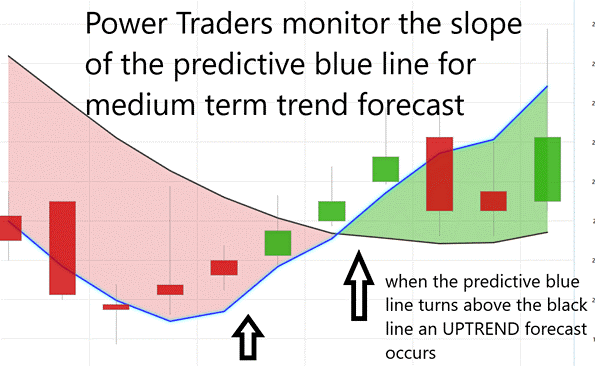
The trajectory of the predictive blue line is pivotal in forecasting $LEVI’s market direction. An ascending slope of this line suggests a bullish trend, signaling an increase in stock prices, whereas a descending slope points to potential declines.
This predictive blue line delineates a ‘Value Zone’, which is critical for traders. In an uptrend, the zone below this line represents a prime buying opportunity, while in a downtrend, prices above this line may indicate a sell signal.
A downward trend in the predictive blue line can prompt traders to adopt a cautious stance, either by moving to the sidelines awaiting improved conditions or hedging their positions in anticipation of further price drops.
The introduction of artificial intelligence in trading tools like those used in WT Finance Institute Software has revolutionized how market participants engage with assets like $LEVI. The predictive blue line is not merely an analytical tool; it is a beacon guiding traders through the murky waters of the financial markets, offering foresight into forthcoming trends.
Utilizing A.I., WT Finance Institute Software transcends traditional analysis with its ability to not only analyze but also predict market movements before they occur. The software’s A.I.-driven approach is adept at unveiling complex intermarket relationships and predicting shifts, providing traders a distinct tactical advantage in a volatile trading environment.
By integrating these advanced A.I. tools, traders are equipped with a comprehensive suite of indicators that enhance decision-making, identify trading opportunities, and mitigate risks. The effectiveness of the predictive blue line in navigating $LEVI’s trends is profound. However, prudent trading dictates that these signals be corroborated by additional A.I. tools to confirm movements, ensuring a holistic and strategic approach to market entry and exit.
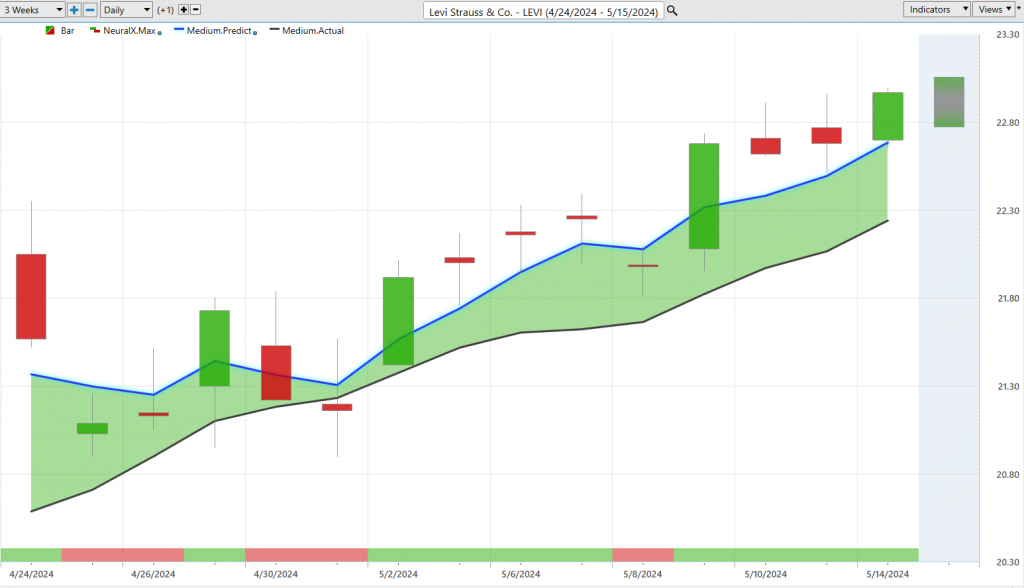
Neural Network Indicator (Machine Learning)
Neural networks in trading are sophisticated computational models that mimic the human brain’s architecture and functionality. These networks are comprised of layers of interconnected nodes, or “neurons,” which process data in a manner akin to neural activity in our brains. In the realm of trading, neural networks are particularly adept at recognizing patterns, enabling them to discern complex, nonlinear relationships within market data that might elude human traders or traditional statistical approaches. This ability is invaluable in the fast-paced, ever-changing financial markets, where these models continuously evolve and improve by learning from new data.
The impact of neural networks on trading is revolutionary. They equip traders with an advanced tool capable of anticipating market trends, thereby enhancing decision-making, optimizing risk management, and potentially boosting returns. Neural networks sift through extensive datasets to detect patterns and correlations that are not apparent to even the most seasoned traders, effectively providing a foresight into market movements. This predictive capability allows traders to swiftly identify profitable opportunities and nascent trends, offering a substantial edge in executing timely and well-informed trading decisions.
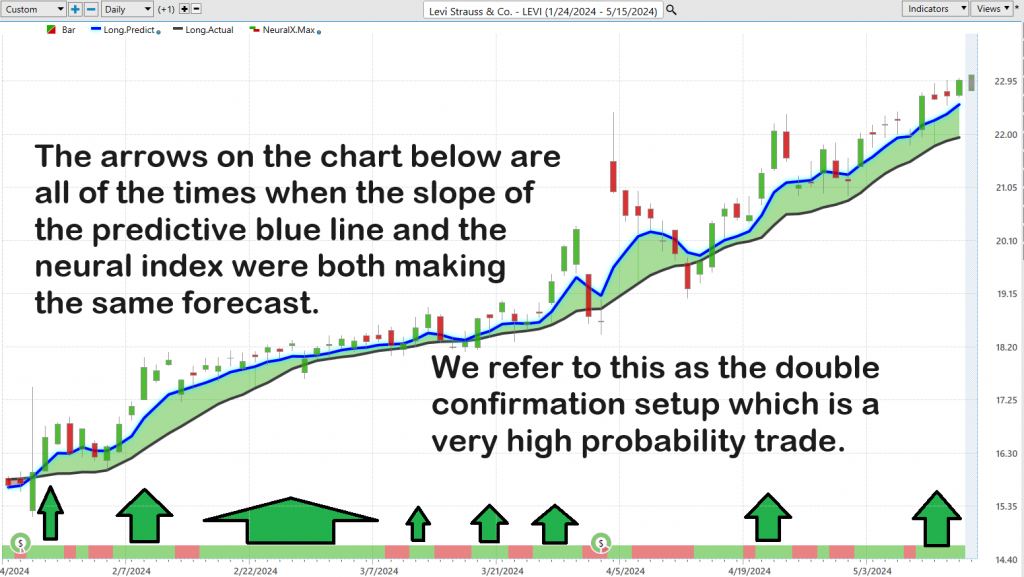
For example, in trading software platforms like WT Finance Institute, the neural network indicator acts as a strategic asset. It is visually represented on charts, often illuminated in green to signal favorable market conditions or red to indicate potential downturns. When these neural networks are combined with traditional charting tools like the Predictive Blue Line, they create a potent synergy. This integration enhances the tool’s effectiveness by providing “double confirmation” signals, which confirm trends through a dual-layered analytical approach. This method not only directs traders toward potentially lucrative trades but also aids in navigating the complexities of the market with greater precision and foresight.
This technological advancement elevates trading strategies to new heights, making it an essential element for traders who wish to capitalize on cutting-edge technology to amplify their influence in the market.
WT Finance Institute A.I. Daily Range Forecast
Navigating the optimal moments to enter and exit the market remains a formidable challenge for traders, exacerbated by the often-deceptive nature of market volatility. For traders focusing on stocks like Levi Strauss ($LEVI), success hinges on a deep understanding of the fluctuations in daily, weekly, and monthly trading ranges, and crucially, on the effective application of this knowledge in real-world trading scenarios.
However, mastering the market demands more than just access to data—it requires the conversion of this data into actionable strategies. This critical transformation is increasingly facilitated by cutting-edge technologies such as artificial intelligence (AI), machine learning, and neural networks. These tools serve as essential guides through the turbulent financial markets, providing traders with clear insights into market trends and delivering precise forecasts of trading ranges, thereby substantially reducing the traditional guesswork involved in trading decisions.
Here is what the volatility on $LEVI looked like over the past year based on the daily weekly and monthly time frames.
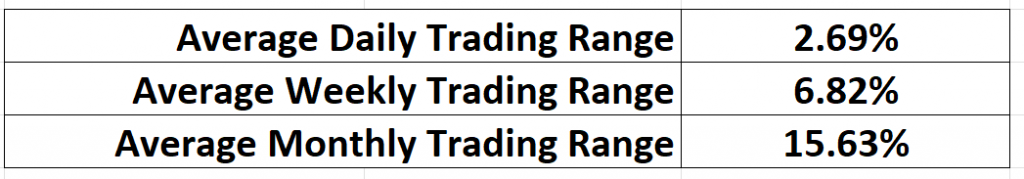
Amidst this backdrop of volatility, the WT Finance Institute A.I. Daily Range Forecast emerges as an invaluable resource for traders. With its precise precision and detailed analysis, this tool offers short-term swing traders a distinct advantage, allowing them to thrive. It provides in-depth insights into expected daily market movements and delineates market trends and anticipated trading ranges with clarity. This level of detail empowers traders to meticulously plan their market entry and exit strategies, enhancing their confidence.
By leveraging such sophisticated analytics, traders can transform complex market data into practical, actionable trading strategies. This opens opportunities for substantial growth within the unpredictable environment of financial markets. The precision offered by predictive analytics is crucial for traders looking to effectively capitalize on market dynamics, underscoring the importance of advanced technological tools in today’s trading landscape.
Let me tell you, the market is buzzing with volatility right now. But don’t worry, that’s where the WT Finance Institute A.I. Daily Range Forecast steps in, giving traders the edge they need. This isn’t just any tool; it’s a game-changer with its razor-sharp precision and deep analysis, specifically designed to help short-term swing traders really shine.
This tool doesn’t just scratch the surface; it dives deep, providing detailed insights into daily market movements and crystal-clear outlines of market trends and expected trading ranges. This kind of clarity is a game-changer—it empowers traders to map out their market entry and exit strategies with a whole new level of confidence. With such advanced analytics at their fingertips, traders can take complex market data and turn it into practical, actionable strategies. This is how you open the door to substantial growth in the wild world of financial markets.
The precision this tool offers in predictive analytics is just indispensable for traders aiming to effectively harness and capitalize on these market dynamics. It’s about making informed moves that are calibrated to the pulse of the market, and that’s how you turn volatility into opportunity.
WT Finance Institute A.I. Intermarket Analysis
Intermarket analysis is an approach used by traders to understand the interconnectedness between different financial markets such as stocks, bonds, commodities, and currencies. This method is crucial for comprehending how movements in one market can influence and are influenced by movements in others, revealing a complex network of relationships. Essentially, intermarket analysis helps illustrate the synchronized dance occurring within the global financial ecosystem, where different markets interact in a dynamic and sometimes predictable fashion.
For instance, consider the ripple effect of rising oil prices. This increase might lead to heightened inflation expectations, which could in turn affect interest rates and bond yields. These shifts might impact the stock market, particularly sectors that are sensitive to changes in oil prices or interest rates. Additionally, currency strength can affect commodity prices, which then influences stocks and sectors connected to these commodities.
Understanding these intricate relationships allows traders to predict underlying trends and shifts before they are apparent through traditional single-market analysis. By providing a broader perspective, intermarket analysis enhances decision-making, improves risk management, and uncovers trading opportunities that may be invisible when only focusing on one market.
Intermarket analysis is essential for traders who need to understand the intricate connections across various financial markets including stocks, bonds, commodities, and currencies. This analytical approach sheds light on how different markets influence each other, illustrating a complex yet elegant economic dance.
By grasping these interconnected market relationships, traders can preempt underlying trends and shifts that may not be immediately obvious through traditional market analysis. This comprehensive view can significantly enhance decision-making, bolster risk management, and reveal trading opportunities that might otherwise remain hidden when analyzing markets in isolation.
The practice of intermarket analysis gained prominence through the works of John J. Murphy and was later enhanced by Lou Mendelsohn with the development of WT Finance Institute Software, which employs AI to capitalize on the power of intermarket analysis. This enables traders to better navigate the complex web of interconnected financial markets.
By integrating intermarket analysis into their strategies, traders can obtain a holistic understanding of the financial landscape, moving beyond narrow market perspectives to embrace the broader, dynamic interactions at play globally. This approach not only deepens their comprehension of market relationships but also equips them to make more strategic, informed decisions, navigating with greater foresight and precision in the financial markets.
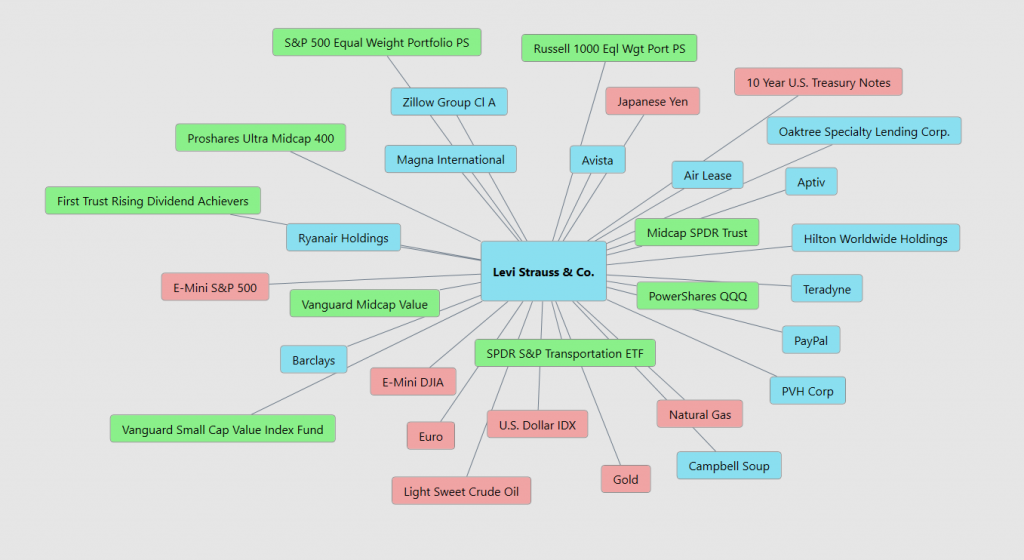
Here are the 31 key drivers of $LEVI’s price:
Our Suggestion
The next earnings call for Levi Strauss & Co (LEVI) is scheduled for July 6, 2024 . This call will cover the company’s financial results for the second quarter of the year.
In a clear nod to forthcoming financial health, a company has outlined its future earnings and revenue expectations, serving as a pivotal communication instrument to anchor investor and analyst expectations.
For the fiscal year, the firm reiterated its revenue outlook, projecting a modest growth of 1% to 3%. Additionally, it upgraded its adjusted EPS forecast, nudging the range from $1.15-$1.25 to a slightly higher bracket of $1.17-$1.27.
Despite broader market challenges that have seen the apparel sector flounder, the company’s upward revision in guidance has sparked optimism, underpinning a belief in its robust turnaround strategy. The stock has surged an impressive 83% from its September bottom, signaling robust investor confidence.
However, with such sharp gains, traders might consider moderating their future expectations. The stock’s heightened volatility signals not just risk, but opportunity—making $LEVI a stock to watch closely in the trading community.
The variance between the most bullish and most bearish Wall Street Analyst is 31%. That means that the top minds who monitor the stock full time think that is the expected level of volatility for the coming year. That level of volatility spells huge opportunity for seasoned traders. Monitor $LEVI closely.
There is plenty of meat on the bone for short-term traders to capitalize on this asset in UP and down markets. We advise you put LEVI on your trading radar and follow the predictive blue line A.I. forecast for guidance.
Practice good money management on all your trades.
Let’s Be Careful Out There!
Remember, It’s Not Magic.
It’s Machine Learning.
Disclaimer: THERE IS A HIGH DEGREE OF RISK INVOLVED IN TRADING. IT IS NOT PRUDENT OR ADVISABLE TO MAKE TRADING DECISIONS THAT ARE BEYOND YOUR FINANCIAL MEANS OR INVOLVE TRADING CAPITAL THAT YOU ARE NOT WILLING AND CAPABLE OF LOSING.
WT Finance Institute’S MARKETING CAMPAIGNS, OF ANY KIND, DO NOT CONSTITUTE TRADING ADVICE OR AN ENDORSEMENT OR RECOMMENDATION BY AI Wealth Creation 4.0 OR ANY ASSOCIATED AFFILIATES OF ANY TRADING METHODS, PROGRAMS, SYSTEMS OR ROUTINES. WT Finance Institute’S PERSONNEL ARE NOT LICENSED BROKERS OR ADVISORS AND DO NOT OFFER TRADING ADVICE.