| This week’s stock analysis is TESLA ($TSLA) |
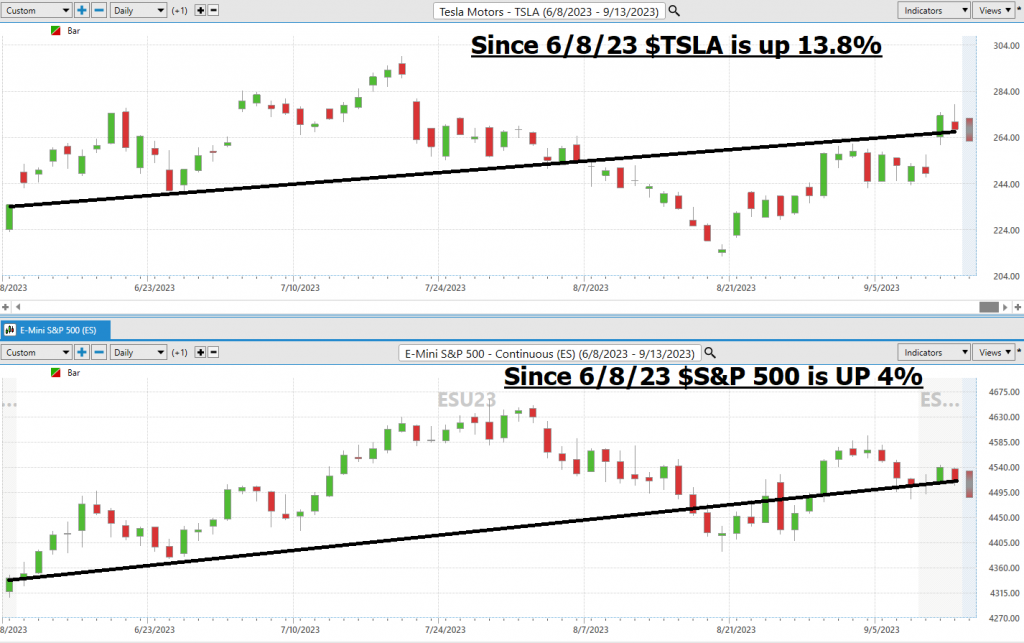
We did a stock analysis on Tesla ($TSLA) on June 8, 2023. In the past 3 months $TSLA shares are up 13.8% while the S&P 500 is up only 4%. This is not a trivial detail. As goes TESLA ($TSLA), so goes the broader market.
In this stock study we will review $TSLA again for an updated perspective.
Tesla has been nothing short of a transformative force in the automotive industry, sparking innovation in sustainable transportation. Let’s talk about Tesla’s rise to stardom. It’s tightly woven with their unwavering commitment to electric vehicles. Back in the day, electric cars were seen as mere novelties, with limited range and lackluster performance. Enter Tesla’s Roadster, their first electric marvel. It not only had a zippy acceleration but also a range exceeding 200 miles, rewriting the rules for EVs.
But what truly sets Tesla apart? It’s their relentless focus on battery technology. Gigafactories, massive battery production facilities, have been pivotal in slashing battery costs. This pursuit of efficient batteries led to the groundbreaking Model 3, a game-changer in the EV world due to its affordability.
And that’s not all. Tesla isn’t just about cars; they’re a leader in energy storage solutions. Products like the Powerwall, Powerpack, and Megapack cater to homes, businesses, and utilities. These innovations allow users to harness renewable energy and store it for when it’s needed most, ensuring a constant power supply. Tesla’s prowess in energy storage has catapulted them into a dominant position in the renewable energy sector.
Now, Tesla’s knack for innovation and disruption has been at the heart of its success. Their direct-to-consumer sales model challenged the traditional dealership system, and their over-the-air software updates revolutionized how cars get upgraded. Tesla’s impact goes well beyond just the auto industry, prodding competitors to hasten their own EV efforts.
But let’s not forget the man behind it all – Elon Musk, Tesla’s co-founder, and CEO. He’s the face of the brand, known for his vision, determination, and sheer ambition. Musk isn’t afraid to take risks, invest heavily in research and development, and push the limits of technology. His leadership has been instrumental in Tesla’s journey to its current status.
Tesla’s journey from a scrappy startup to a global powerhouse in electric vehicles and sustainable energy is nothing short of remarkable. While many are familiar with their electric cars and charismatic CEO, their contributions to battery technology, energy storage, solar energy, and autonomous driving are equally impressive. Their inclusion in major stock indices underscores their growing impact on the financial world, making Tesla a symbol of the transition to a sustainable future and a trailblazer in multiple industries. As Tesla continues to evolve and confront new challenges, its story remains one of the most captivating and transformative in modern business history.
Now, let’s shift gears and talk about the here and now. Forget the endless debate about Tesla advertising – that’s not what really matters. It’s not about whether Tesla’s stock is in the green or red today or tomorrow; it’s about what Tesla is up to in the EV, energy, and A.I. sectors. So, what’s the deal?
Well, the short answer is that Tesla is doing what it needs to do, albeit with a few bumps along the road. Now, if you’ve been keeping an eye on Elon Musk for a while, you’ll know that he sometimes overpromises and underdelivers, or he delivers a tad late. If that’s a sticking point for you, maybe it’s time to explore other investment avenues.
At the beginning of the year Analysts proclaimed that Tesla was in trouble because they were slashing prices on their cars. While prices were reduced to move inventory, the price slashing is now being understood as visionary because the price reduction was in the face of a rising interest rate market which made it harder for vehicles to sell. Adjusting prices in response to the Model 3 revamp was a smart move – it generated a lot of buzz, potentially boosting Model X sales.
Tesla’s pricing makes the competition look like amateurs. But buying a car today isn’t as straightforward as it once was, especially with interest rates hovering above 5%. Car loans aren’t a cakewalk either. So, Tesla made some strategic price cuts to get those wheels turning, even if it meant slimmer profit margins.
So, here’s the deal: Tesla, to keep demand alive amid rising interest rates, has slashed prices on some of its most popular vehicles. These price reductions, ranging from 15% to 18%, have made their mark on Tesla’s bottom line as margins appear to narrow. Now, I get it – seeing those gross profit margins dip from their Q1 2022 peak to around 18% in Tesla’s recent Q2 earnings report can raise some eyebrows. Investors are understandably concerned, but maybe, just maybe, this concern is slightly misplaced. You see, Tesla’s decision to lower prices is all part of a more extensive strategy, and it could make this company a valuable long-term bet for investors.
Let’s look at the bigger picture. In 2017, electric vehicles (EVs) made up just 1% of new car sales. Fast forward to 2022, and that number has surged to 13%. The demand for EVs is on the rise, and that’s bringing more competition into the picture. Tesla, once a lone wolf, is now dealing with a pack of new startups and legacy automakers trying to jump on the EV bandwagon.
But let’s not kid ourselves – making a profit in the auto industry is no walk in the park. Turning a profit from EVs? Even trickier. Tesla’s price cuts are putting the squeeze on other manufacturers, especially when they’re operating on thinner margins.
Moreover, don’t forget that Tesla’s sitting on more than $23 billion in cash and equivalents with practically zero burdensome debt. These price cuts are likely to put more pressure on its competitors than on Tesla itself. But there’s more to this story. Tesla is no ordinary automaker. They’ve recently set new records in production and deliveries, and even as margins have dipped, they’ve notched a new revenue record of nearly $25 billion. The magic happens when you connect the dots between record production, deliveries, revenue, and price cuts. This is where Tesla’s grand vision comes into play. By getting more of their vehicles on the road, Tesla gets closer to achieving fully autonomous driving. And let me tell you, that’s a game-changer.
With the recent release of its v12 Full Self-Driving (FSD) software, Tesla claims they’ve built the infrastructure to train A.I. to learn how to drive through neural nets. It’s a big leap from the previous method, which required programmers to preconfigure code for various driving situations. With A.I., vehicles learn how to drive by analyzing video, reducing the need for manual programming. There’s still work to be done to account for the randomness that occurs on the road. But here’s the catch – price cuts aren’t just a financial strategy; they’re part of Tesla’s roadmap to reaching Level 4 or even Level 5 autonomy. At those stages, drivers no longer need to keep an eye on the road. If these price cuts indeed stimulate demand, Tesla can train AI models more efficiently with data from new cars hitting the streets.
And here’s the grand finale: Tesla’s ultimate goal is to create a robo-taxi business that could redefine its income and profitability . Elon Musk, the CEO, believes there’s “quasi-infinite demand” for such a product, and analysts tend to agree. A recent simulation by Ark Invest even suggested that a robo-taxi fleet could catapult Tesla’s revenue by a staggering 700% by 2027 and make up nearly half of its future total revenue.
Now, amid these less-than-ideal economic conditions affecting Tesla’s operations, one thing remains clear – the company’s strategic vision for long-term dominance is unwavering. While Wall Street may be preoccupied with short-term concerns about narrowing margins, this could be an opportune moment to consider Tesla shares at a discount relative to its long-term potential.
Tesla’s financial strength and resilience position it well to weather economic turbulence – a luxury that almost none of its competitors can afford. Add to that the prospects of imminent autonomous driving and a potentially lucrative robo-taxi business, and you’ve got a company that could very well lead portfolios for years to come.
Now, let’s talk about advertising. What’s the deal with ads? Well, they’re meant to boost brand recognition, drive sales, educate consumers, and more. Tesla’s has roughly 200 ads running, and let me tell you, they’re far from conventional. A Super Bowl ad? Rumors are that Tesla is considering it as part of their marketing mix, as long as it serves its primary objectives. But here’s the kicker – ads can’t do much about interest rates, which are a significant hurdle to demand. While educating folks about electric vehicles is essential, remember, Tesla isn’t the only player in town. The competition is advertising too, but are their cars flying off the shelves? Not quite. So, advertising is just one piece of the puzzle, not the entire game.
In a nutshell, Tesla’s on a solid path, maneuvering the challenges of being an $800 billion behemoth.
Oh, and here’s a curveball for you: Tesla’s making a comeback at the Detroit Auto Show after an eight-year hiatus. If they roll in with the new Model 3 and Cybertruck, mark my words, those cars will do all the talking.
And over in China, Gigafactory Shanghai just hit a milestone – 2 million in production . But there’s a slight dip in weekly insured numbers – something we’ve seen before.
Speaking of charging, Tesla’s planning to install stations at 2,000 Hilton hotels in North America. A win-win for both.
And hey, with all these price cuts, the Tesla Model X now qualifies for the full $7,500 EV tax credit.
The bottom line is that TESLA is making BIG things happen. Earnings are forecasted to grow by 22.1% a year. Over the past year, earnings have grown 28.6%.
In this weekly stock study, we will look at and analyze the following indicators and metrics as are our guidelines which dictate our behavior in deciding whether to buy, sell, or stand aside on a particular stock.
- Wall Street Analysts’ Estimates
- 52-week high and low boundaries
- Best Case – Worst Case Analysis and Takeaways
- WT Finance Institute A.I. Forecast (Predictive Blue Line)
- Neural Network Forecast
- Daily Range Forecast
- Intermarket Analysis
- Our trading suggestion
We don’t base our trading decisions on things like earnings or fundamental cash flow valuations. However, we do look at them to better understand the financial landscape that a company is operating under.
Wall Street Analysts’ Estimates
Based on 29 Wall Street analysts offering 12-month price targets for Tesla in the last 3 months. The average price target is $272.50 with a high forecast of $400.00 and a low forecast of $120.00 . The average price target represents a -0.39% change from the last price of $273.58.
Analysts and traders alike see $TSLA as a very polarizing stock.
Since we had reviewed TESLA 3 months ago, to provide perspective we think it is a good idea to compare Wall Street Analysts forecasts from June to those of today. They are summarized in the following graphic:
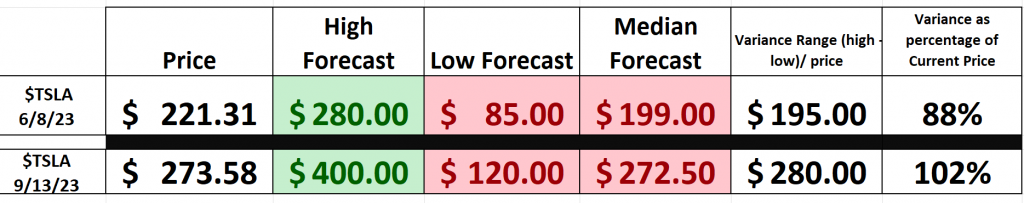
What we find fascinating is that analysts have upgraded and revised their price forecasts based upon Tesla’s recent rally. The variance of the forecasts has increased markedly, indicating the greater volatility is baked into the price action.
The high forecast has increased by $120.00.
We are trading right at the median forecast, which has increased $73.00.
Even the most bearish analyst has revised their bearishness upwards by $35.00.
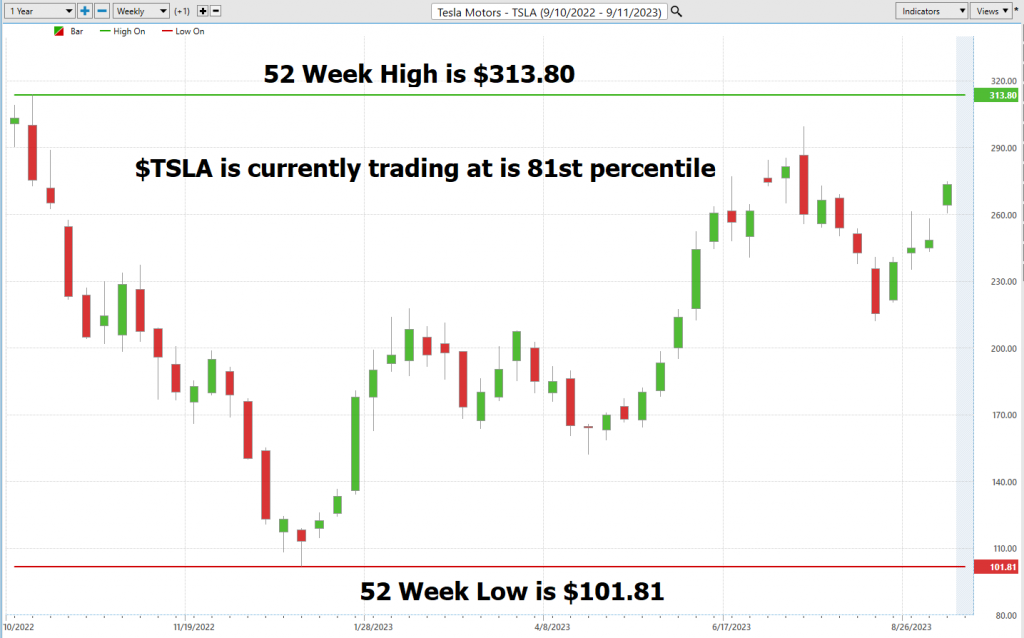
52-Week High and Low Boundaries
Looking at the Long-Term chart of $TSLA provides us with the 52-week high and low boundaries. Over the past year we have seen $TSLA trade as low as $101.81 and as high as $313.80. The annual trading range was $212.86. Currently, the stock is trading at the 81st percentile of its annual range.
Seasoned investors, often referred to as ‘Power Traders’, will juxtapose the Wall Street Analysts’ forecasts with these broad volatility estimates, aiming to gain a comprehensive understanding of the price dynamics surrounding $TSLA.
When we divide the annual trading range of $211.99 into the most recent price of $273.58 we determine that the statistical volatility is 77.5%. This number tells us that it would be considered normal for $TSLA to trade 77.5% higher and/or lower over the next 52 weeks.
Next, we zoom out and look at $TSLA on a 10-year monthly chart to get an idea of its longer terms trend and history. By doing so we can quickly see longer-term trends and volatility in this asset.
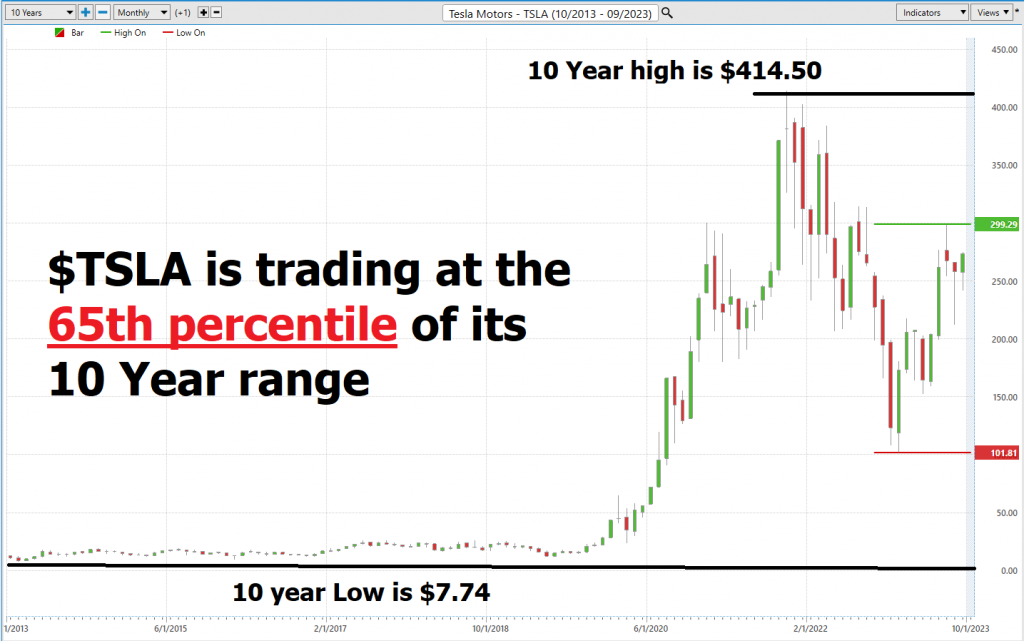
None of the Wall Street Analysts believe that $TSLA will go to new 10 Year highs in the next 12 months. We suspect that this will change should $TSLA continue moving higher and break through its recent 52-week high at $313.80.
Best Case – Worst Case Scenario
When we talk about assessing a trading opportunity, folks, it’s not just about crunching numbers. No, no, no. We need to get a real feel for what’s going on. You see, you can’t just look at the high points of those rallies and ignore the low points of those declines. That’s how you truly gauge an asset’s volatility in real-time. And let’s not stop there; we’ve got to compare it to the performance of the big boys in the market.
Now, I’m not talking about reducing everything to cold, hard numbers. No, we need a comprehensive approach here. It’s all about looking at the best-case scenario and the worst-case scenario. By digging into those charts, we can really grasp what this volatility means for potential gains or losses.
When it comes to trading, we’re chasing that movement. But remember, it’s a two-way street – risks and rewards. Start by checking out those rallies and declines. That tells us if an asset can hold onto its gains. Just to give you a taste, take Tesla, ticker symbol $TSLA, with an annualized volatility of 77.5%. Now, that’s what I call a wild ride!
It is worth doing this type of baseline analysis because it allows you to visually ascertain how quickly a stock drops in comparison to the speed with which it moves higher.
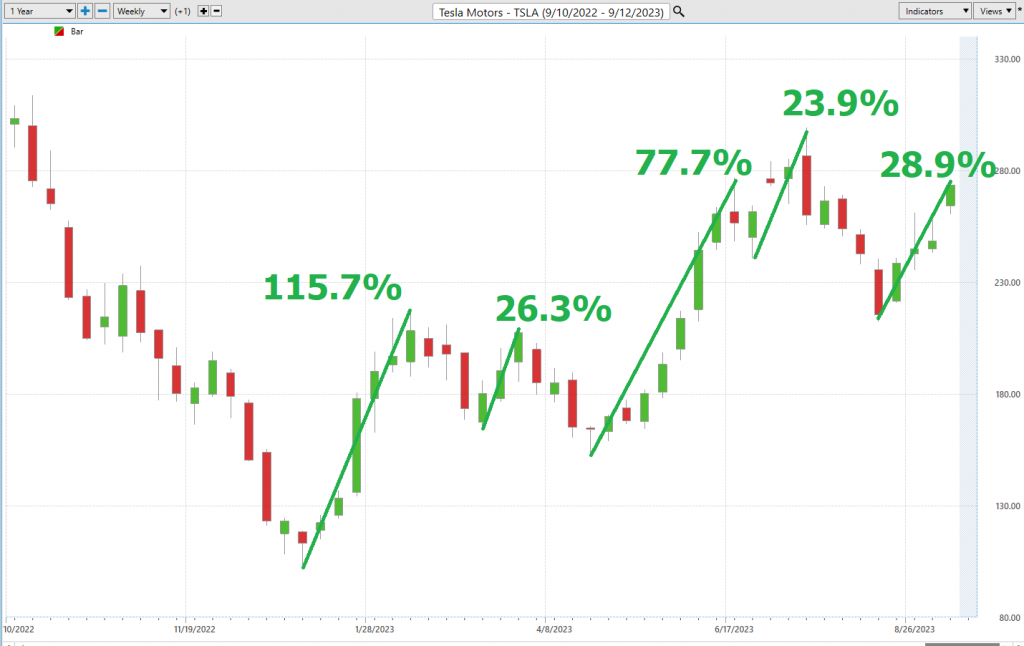
Here is the Best-Case Analysis:
Followed by the Worst-Case Analysis.
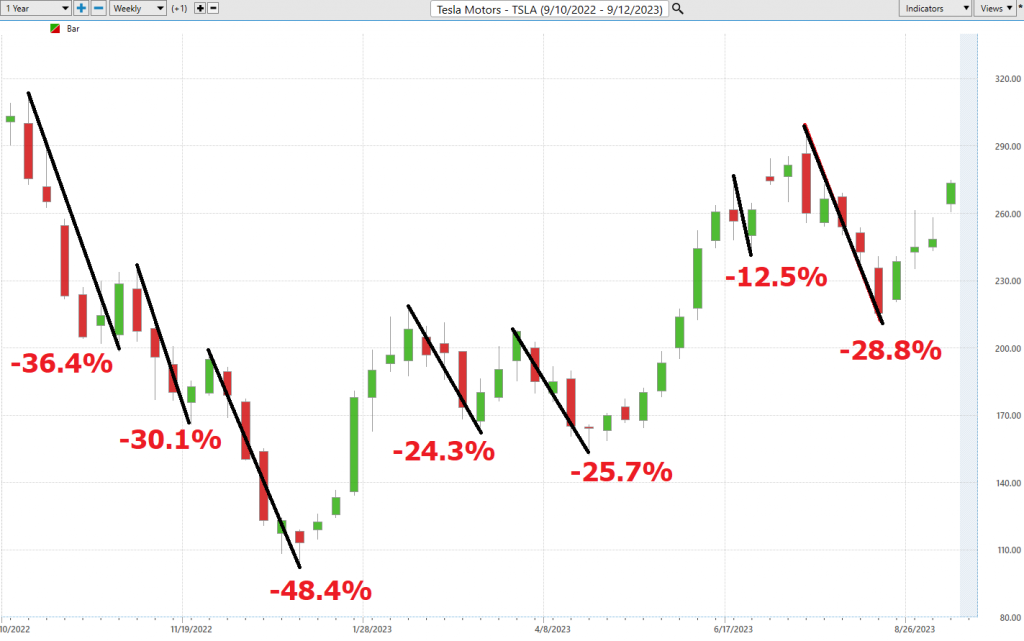
From this simple analysis, you can visualize and compare the rallies to the declines and see how quickly they occurred and whether the gains or losses were sustained.
Next, we want to compare the performance of $TSLA to the major broad market indexes.
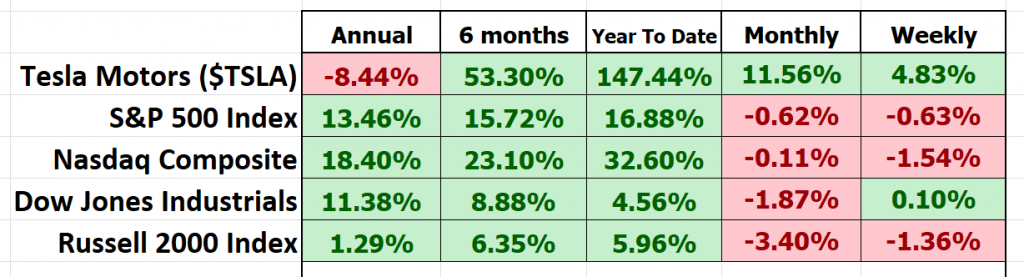
Now, let’s look at $TSLA and compare volatility and performance to how it stacks up against the big boys in the market. What we’re talking about here is something traders call BETA. You see, beta (β) is like the Richter scale of the stock world. It tells you how much a stock shakes and rattles compared to the broader market, usually a big index like the S&P 500. In simpler terms, beta shows us how sensitive a stock is to the market’s ups and downs.
Let me break it down for you:
– Beta = 1: This means the stock’s price moves along with the market. So, if the market goes up by 5%, a stock with a beta of 1 should also go up by 5%.
– Beta > 1**: This is when the stock is more like a rollercoaster. A beta of 1.5, for instance, tells you that the stock is 50% wilder than the market. If the market goes up 5%, this stock might jump 7.5% (or drop the same way).
– Beta < 1**: Now, this is where things get steady. A beta of 0.5 suggests the stock is half as crazy as the market. If the market rises 5%, this stock might only go up by 2.5%.
So, what’s the story with $TSLA? Well, its beta stands at 1.52, and we’re looking at data over a 5-year period. Remember, though, beta is all about the past, and what’s gone by isn’t always what’s coming next. High beta doesn’t mean guaranteed high returns, folks. It just tells us this stock’s got more ups and downs, which could mean more risk.
Investors use beta to gauge how risky a stock is compared to the overall market. It’s like a risk-o-meter to help them build portfolios that match their own appetite for risk and what they’re aiming to achieve in the market.
So, in $TSLA we have an asset that you can quickly see is much more volatile than the broader stock market indexes. As we have already mentioned huge volatility is baked in to $TSLA which spells either huge opportunity or risk.
WT Finance Institute A.I. Forecast (Predictive Blue Line)
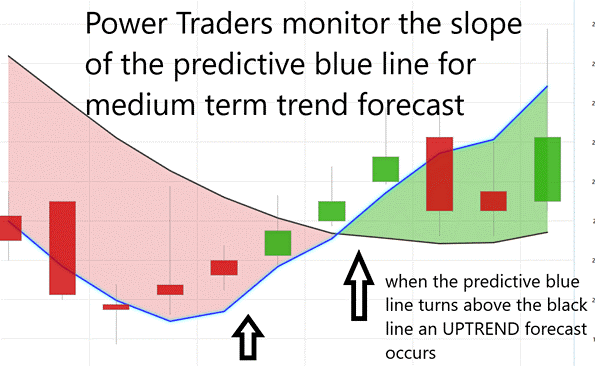
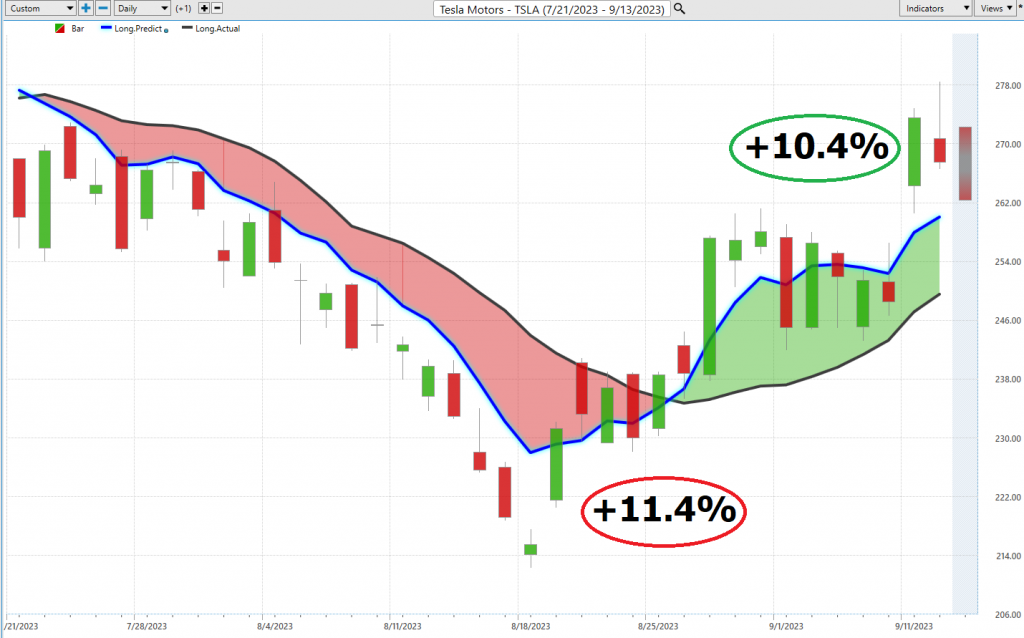
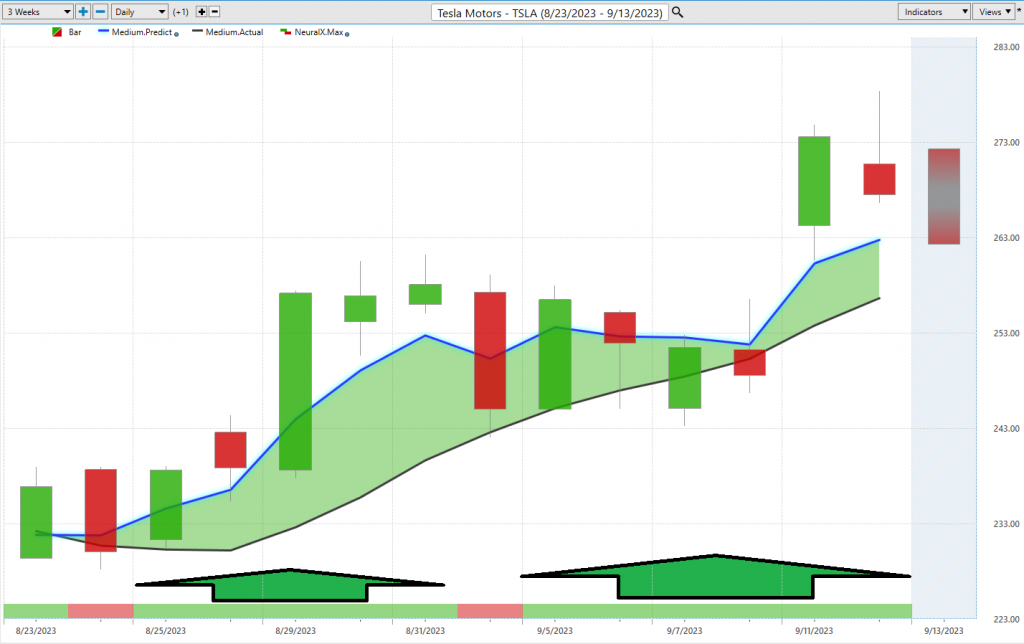
On the following chart you will see the power of the WT Finance Institute Predictive blue line which determines the medium term trend price forecast.
The guidelines we abide by are as follows:
- The slope of the predictive blue line determines the trend forecast and general direction of $TSLA.
- Ideally, the VALUE ZONE is determined to try and find buy opportunities at or below the predictive blue line, or to sell opportunities above the predictive blue line during a downtrend.
So, picture this: WT Finance Institute uses a clever tool called the predictive blue line, and it’s not some random hocus-pocus. This line, powered by WT Finance Institute’s patented Neural Network and Intermarket Analysis, is a product of sophisticated AI, machine learning, and statistical analysis. It considers all the important price drivers of an asset. In essence, it’s your North Star in the trading universe.
Now, here’s the golden rule, folks: Don’t mess with the trend. Whether you’re looking at trades that last a few days or stretch out for weeks, the name of the game is to stay in sync with the prevailing trend at the right moment. And that’s where our trusty predictive blue line comes in, guiding us on the path.
When you see two consecutive closes above that blue line, it’s a signal that an uptrend might be brewing. On the flip side, if you spot two consecutive closes below the blue line, you might be looking at a downtrend in the making. This is a grounded, logical approach to decode the mysteries of market trends and shape your investment strategies. It’s all about staying on the right side of the market’s currents.
Here is the most recent two months of $TSLA. You can see in the chart that there were two trend forecasts. One the short side, the down forecast was made on 7/25/23 at a price of 265.28 and generated 11.4% in gains. On the long side the UP forecast has generated 10.4% in gains so far.
Neural Network Indicator (Machine Learning)
Let’s talk about a powerful tool in the trading world, the Neural Network Indicator. This thing’s positioned right at the base of the chart, and it’s like having your own market weather forecast.
When that indicator goes green, it’s like a sunny day in the market, signaling strength. But when it turns red, well, it’s like a storm is brewing, and it’s telling you there might be some short-term market weakness ahead. And if it’s yellow, well, that’s like a market weather report saying, “Expect some sideways action.”
Now, let’s get into what makes this indicator tick. A Neural Network is like having an artificial brain in your trading toolbox. It crunches tons of data, processes it, and spits out insights. It’s always learning and improving itself, just like we should in trading.
These Neural Networks, powered by A.I., are like trading detectives. They dig into market data, from technical stuff to global events, and even company projections. And guess what? They’re quick. They can spot relationships between different market factors and outcomes faster than we humans can. For example, they might see a link between oil price shifts and unexpected stock index moves in a specific region. That kind of insight can give traders a leg up.
So, what’s the secret sauce? It’s all about confirmation, folks. Power Traders know it’s a smart move to check both the predictive blue line and the neural network indicator. When they’re both pointing in the same direction, that’s like a big green light for trading. And if they both go red, well, it’s time to think about hitting that sell button.
These Neural Networks are like trading’s next-gen supercomputers. They uncover hidden patterns and connections that old-school technical analysis can’t touch. So, Power Traders are always on the lookout for these high-probability forecasts based on historical info.
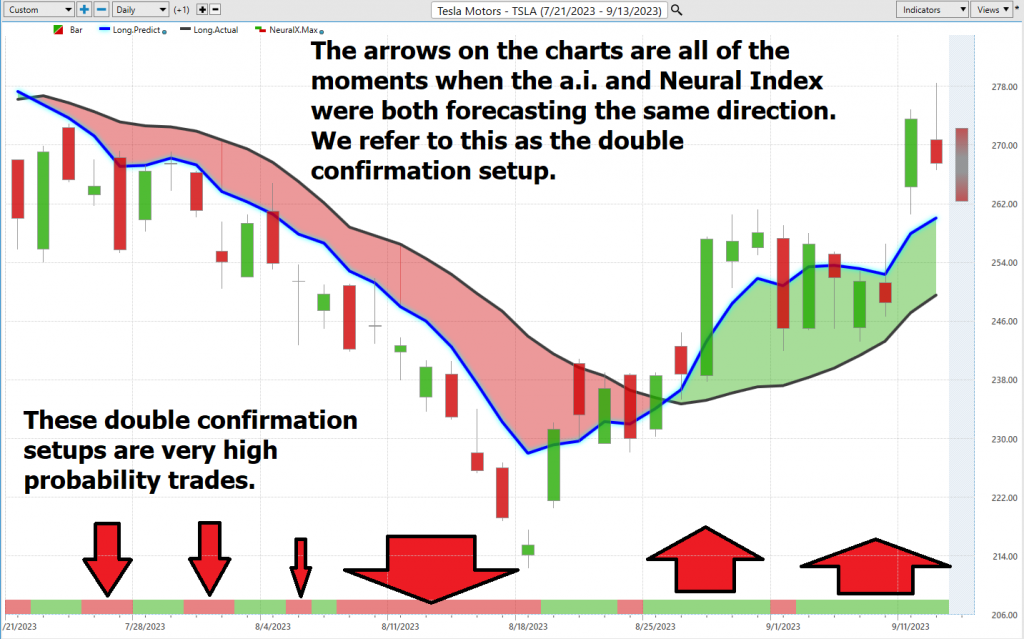
In a nutshell, when you’re a Power Trader, you’ve got your eye on both the Neural Network and the AI forecast. It’s like having a dynamic duo guiding your trading decisions. When they’re both green, that’s a buy signal. And when they’re both red, it’s a sell signal. So, remember, folks, double confirmation is the name of the game for Power Traders.
WT Finance Institute Software Daily Price Range Prediction
Let’s dive into a powerful tool in the trading world, something Power Traders rely on heavily – the Daily Price Range prediction forecast from WT Finance Institute Software. This tool helps Power Traders pinpoint their market entry and exit points like seasoned pros.
Traders face a daily battle, a real struggle, to figure out when to jump into the market and when to step back. It’s a decision that can keep you up at night. But here’s where WT Finance Institute’s A.I. comes in, making it a whole lot easier. It dishes out predicted high and low points, painting a clear picture of the opportunity and trend. No more guessing, folks.
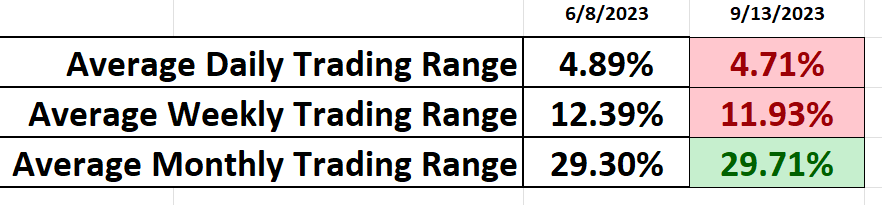
Here are the average trading range metrics for $TSLA over the past year for the daily, weekly, and monthly time frames. Comparing the June 8 th analysis to the present time you can see that for the most part volatility has remained high on $TSLA and consistent.
The KEY to successful trading is all about knowing the perfect moment to get in and out of the market. WT Finance Institute doesn’t just help you find that moment; it does it with remarkable precision. The Daily Range forecast is updated daily, giving you insights into where prices might be headed. Think of it like having a wise old mentor whispering market wisdom in your ear.
Now, check out that chart. It’s not just pretty lines; it’s a guide for placing your stops and managing risk. Notice how prices rarely break below the dark line? That tell you the ideal place to place buy stops is in that specific vicinity. It keeps the risk in check.
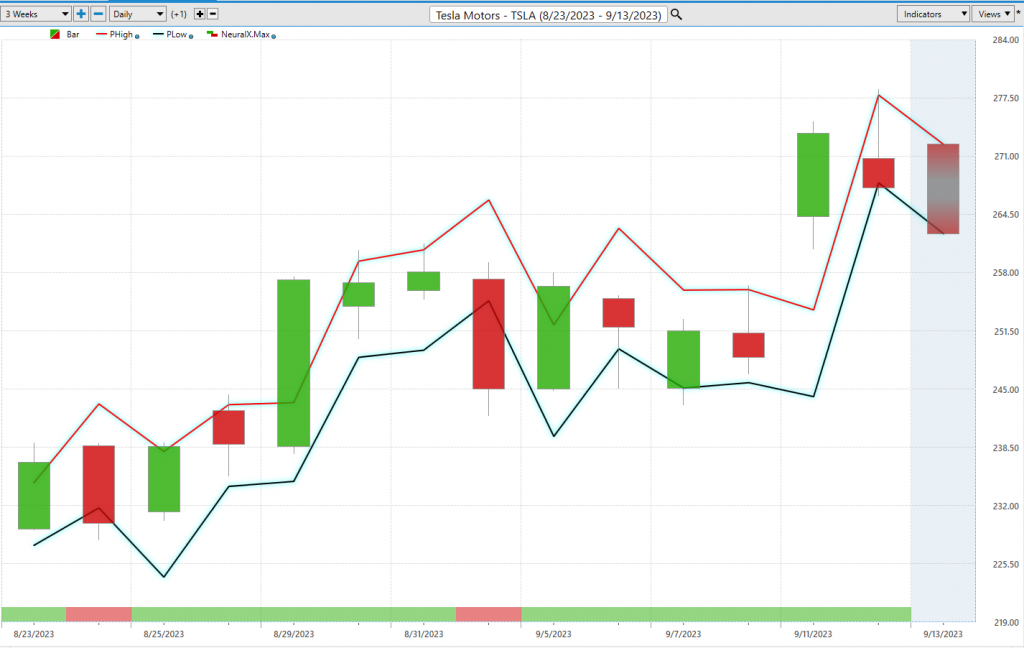
The upper and lower bands of that price range forecast create a clear channel of trading activity. Swing traders, those sharp folks, look for buying opportunities near the bottom of that channel and selling chances near the top. It’s a cautious approach, but it’s loaded with potential for success.
And here’s the kicker, folks. When Power Traders combine this daily range forecast with the double confirmation setup, it’s like having a precision instrument for spotting swing trading opportunities. Take a look at the chart, and you’ll see the daily range forecast in action, making those moves with surgical precision. That, my friends, is the power of WT Finance Institute.
Intermarket Analysis
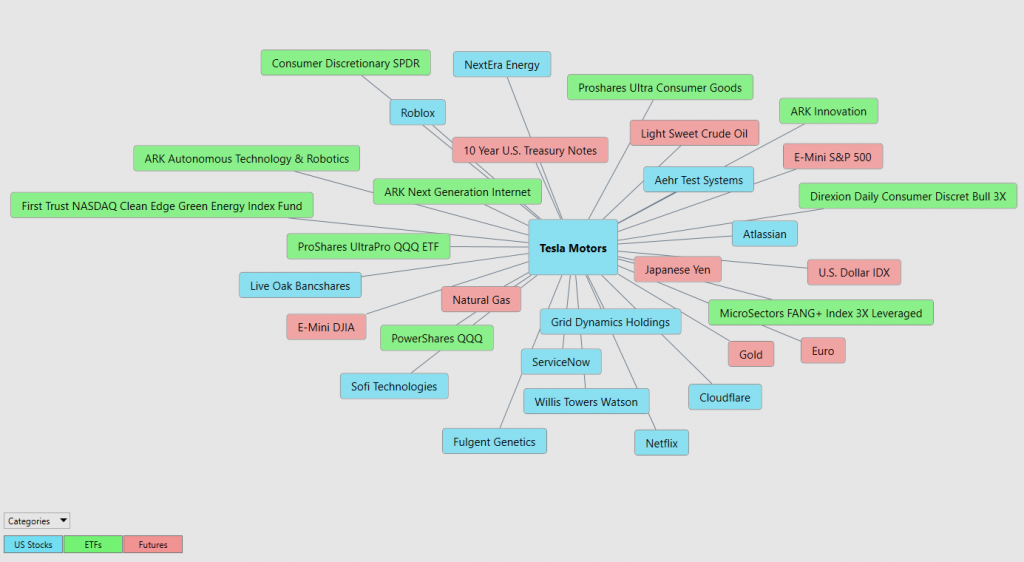
In the world of trading, it’s not just about what you know, it’s about how you put that knowledge into action. Traders, they’re like detectives, always on the hunt for the real reasons behind stock price movements. While the headlines might grab everyone’s attention, traders are the ones diving deep, searching for the true driving force.
That’s where Intermarket analysis comes into play. Think of it as your backstage pass to the financial show. It’s like peeking behind the curtain to see how stocks, bonds, commodities, and currencies are all dancing together. You see, when one asset starts to shine, another might just fade into the background.
Let me give you an example: Take a stock like Tesla ($TSLA). Most folks might just glance at the surface, but the experts? Well, they’re looking at the top 31 factors that are pushing and pulling its price.
So, what’s this intermarket analysis all about? At its core, it’s about understanding the intricate web that connects global markets. When oil prices shoot up, it doesn’t just mean you’ll be paying more at the pump; it could signal higher costs for companies, potentially deflating their stock prices. A shift in bond yields? That could suddenly make other investments appealing, sending shockwaves through where money flows and even shaking up currency values.
Now, for those new to the game, John J. Murphy practically wrote the rulebook on this strategy with his book “Intermarket Technical Analysis.” It’s like a deep dive into how markets are all intertwined, moving to the rhythm of trends and signals. And then, you’ve got folks like Lou Mendelsohn of WT Finance Institute Software, leading the charge in fine-tuning these market relationships, breaking them down for traders.
So, to all you traders out there, the next time you’re scratching your head over why a stock is going up or down, remember the bigger picture. It’s about understanding these intermarket connections, where the real magic happens.
Our Suggestion
Since $TSLA is a component of the NASDAQ index, the S&P 500 Index, and the Dow Jones Industrials we can appreciate how much enthusiasm exists for a reincarnation of the amazing performance it had from the time it went public.
Tesla has numerous major challenges in 2023 but it is meeting those challenges head on and succeeding.
As traders’ proof of success is higher high prices and higher low prices which is how an uptrend is defined.
Power Traders are looking for opportunities to buy at or below the predictive blue line.
TESLA is fairly valued at the present time according to Wall Street analysts. In our opinion as $TSLA continues to make new highs we expect that ANALYSTS will revise their forecasts upwards. It has only been three months since we last reviewed $TSLA and the average media price forecast on $TSLA increased $73 which is roughly 27% of the current price.
Currently, the trend is UP.
Momentum is UP.
Based upon the trading range possibilities we will continue to look for trading opportunities based upon the Predictive Blue Line and the Neural Index.
We will continue to explore the long side of the market for short-term swing trading opportunities.
Our recommendation is to follow the A.I. trend analysis as outlined in this stock study and practice good money management on all trades.
We will re-evaluate daily based upon:
- New Wall Street Analysts’ Estimates
- New 52-week high and low boundaries
- WT Finance Institute A.I. Forecast (Predictive Blue Line)
- Neural Network Forecast
- Daily Range Forecast
The trend in $TSLA is UP. Pay attention to the next earnings call in $TSLA on October 18, 2023, as it will determine whether advertising is working in helping to promote Tesla vehicle sales. We expect that $TSLA will continue to outsell its competitors by wide margins.
Let’s Be Careful Out There!
It’s Not Magic.
It’s Machine Learning.
Disclaimer: THERE IS A HIGH DEGREE OF RISK INVOLVED IN TRADING. IT IS NOT PRUDENT OR ADVISABLE TO MAKE TRADING DECISIONS THAT ARE BEYOND YOUR FINANCIAL MEANS OR INVOLVE TRADING CAPITAL THAT YOU ARE NOT WILLING AND CAPABLE OF LOSING.
WT Finance Institute’S MARKETING CAMPAIGNS, OF ANY KIND, DO NOT CONSTITUTE TRADING ADVICE OR AN ENDORSEMENT OR RECOMMENDATION BY AI Wealth Creation 4.0 OR ANY ASSOCIATED AFFILIATES OF ANY TRADING METHODS, PROGRAMS, SYSTEMS OR ROUTINES. WT Finance Institute’S PERSONNEL ARE NOT LICENSED BROKERS OR ADVISORS AND DO NOT OFFER TRADING ADVICE.