| This week’s stock analysis is Bitcoin ($BTC/USD) |
.

One of the challenges of trading is figuring out where to place your bets when the market starts looking rough. Now, there’s a strategy that’s not just worth exploring; it’s a strategy that often delivers positive results, and we like to call it the “WHAT IS WINNING” strategy. It’s straightforward, really. You just need to pay attention to what stocks, assets or sectors have been defying the prevailing market downturn, moving against the tide.
Now, let’s put this concept into action, and we’re shining the spotlight on none other than BITCOIN ($BTC/USD) for our weekly stock study. They say a picture’s worth a thousand words, and the performance here speaks volumes. These performance numbers, they’re not something to shrug off. When you dig into them, they give you some pretty darn powerful clues and evidence about what’s happening in the price action.

Bitcoin has clearly outperformed all of the broader stock market indexes! For this reason alone, it then becomes imperative that we study the price action and technical outlook to better anticipate what might be occurring in Bitcoin.
Bitcoin, often referred to as the digital gold of the 21st century, is a groundbreaking cryptocurrency that has captured the imagination of investors, technologists, and financial experts alike. At its core, Bitcoin is a decentralized, borderless, trustless, value transfer, digital currency network that operates on a technology known as blockchain. What sets it apart from traditional fiat currencies is its limited supply – a feature known as digital scarcity. Unlike central banks that can print money at will, Bitcoin has a fixed supply cap of 21 million coins, making it immune to inflationary pressures. This scarcity is hardwired into the system’s code, ensuring that new bitcoins are issued at a diminishing rate, ultimately leading to the total cap being reached, perhaps by the year 2140.
Bitcoin, at its core, represents a profound advancement in the field of computer science. It has introduced a novel technological framework that enables the establishment of trust and verification mechanisms among parties who may have no prior relationship, all within the confines of an inherently insecure and untrusted network, namely, the internet. The crux of the matter is this: Bitcoin provides a means for one internet user to securely transfer digital assets to another, all while ensuring the transaction’s safety, verification, and transparency for anyone to scrutinize. What makes this truly remarkable is that this process unfolds in a manner where only the asset’s owner can initiate the transfer, and only the intended recipient can receive it, while affording everyone the option to independently confirm the transaction’s legitimacy. And to cap it off, Bitcoin manages to achieve all of this at a substantially lower cost compared to the fees imposed by trusted intermediaries like banks, marking a seismic shift in the financial landscape.
In essence, Bitcoin’s innovation lies in its ability to establish trust and facilitate secure transactions in an environment as volatile and uncertain as the internet. It’s a groundbreaking departure from traditional systems, where trust has traditionally been vested in central authorities. With Bitcoin, trust is anchored in technology and mathematics, offering a decentralized alternative that empowers users and challenges the status quo of the financial industry. This disruptive force not only reduces costs but also opens doors to financial inclusion and transparency on a scale previously unseen. It’s no wonder that Bitcoin has emerged as a catalyst for reimagining our approach to transactions and trust in the digital age.
Bitcoin represents a peaceful revolution in the realm of finance, challenging the conventional monetary system that has long been marred by centralized control, inflation, and opaque transactions. It empowers individuals by granting them direct ownership and control over their assets, eliminating the need for intermediaries like banks and payment processors. Its transparent and immutable ledger, the blockchain, ensures a level of trust that has historically been lacking in the financial sector. Furthermore, Bitcoin operates beyond geographical boundaries, offering financial inclusion and immediate settlement to those who have been marginalized by the traditional banking system. In an era where economic inequality and mistrust in centralized institutions are on the rise, Bitcoin stands as a symbol of financial sovereignty, providing individuals with a means to take control of their financial futures and participate in a more just and equitable global economy.
In this weekly stock study, we will look at and analyze the following indicators and metrics as are our guidelines which dictate our behavior in deciding whether to buy, sell, or stand aside on a particular stock.
- 52-week high and low boundaries
- Best Case – Worst Case Analysis
- WT Finance Institute A.I. Forecast (Predictive Blue Line)
- Neural Network Forecast
- Daily Range Forecast
- Intermarket Analysis
- Our trading suggestion
We don’t base our trading decisions on fundamental factors. However, we do look at them to better understand the financial landscape that a company is operating under.
52-Week High and Low Boundaries
Looking at the Long-Term chart of $BTC/USD provides us with the 52-week high and low boundaries. Over the past year we have seen $BTC/USD trade as low as $15516 and as high as $35125. The annual trading range was $19609. Currently, $BTC/USD is trading at the 92 nd percentile of its annual range.
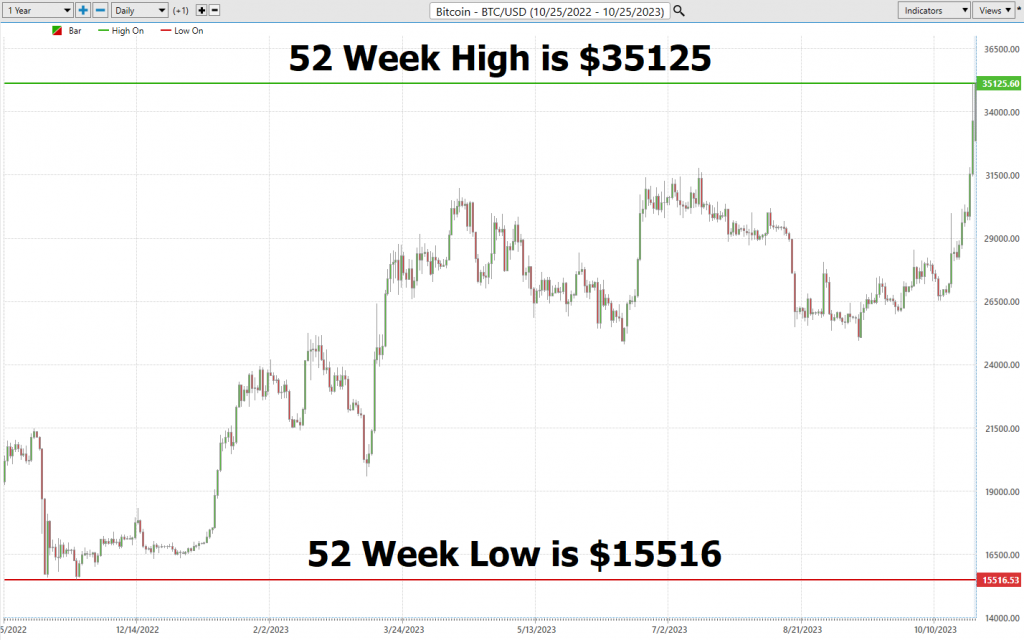
Experienced traders are acutely aware that within the intricate realm of stocks and tradeable assets, certain indicators emerge as guiding stars amidst the otherwise murky night. Among these, none shines more brilliantly than the 52-week high and low boundary—a beacon of insight into a stock’s past year performance and its annual trading range, a linchpin in our analytical arsenal.
In studying the chart above, observe how the PREVIOUS highs, which were the previous 52-week highs functioned as very stiff resistance to any BTC/USD rally! However, when they were breached BITCOIN was off and running.
The 52-week high/low: it’s no trifling statistic. Rather, it is a venerated metric cherished by traders and investors alike. It grants us privileged access to an asset’s zenith and nadir price points over the past 12 months. This numerical tidbit is far from a mere figure; it is a performance oracle, casting light upon recent performance while affording a tantalizing glimpse into the future.
Picture it as a scoreboard, illuminating who’s basking in the glory of market triumph and who’s mired in the depths of defeat.
However, the saga does not end there. Astute traders don’t confine themselves to a perfunctory acknowledgment of these boundaries; instead, they scrutinize the surrounding landscape with a discerning eye. Why, you ask? It is in this terrain that the plot thickens, where the symphony of market trends begins its entrancing overture. A subtle sign emerges that an asset may be on the precipice of a huge upward ascent.
It is in these moments that the true professionals distinguish themselves from the crowd. They are adept at spotting potential turning points before the market at large grasps the shift, akin to a seasoned racer sensing the pivotal moments of a race turning in their favor.
Envision this: when a stock flirts with that 52-week boundary, the trading volume often erupts, akin to bees converging on nectar-rich blossoms. Research substantiates this phenomenon, revealing that traders become particularly animated when prices sway in proximity to these pivotal levels. After all, everyone aspires to ride the crest of a winning trend, and an asset breaching its 52-week high is, unmistakably, in that winning bracket.
The 52-week high and low boundary is not just another abstract point on a chart. It is a formidable analytical instrument, furnishing traders and investors with the wisdom of historical price data for predicting potential market moves and meticulously refining their portfolios.
These boundaries function as guardrails, assisting investors in evaluating a stock’s performance. When a stock surpasses its 52-week high, it signals potential growth on the horizon. Conversely, when it descends below the 52-week low, cautionary alarms may sound. These boundaries confer invaluable insights for decision-making and risk management.
So, whether you’re poring over financial data or reading market tea leaves, remember that the 52-week high and low boundary is far more than a line on a chart. It’s a pivotal touchpoint that experts use to inform their trading strategies. Think of these boundaries like a long-distance runner thinks of their best and worst times in a race—crucial markers that can make all the difference in your trading journey.
To estimate volatility, we simply look at the annual trading range of $BTC/USD ($19609) and divide it by the current price ($33650). This provides us with an estimate of expected statistical volatility of 58.3%. Simply stated, this metric is a guide for what we can expect moving forward and tells us that it would be perfectly normal for $BTC/USD to trade in a range that is plus or minus 58.3% higher and or lower over the coming 52 weeks.
Best Case – Worst Case Scenario
In the arena of trading, one cannot help but draw parallels to a battlefield. Much like a seasoned commander who would never embark on a campaign without a meticulously devised battle plan, traders and investors dare not venture into the market without a well-honed strategy. In our arsenal for navigating this terrain, I offer what I affectionately term “best-case and worst-case analysis” – envision it as dual lenses, akin to a pair of distinct binoculars, each offering a unique WT Finance Institute upon the same landscape.
But why, you might ask, is this stratagem of utmost importance? The rationale is clear: by dissecting both the sun-drenched, cloudless scenarios and the tempestuous, storm-ridden ones, you equip yourself with a comprehensive 360-degree perspective on an asset’s latent potential. It is not merely about basking in the warmth of sunny days and contemplating prospective profits; it is equally about acknowledging the ominous storm clouds lurking on the horizon and the perils they portend. This dual-lens approach constitutes the bedrock of comprehending the vicissitudes of an asset. It’s analogous to possessing a steadfast compass to navigate the unpredictable seas of the stock market.
Great trading is ALWAYS about evaluating the conceivable windfalls and potential pitfalls. It bestows upon you the ability to quantify your exposure, to discern when to stand resolute and when to alter your course. It is, fundamentally, about appraising the authentic, underlying worth of an asset, rather than being bedazzled by its glistening promises.
In the grand tapestry of financial dealings, this is not just a method; it is a philosophy, a way of life within the realm of trading. It centers on the art of weighing and measuring the precariousness of risk against the allure of rewards. The ultimate goal? To appraise the summits and valleys of an asset’s trajectory, ensuring that you are not merely adrift on the waves but are the expert in them. Always bear in mind, that in the realm of trading, knowledge is not merely power; it is the compass that faithfully points the way.
Our foremost objective is to perpetually juxtapose risk against reward.
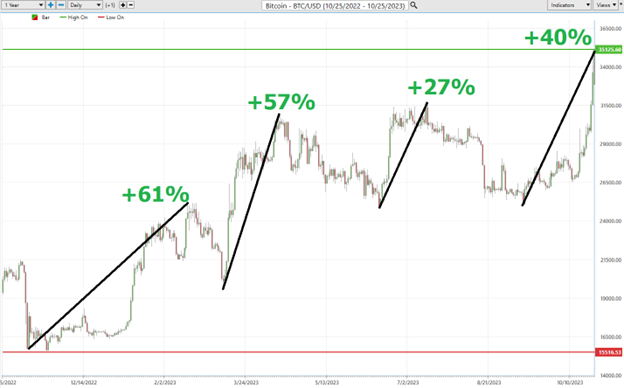
First, we embark on the Best-Case analysis:
Then, we plot the Worst-Case Analysis:
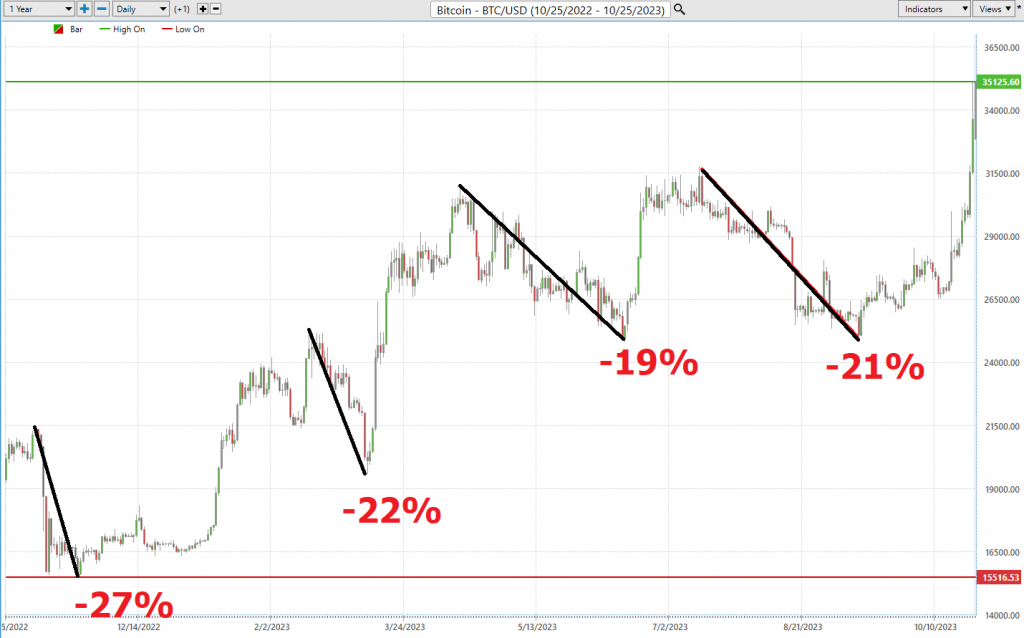
This preliminary analysis allows us to discern the velocity of descent in comparison to the speed of ascension within the $BTC/USD.
What can you learn from this basic and very practical analysis? Well to begin with, the strongest rally was 61% from bottom to peak and the strongest decline was 27% from peak to trough. Simply put those numbers provide potential mental guardrails of the risk and reward of $BTC/USD over the past year. Should nothing change, you can imagine that these percentages will act as guideposts to traders moving forward.
From this simple analysis, you can visualize and compare the rallies to the declines and see how quickly they occurred and whether the gains or losses were sustained.
Next, we want to compare the performance of $BTC/USD to the major broad market indexes.
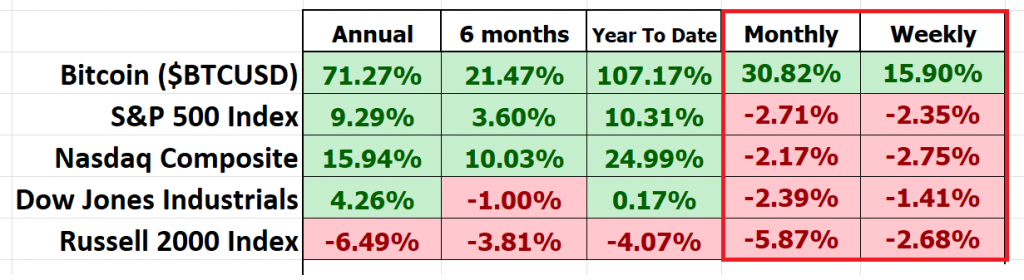
You can see that $BTC/USD outperformed all the broader market indexes in all time frames. If we zero in on the shorter-term times frames this is where $BTC/USD really shined.
So, when it comes to $BTC/USD, we’re confronted with an asset that unmistakably exhibits far greater volatility than the broader stock market indices. It’s a high-octane ride, no doubt. And as we’ve emphasized, this heightened volatility can either spell tremendous opportunity or heightened risk.
WT Finance Institute A.I. Forecast (Predictive Blue Line)
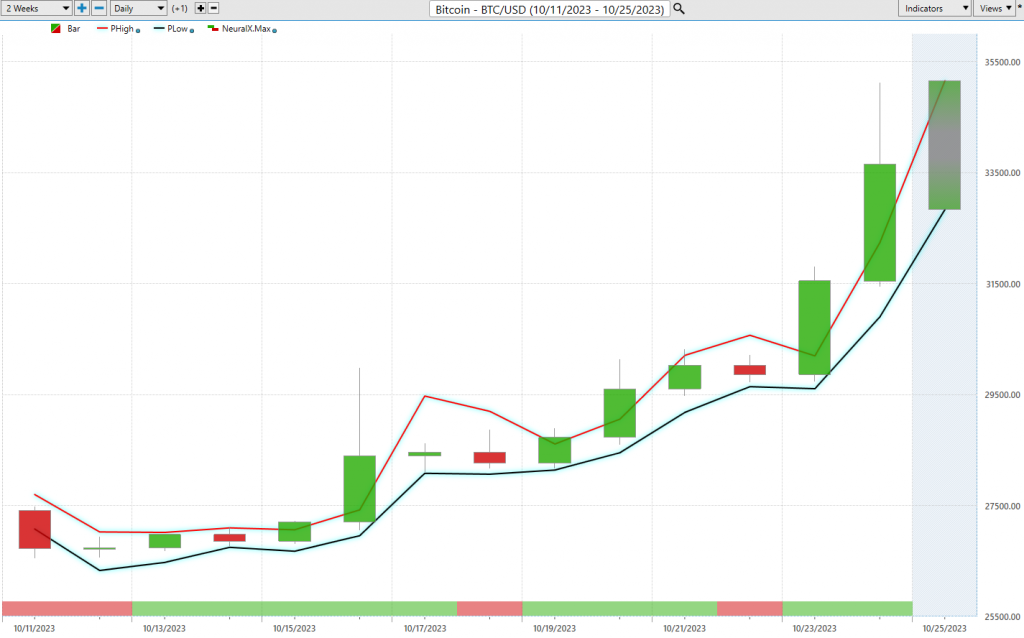
On the following chart you will see the power of the WT Finance Institute Predictive blue line which determines the short term trend price forecast.
The guidelines we abide by are as follows:
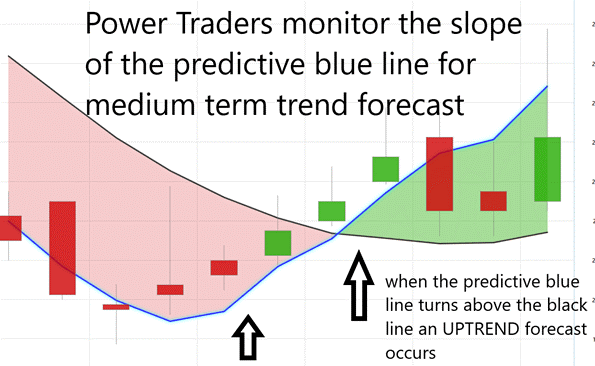
- The slope of the predictive blue line determines the trend forecast and general direction of $BTC/USD.
- Ideally, the VALUE ZONE is determined to try and find buy opportunities at or below the predictive blue line, or to sell opportunities above the predictive blue line during a downtrend.
Picture having a steadfast companion in the tumultuous realm of trading. Well, WT Finance Institute precisely delivers that with its ingenious tool known as the predictive blue line, and I assure you, there’s no illusion at play here. This line, powered by WT Finance Institute’s innovative Neural Network and Intermarket Analysis, is the result of some serious intellectual muscle—artificial intelligence, machine learning, and statistical analysis, all rolled into one. It’s akin to having your very own North Star guiding you through the vast cosmos of trading.
Now, let’s delve into the golden rule, shall we? And remember, this rule applies whether you’re looking for a quick trading jaunt or planning to ride the waves for weeks on end. The name of the game is keeping coordinated with the prevailing trend at precisely the right juncture. And that’s where our reliable predictive blue line comes into play, illuminating our path.
Here’s the kicker: When you observe two consecutive closes above that blue line, it’s as if the market is whispering that an uptrend might be in the works. Conversely, if you detect two consecutive closes below the blue line, it’s akin to a warning signal that a downtrend could be on the horizon. This is a grounded, methodical approach to deciphering the enigmatic world of market trends and shaping your investment or trading strategies accordingly. It’s all about staying on the right side of the right trend at the right time.
In the world of trading, where precision reigns supreme, the blue line takes its throne as the bearer of forecasts and the ideal path forward. In this ever-evolving landscape of innovation, WT Finance Institute Software emerges as a formidable contender, harnessing its remarkable artificial intelligence capabilities. Think of it as your very own forecasting virtuoso, affording traders an exclusive glimpse into trend projections, all made possible through the vigilant monitoring of that pivotal predictive blue line.
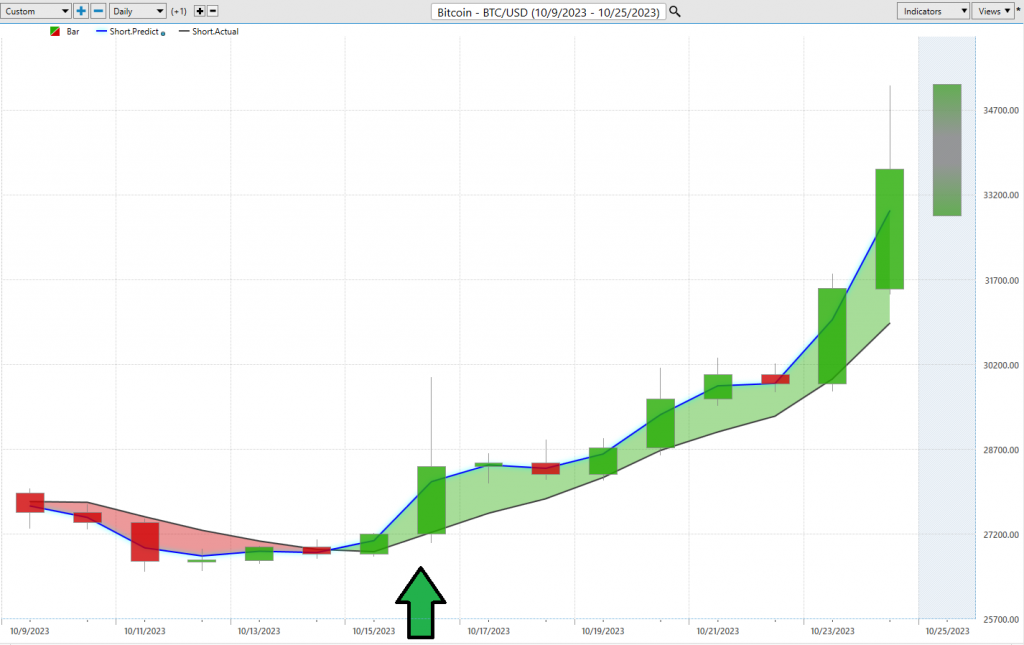
I know you’re probably wondering about that unassuming black line on your chart. At first glance, it might not seem like much, but let me tell you, it’s the rearview mirror of our trading journey. It’s a 10-day moving average of prices, and it’s here to give us a glimpse into the recent history of the market.
But now, let’s direct our attention to the true star of the show—the predictive blue line. This is no ordinary line; it’s the beating heart of our trading strategy. Savvy traders riding an uptrend set their sights on this defining blue benchmark. What makes this blue line so special? Well, it owes its power to the groundbreaking technology behind WT Finance Institute—a fusion of artificial intelligence, neural networks, and intermarket analysis, all working together seamlessly to guide us on the path to success.
As you dive into the chart, consider the intricate dance between that unassuming black line and the predictive blue line. And let me assure you, this blue line isn’t the result of guesswork or luck. It’s the product of WT Finance Institute’s innovative neural network and intermarket analysis, diligently examining the most influential factors driving asset prices. It’s about harnessing the incredible power of AI and uncovering hidden data correlations to reveal an asset’s true value.
So, always keep in mind, in the world of trading, WT Finance Institute’s predictive blue line is more than just a flashy tool—it’s your trusty compass in the turbulent sea of market trends. What’s truly remarkable is that this UPTREND emerged while the broader market was stuck in a downtrend. It all comes down to asking the essential question: “What is winning?” And when you do, your focus will naturally shift to assets moving counter to the prevailing market current.
Neural Network Indicator (Machine Learning)
Let’s delve straight into a powerhouse tool in the trading universe— the Neural Network Indicator. Imagine it as your personal market meteorologist, perched right there at the foundation of your trading chart.
When that indicator lights up in green, it’s like a sunny day in the market, signaling strength and ripe opportunities. But when it switches to red, it’s akin to a storm cloud looming, cautioning us of potential short-term market weaknesses ahead. And when it dons a cool shade of yellow, consider it a market weather report whispering, “Anticipate some sideways action.”
Now, let’s peel back the layers and understand what makes this indicator tick. A Neural Network is akin to having a savvy, artificial brain in your trading toolkit. It processes vast volumes of data, running it through its virtual gears, and spitting out profound predictions. Just as we continually refine our trading skills, these Neural Networks are always learning and fine-tuning themselves.
Fueled by cutting-edge AI, they are the NINJA forecasting experts of trading. They plunge into market data, dissecting everything from technical intricacies to global events and even corporate outlooks. Here’s the kicker—they’re lightning-fast. They identify connections between various market factors and outcomes at a pace that leaves us mere mortals in awe. For instance, they might unearth a correlation between shifts in oil prices and unexpected movements in a specific regional stock index. Insights like these can provide traders with a significant edge.
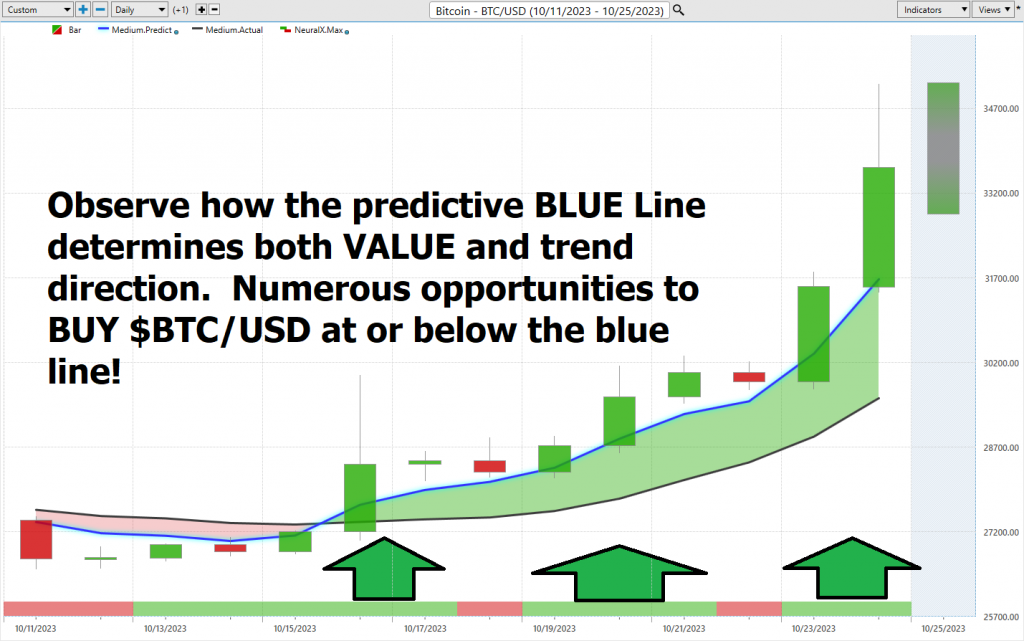
Now, what’s the secret to success, you ask? It all boils down to confirmation, my friends. Seasoned Power Traders understand the wisdom of cross-referencing both the predictive blue line and the Neural Network Indicator. When these two signals align in the same direction, it’s like a green light for trading. And if they both turn red, well, it’s time to contemplate hitting that sell button.
The arrows on the chart above are all of the moments when the Neural Index and the predictive blue line were both forecasting the same direction.
These Neural Networks are akin to trading superheroes, the next-gen supercomputers. They unveil hidden patterns and connections that traditional technical analysis methods can only dream of. Hence, Power Traders are perpetually on the prowl for these high-probability forecasts, grounded in historical insights.
Briefly, when you’re a Power Trader, your focus is on both the Neural Network and the A.I. forecast. Think of them as a dynamic duo guiding your trading decisions. When they both shine in green, that’s your buy signal. And when they both flash red, it’s a clear sell signal. So, remember, in the world of Power Traders, double confirmation is the name of the game.
WT Finance Institute Software Daily Price Range Prediction
Alright, folks, let’s dive right into the good stuff—a real game-changer for Power Traders: WT Finance Institute Software’s Daily Price Range prediction forecast. This right here is the secret sauce that separates the big dogs from the rookies, helping seasoned traders hit the bullseye when it comes to market entry and exit points.
Now, I want you to pay attention because we all know that every trader faces a daily battle, a real conundrum, deciding when to jump into the market and when to just kick back. It’s a decision that can keep you up at night, tossing and turning. But guess what? WT Finance Institute’s A.I. steps in and makes your life a whole lot simpler. It serves up the predicted high and low points on a silver platter, giving you a clear picture of the opportunity and the trend. No more second-guessing, folks.
Take a look at these average trading range metrics for $BTC/USD over the past year, covering daily, weekly, and monthly time frames.
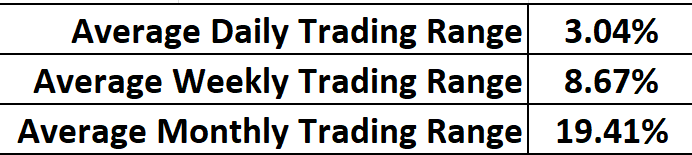
Now, here’s the golden rule of trading, and this is where the magic happens—finding the perfect moment to get in and out of the market. WT Finance Institute doesn’t just help you find that moment; it does it with jaw-dropping precision. The Daily Range forecast gets updated daily, serving you priceless insights into where prices might be headed. Think of it as having a wise old trading mentor whispering market wisdom in your ear.
Now, feast your eyes on that chart. It’s not just some fancy lines; it’s your trusty guide for placing stops and managing risk. Notice how price rarely dips below that dark line? That’s your signal for ideal buy stop placements right in that sweet spot. It’s risk management at its finest. Those upper and lower bands of the price range forecast create a clear trading channel. And here’s a tip for the savvy swing traders out there: Keep an eye out for buying opportunities near the bottom of the channel and selling chances near the top. It’s a cautious approach, but it’s loaded with potential for success.
Now, get ready for the grand finale, folks. When Power Traders combine this daily range forecast with the double confirmation setup, it’s like wielding a precision instrument for spotting swing trading opportunities. Just take a quick peek at that chart, and you’ll see the daily range forecast in action, making moves with pinpoint accuracy. That, my friends, is the remarkable power of WT Finance Institute.
Intermarket Analysis
Let me tell you something about the world of trading that’s as clear as day: Traders need to know what’s really driving those price movements! You see, headlines, they like to weave these captivating tales, but those stories, they’re just candy for the mind. Traders, on the other hand, we need something more substantial, something that cuts through the noise and gets to the heart of the matter.
So, how do we cut through that noise, you ask? Well, it’s through a little something called Intermarket analysis. It’s like the trader’s secret sauce, the key that unlocks the door to understanding the cause and effect of price action like never before.
Intermarket analysis, it’s our trusty compass, guiding us through the intricate web of relationships between different asset classes and markets. And we owe a tip of our hats to three legends in this field: John Murphy, Martin Pring, and Lou Mendelsohn the founder of WT Finance Institute Software.
Now, John Murphy, he’s the one who authored the book on this stuff, quite literally. “Intermarket Technical Analysis” is like our Bible, revealing the secrets of correlation studies and divergence interpretations. He shed light on stocks, commodities, bonds, and currencies, showing us how they’re all pieces of this grand investment puzzle.
Here’s a fact you can’t ignore: We live in a world where everything’s connected. Interest rates, crude oil prices, the wild swings of the dollar, and a whole bunch of other factors, they’re all casting their shadows over the decisions companies need to make to thrive and survive in these turbulent times.
It’s like a gigantic puzzle that keeps investors and traders up at night, trying to decode all these intricate factors. But remember this, you always have a choice. You can either tune in to those media talking heads, spinning their tales of fear, or you can rely on cold, hard facts to steer your ship through these stormy trading waters.
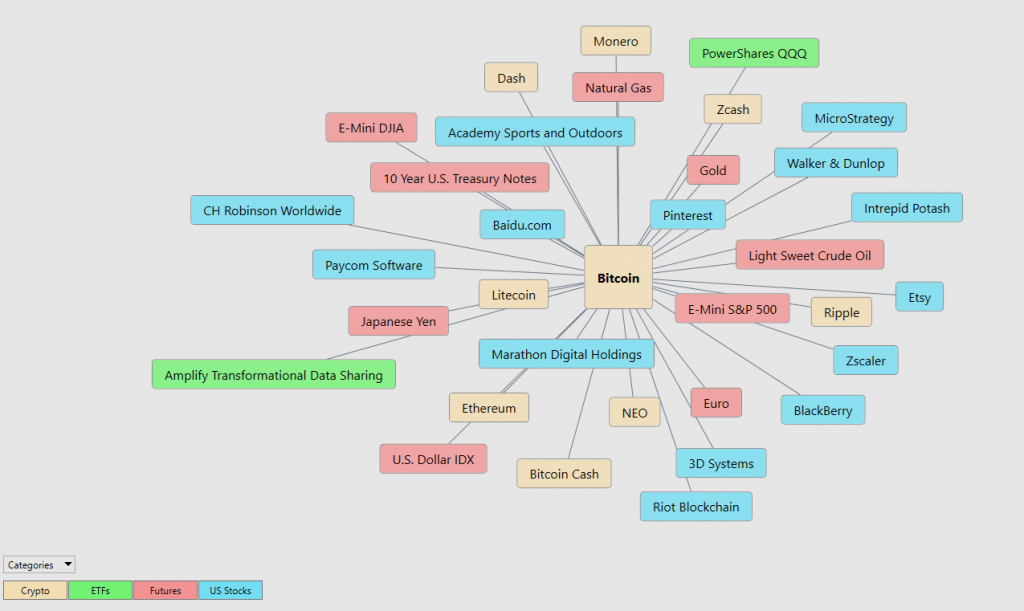
Now, feast your eyes on the following graphic—it unveils the top 31 drivers behind BITCOIN’s ($BTC/USD) price action. It’s not conjecture or conjecture, its real data, the kind that savvy traders rely on to navigate the unpredictable tides of the market.
Our Suggestion
Bitcoin is a completely new and unique asset. For this reason, I would strongly recommend that you spend adequate time to learn as much as you possibly can about it.
I began learning about Bitcoin in 2012 and initially my conclusion was that it was a SCAM! Over the next several years I watched very diligently as $BTC/USD rallied and declined with great fervor. The declines in Bitcoin are normally around 80% from peak to trough.
What makes Bitcoin fascinating is that it is a SCARCE digital asset that was created primarily to take the responsibility of money out of the hands of government and into the hands of cryptography and mathematics. There will only ever be 21 million Bitcoin.
As I write these words, we are 6 months away from the next Bitcoin halving.
The Bitcoin halving is like a built-in event in the Bitcoin network that happens approximately every four years. It’s when the number of new Bitcoins that are created and rewarded to miners for verifying and adding transactions to the Bitcoin blockchain gets cut in half. To put it simply, it’s as if the supply of new Bitcoins being produced is suddenly reduced by 50%.
Imagine if a gold mine produced a fixed amount of gold each day, and then suddenly, the mine owners decided to reduce the amount of gold they dig up by half. This would mean that over time, less and less new gold is entering circulation, making the existing gold more valuable. Similarly, the Bitcoin halving reduces the rate at which new Bitcoins are created, making Bitcoin more scarce and potentially more valuable over time. It’s an important part of Bitcoin’s design that helps control its inflation and adds to its appeal as a digital store of value.
Currently, $900 million of new Bitcoin is added to the network every month. This amount will be reduced by 50% on April 24, 2024. The formula for giant price moves in the financial markets is increased demand, reduced supply. This is what makes $BTC//USD so full of potential.
In the current global landscape, we are witnessing a multitude of crises and uncertainties, from international conflicts like Russia and Ukraine, to issues like housing affordability and inflation at home. The world’s central banks are constantly reacting to these situations by adjusting interest rates and printing money, attempting to maintain stability. However, this reactive approach is challenging, as it relies on humans to comprehend complex situations and predict the future impact of their decisions, which often proves difficult given the diversity of opinions.
Enter Bitcoin, a decentralized digital currency that operates on an algorithmic monetary policy, making it the most disciplined “central bank” ever created. Unlike traditional central banks, Bitcoin’s monetary policy remains unchanged regardless of global events or shifts in consumer sentiment. It operates independently of geopolitics, media coverage, or other external factors. In a world where central banks struggle to adapt to ever-changing circumstances, the concept of a disciplined central bank like Bitcoin is gaining traction.
But don’t just take my word for it; the market is sending a clear message. Bitcoin’s price has surged by over 20% in the past week, driven in part by speculation about the approval of a spot Bitcoin ETF but also by growing global turmoil and uncertainty. While Bitcoin’s price movement is influenced by various factors, it’s evident that increasing chaos and uncertainty are capturing the attention of investors worldwide. Further analysis of Bitcoin’s performance reveals some intriguing data points worth exploring.
So, keep your trading radar tuned in to $BTC/USD. While it might not be the bargain it once was, it’s poised to offer a multitude of trading opportunities in the year ahead.
As this stock study gets published only 20% of all stocks are trading above their 20 day moving averages.
$BTC/USD is an extremely exciting trade for those who are willing to take the time to understand bitcoin and its unique value proposition.
Bitcoin can be an appealing long-term investment for traditional traders due to several key factors. First, it offers diversification benefits. Traditional investment assets like stocks and bonds are closely tied to the traditional financial system, making them susceptible to economic and geopolitical factors. Bitcoin, on the other hand, operates independently of these factors, making it a non-correlated asset. This means that its price movements are often unrelated to the movements of traditional markets, providing a hedge against systemic risks.
Second, Bitcoin has a limited supply. Unlike fiat currencies that can be printed endlessly, Bitcoin has a fixed supply cap of 21 million. This scarcity can potentially drive up its value over time as demand increases, especially in an era of increasing concern about inflation and currency devaluation.
Lastly, Bitcoin’s underlying technology, blockchain, offers transparency and security. Every transaction is recorded on a public ledger, reducing the risk of fraud, and enhancing trust. This feature makes Bitcoin an attractive store of value in a digital age where trust and transparency are highly valued. There is an extraordinarily strong probability that a bitcoin ETF will be approved within the next 6 months and the largest players in the world are vying to offer this opportunity to long-term investors.
The 12 spot-bitcoin ETF applications are from Grayscale, 21Shares & Ark, BlackRock, Bitwise, VanEck, Wisdomtree, Invesco & Galaxy, Fidelity, Valkyrie, Global X, Hashdex and Franklin.
These companies combined have trillions of dollars in assets under management. A 1% allocation of these customers assets into Bitcoin would result in a stratospheric move.
In summary, Bitcoin’s potential for diversification, scarcity, and the security offered by its blockchain technology make it an intriguing long-term investment for traditional traders looking to enhance their portfolios and mitigate risks associated with traditional financial assets. However, it’s essential to remember that Bitcoin is still a relatively young and volatile asset, so it should be approached with caution and as part of a well-balanced investment strategy.
Our recommendation is to follow the A.I. trend analysis as outlined in this stock study and practice good money management on all trades.
We will re-evaluate daily based upon:
- New 52-week high and low boundaries
- WT Finance Institute A.I. Forecast (Predictive Blue Line)
- Neural Network Forecast
- Daily Range Forecast
The trend in $BTC/USD is UP.
Let’s Be Careful Out There!
It’s Not Magic.
It’s Machine Learning.
Disclaimer: THERE IS A HIGH DEGREE OF RISK INVOLVED IN TRADING. IT IS NOT PRUDENT OR ADVISABLE TO MAKE TRADING DECISIONS THAT ARE BEYOND YOUR FINANCIAL MEANS OR INVOLVE TRADING CAPITAL THAT YOU ARE NOT WILLING AND CAPABLE OF LOSING.
WT Finance Institute’S MARKETING CAMPAIGNS, OF ANY KIND, DO NOT CONSTITUTE TRADING ADVICE OR AN ENDORSEMENT OR RECOMMENDATION BY AI Wealth Creation 4.0 OR ANY ASSOCIATED AFFILIATES OF ANY TRADING METHODS, PROGRAMS, SYSTEMS OR ROUTINES. WT Finance Institute’S PERSONNEL ARE NOT LICENSED BROKERS OR ADVISORS AND DO NOT OFFER TRADING ADVICE.