| This week’s a.i. Stock Spotlight is Royal Caribbean ($RCL) |

Today we have a special feature on a titan of the seas, Royal Caribbean Cruises Ltd, ticker symbol $RCL. A company that has not just weathered the storm but is now sailing full speed ahead in the global cruise industry. Founded back in 1968 by a trio of Norwegian shipping magnates, Royal Caribbean has charted a course from humble beginnings to become a leading name in luxury cruising. With its headquarters anchored in Miami, Florida, this cruise behemoth operates a fleet of 24 majestic ships, offering voyages that span the globe.
The company offers a wide range of global itineraries, reaching destinations that include the Caribbean, Alaska, Europe, Asia, and Australia, providing a variety of cultural and sightseeing opportunities for travelers. Royal Caribbean’s “Symphony of the Seas” holds the record for the world’s largest cruise ship. It can accommodate over 6,000 passengers. Some of their ships feature the Aqua Theater, an amphitheater set at the stern, showcasing high diving and acrobatics shows.
The company’s lifeblood is its cruise operations, with revenue streams flowing from ticket sales that encompass accommodations, meals, and a plethora of onboard activities. But that’s not all – they also rake in additional revenue from onboard purchases, including beverages, specialty dining, and entertainment, not to mention their innovative offerings like robot bartenders and virtual balconies.
A virtual balcony is a feature found on some cruise ships, and originally offered by $RCL. It is a technological innovation designed to enhance the interior cabins of the ship, which traditionally do not have windows or actual balconies. The virtual balcony simulates an actual outdoor view and professes to improve the cruise experience for those customers with interior cabins.
In the competitive seas of the cruise industry, Royal Caribbean sails alongside giants like Carnival Corporation and Norwegian Cruise Line Holdings. These companies are in a constant race, competing over fleet size, itineraries, onboard experiences, and pricing strategies.
Focusing on the numbers, RCL boasts a market cap of a staggering $29.26 billion. Over the last year, they’ve generated a revenue of $13.17 billion and netted a profit of $2.38 billion. The stock shows a 76% correlation to the S&P 500 Index, making it a significant player in the market.
2023 has been a banner year for Royal Caribbean. As the pandemic’s grip loosened, people, flush with stimulus savings and a hunger for travel, flocked to book cruises. This surge in demand sent hotel and airplane prices sky-high, and investors, sensing an opportunity, began snapping up travel-related stocks. Royal Caribbean, a prime beneficiary of this trend, saw its stock soar by 134% as its revenue, bookings, and profits continued to climb.
In a stunning earnings release in late July, Royal Caribbean reported a 61% year-over-year revenue increase to $3.5 billion. This surge was fueled by higher prices in North America and Europe, a result of limited ship availability and a high demand for tickets. Despite facing inflationary pressures on wages and energy, the company’s strategic price increases have led to a robust profit turnaround.
The company’s recovery and growth over the past three years have been nothing short of remarkable, consistently outperforming EPS estimates and reflecting strong investor confidence. Their focus on experience-based consumer spending, as seen in their recent thematic cruises, has paid off handsomely in terms of revenue and bookings.
In the second quarter, Royal Caribbean reported an operating income of $772 million, a dramatic turnaround from a loss of $219 million in 2022. Over the last 12 months, they’ve generated approximately $1.4 billion in operating income, and they’re on track to surpass $2 billion in profits for shareholders this year.
The future looks bright for Royal Caribbean. Bookings for 2024 are already significantly higher than any previous year, and at record prices. This indicates further pricing power and profit potential for the company.
However, it’s not all smooth sailing. Wall Street analysts express concerns over the company’s ability to cover interest payments on its $18 billion debt. This debt, accumulated during the pandemic, is a significant burden, with some of it carrying interest rates above 10%. In Q2, interest expenses of $355 million significantly impacted their net income, highlighting the material difference in profitability due to this debt.
In conclusion, while Royal Caribbean Cruises Ltd presents a compelling story of recovery and growth, with industry tailwinds and strong earnings potential, investors must navigate the waters carefully, considering the substantial debt that weighs on the company’s balance sheet.
In this weekly stock study, we will look at and analyze the following indicators and metrics as are our guidelines which dictate our behavior in deciding whether to buy, sell, or stand aside on a particular stock.
- Wall Street Analysts’ Estimates
- 52-week high and low boundaries
- Best Case – Worst Case Analysis and Takeaways
- WT Finance Institute A.I. Forecast (Predictive Blue Line)
- Neural Network Forecast
- WT Finance Institute A.I. Daily Range Forecast
- Intermarket Analysis
- Our trading suggestion
We don’t base our decisions on things like earnings or fundamental cash flow valuations. However, we do look at them to better understand the financial landscape that a company is operating under.
Wall Street Analysts’ Estimates
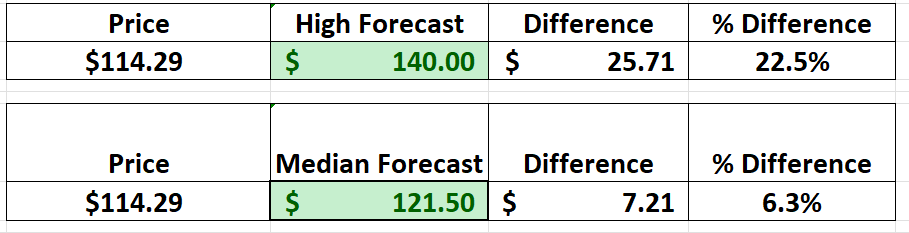
Based on 18 Wall Street analysts offering 12-month price targets for Royal Caribbean in the last 3 months. The average price target is $121.50 with a high forecast of $140.00 and a low forecast of $79.20. The average price target represents a 6.31% change from the last price of $114.29.
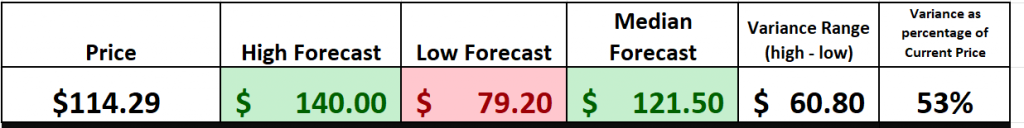
We focus our attention on the variance between the high forecast and the low forecast which is $60.80 and represents a difference of 53% in price perspective. The larger the variance the larger the volatility that a company will exhibit and the greater the trading opportunity.
There are several perspectives that are very enticing to traders and investors. First and foremost is that Wall Street analysts have aggressively been upgrading their price targets on $RCL over the past few weeks. This implies an optimistic environment.
Meanwhile, the most optimistic forecast of $140 represents a 22.5% potential upside. The median forecast represents a 6.3% potential gain.
Let’s just say, in the grand scheme of things, being right on the money isn’t always a given for Wall Street’s finest. Sure, the current financial landscape is painting a pretty rosy picture for Royal Caribbean, at least that’s the word on the Street. But remember, a favorable environment, as promising as it may look for $RCL, isn’t a surefire ticket to accuracy in those analysts’ crystal balls. It’s a bit like sailing in calm seas – it’s pleasant, yes, but it doesn’t mean there won’t be any surprises. So, as much as things are looking up for Royal Caribbean, it’s worth keeping an eye on the horizon. After all, in the world of finance, just like at sea, conditions can change in the blink of an eye.
52-Week High and Low Boundaries
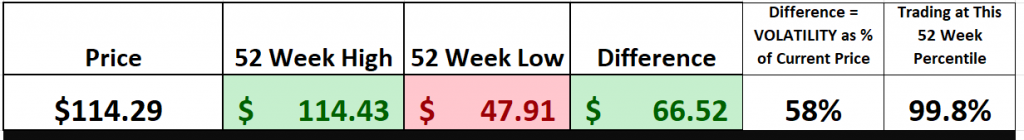
Over the last 52 weeks, $RCL has traded as high as $114.43 and as low as $47.91. From this very simple but practical analysis we subtract the annual low price ($47.91) from the high price ($114.43) to calculate the difference ($68.52). When we divide the difference (68.62) by the current price (114.43) this is a broad-based measure of volatility and tells us that it would be perfectly normal to expect $RCL to trade as much as 58% higher and or lower over the coming 52 weeks.
In today’s deep dive on Royal Caribbean ($RCL), we’re zeroing in on a vital element of stock market analysis: the significance of consistently making new 52-week highs. For traders and investors glued to their Bloomberg terminals, these numbers are far more than mere digits; they’re crucial barometers of market sentiment and momentum. Let’s break it down:
First, consider the psychological dimension. Hitting new 52-week highs isn’t just a numerical feat; it’s akin to breaking a psychological barrier. It signals a growing confidence among investors, suggesting a shift in sentiment that can ignite a bullish fervor around the stock.
Now, think about the narrative of trend continuation. When a stock like $RCL not only touches but maintains levels above its previous 52-week high, it sends a clear message: the bears are in hibernation, and the bulls are taking the reins. This shift can mark the start of a new, upward trajectory, rewriting the stock’s story.
But there’s more: momentum. A stock that consistently sets new 52-week highs often sees an accompanying surge in trading volume. This isn’t just a blip on the radar; it’s a clarion call to investors, signaling that the stock’s rally is gaining steam, attracting more and more participants to its upward journey.
And finally, let’s talk about setting targets. For traders, these new highs aren’t just numbers; they’re milestones, goals to be achieved and surpassed. Each new high sets a benchmark, pushing the stock’s potential further, fueling the fire of its upward momentum. In the dynamic world of trading, where perception often becomes reality, consistently hitting new 52-week highs positions a stock like $RCL in a league of its own, a beacon of bullish sentiment.
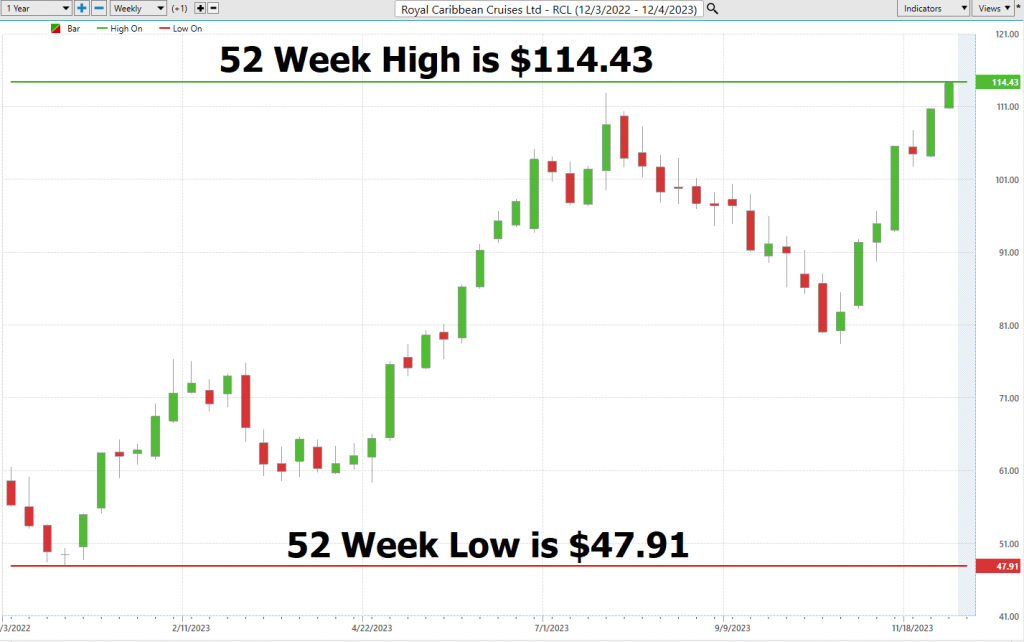
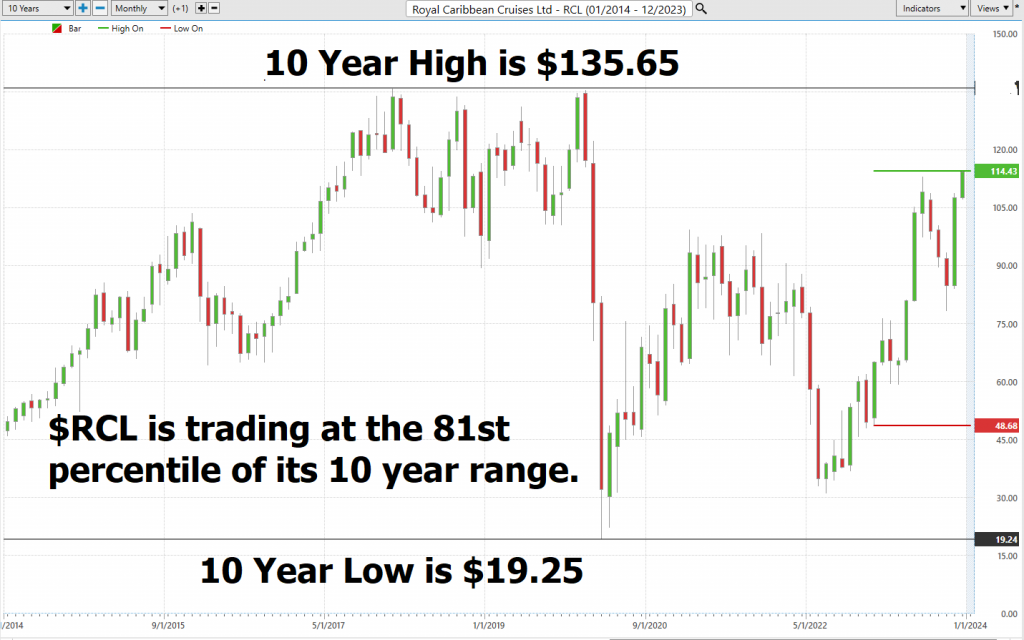
Lastly, we zoom out to a longer-term chart to better understand the trajectory the stock has been on. By doing so we can see that incredibly volatile journey that $RCL has been on over the last 3 years.
Best Case – Worst Case Scenario
In the fast-paced arena of trading, where each decision carries consequences, navigating the market demands a strategy as sharp and precise as a battle-hardened General orchestrating a high-stakes military operation. For those entrenched in the world of trading and investment, it’s crucial to foster a mindset that seamlessly blends unwavering optimism with a deep understanding of real-world ramifications, all while expertly juggling the delicate equilibrium between risk and reward.
Imagine yourself peering through a pair of binoculars, each offering a unique lens into the unfolding terrain. This vividly captures the essence of comprehensive market analysis. You might be wondering, ‘Why is this dual-focused approach of utmost significance?’ The answer is crystal clear. By meticulously scrutinizing both the potential zeniths and the unavoidable valleys, you arm yourself with a panoramic view of a stock’s journey and potential. This method transcends the mere pursuit of profits; it represents a judicious evaluation of lurking risks that could shadow your path. Embracing this dual-vision strategy forms the bedrock of deciphering asset volatility, acting as your guiding star amidst the capricious tides of the stock market.
This isn’t idle conjecture; it’s the art of charting a deliberate course. It involves finely tuning your market exposure, recognizing when to stand unwaveringly firm, and astutely pinpointing moments that demand strategic pivots. It’s about peeling back the layers of a stock’s surface allure to reveal its true intrinsic worth.
In the vast expanse of the market, this approach transcends tactical maneuvers; it embodies a philosophical doctrine. It encapsulates the pursuit of equilibrium on the precarious tightrope between the realms of risk and reward, ensuring that your portfolio is fortified not only for the fleeting present but also strategically aligned for enduring growth. The ultimate aim is to stand vigilant, ready for any conceivable scenario. In the world of trading, knowledge isn’t merely a source of power; it serves as the compass guiding you through the intricate labyrinth on the path to prosperity.
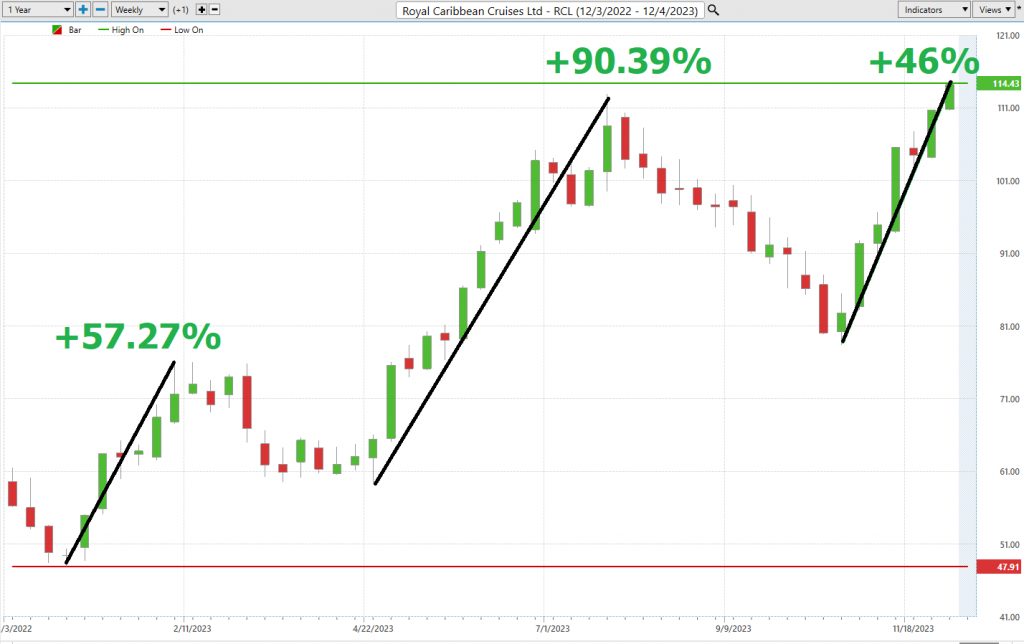
First, we do the Best-Case analysis by connecting the short-term bottoms to the tops:
Followed by the WORST-CASE Analysis where we connect the short-term tops to the bottoms:
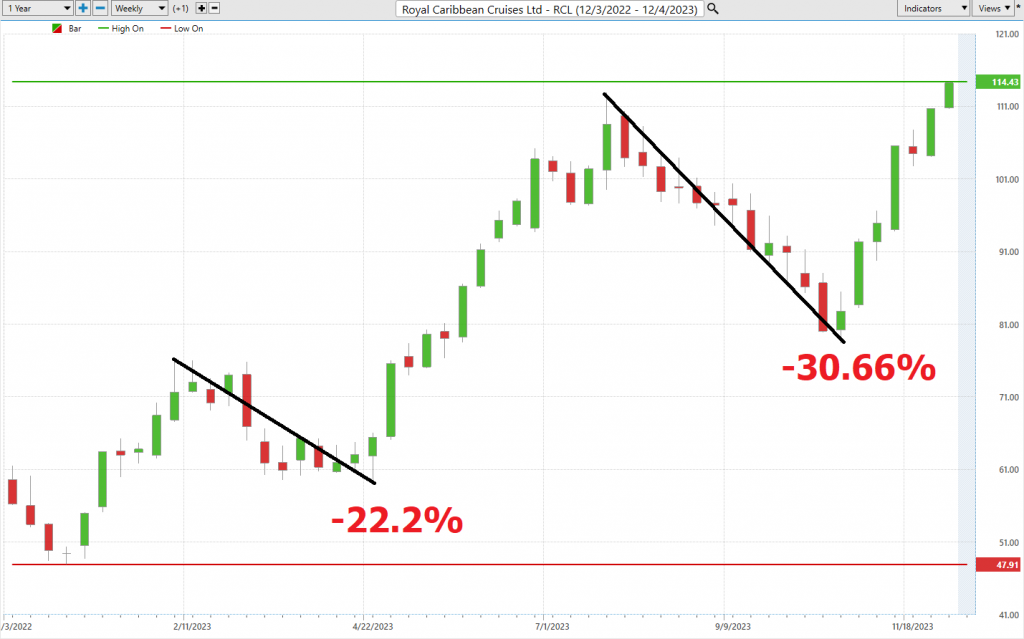
This initial analysis lets us see how quickly $RCL falls in comparison to its rallies.
Next, we want to compare the performance of $RCL to the major broad market indexes.
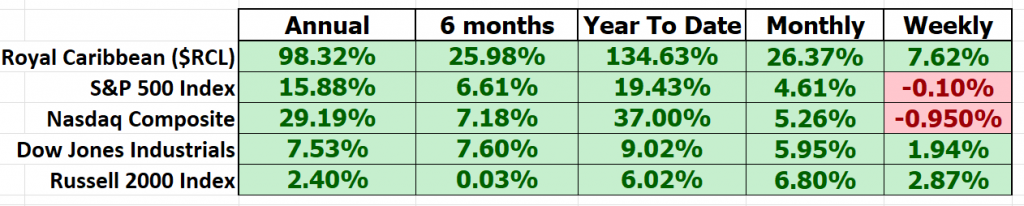
$RCL, a remarkable standout in the market, has consistently outperformed broader market indices across various time frames. Its exceptional performance beckons for a more in-depth examination, particularly in the context of volatility and its comparison with market giants. In the realm of traders, this phenomenon is frequently encapsulated by a metric known as ‘BETA.’
In the bustling world of Wall Street, beta (β) reigns supreme, serving as the financial compass that measures the seismic tremors of the stock universe. Think of it as the Richter scale for stocks, capturing the sensitivity of a stock to the broader market’s ebbs and flows, much like a seismograph tracing the earth’s movements. Typically benchmarked against a major index like the S&P 500, beta tells the tale of a stock’s dance with market dynamics.
Beta = 1: Reflecting the Market’s Pulse
Imagine a stock with a beta of 1, mirroring the market’s every step with unwavering fidelity. When the market surges 5%, this stock dances in perfect harmony, rising 5% as a testament to their synchronized rhythm.
Beta > 1: Embracing the Thrill
Visualize a high-speed rollercoaster, filled with exhilarating yet nerve-wracking twists and turns. A beta exceeding 1, say 1.5, propels the stock into a thrilling ride, 50% more volatile than the market itself. When the market climbs 5%, this high-beta stock embarks on a heart-pounding 7.5% ascent (or descent), akin to a roller coaster of emotions.
Beta < 1: Seeking Stability
Imagine stepping into a tranquil meadow amidst the bustling market chaos. A beta below 1, like 0.5, offers a sense of serenity amid the volatility. If the market enjoys a 5% ascent, this low-beta stock takes a more measured 2.5% rise, offering a serene stroll through the market’s turbulence.
Now, let’s direct our focus to Royal Caribbean ($RCL). Over a 5-year horizon, $RCL boasts a beta of 2.48, signifying that it is 143% more volatile than the broader stock market. Here we encounter a company that presents an exhilarating yet volatile opportunity for those with the stomach for the ride. However, here’s the twist: a high beta, while promising substantial gains, also casts the shadow of substantial losses. It’s a double-edged sword.
So, where does this leave investors? It’s a pivotal choice, akin to a crossroads. Will you embrace the thrill of potentially high rewards with $RCL, or will you opt for a more stable path? This decision is both crucial and deeply personal for every investor and trader.
Yet, let us not overlook the significance of beta, reminiscent of the Richter scale employed in the realm of seismology, as it stands as a foundational gauge within the vast cosmos of the stock market. This metric will persist in molding investment approaches and steering critical choices. Regardless of whether one’s inclination leans toward adventurous risk-taking or prudent safety-first investment, a profound comprehension and reverence for the influence of beta remain imperative when navigating the frequently tumultuous seas of the stock market. It bears repeating that knowledge indeed begets power, a truth that resonates ever so profoundly in the dynamic and ever-evolving sphere of investing.
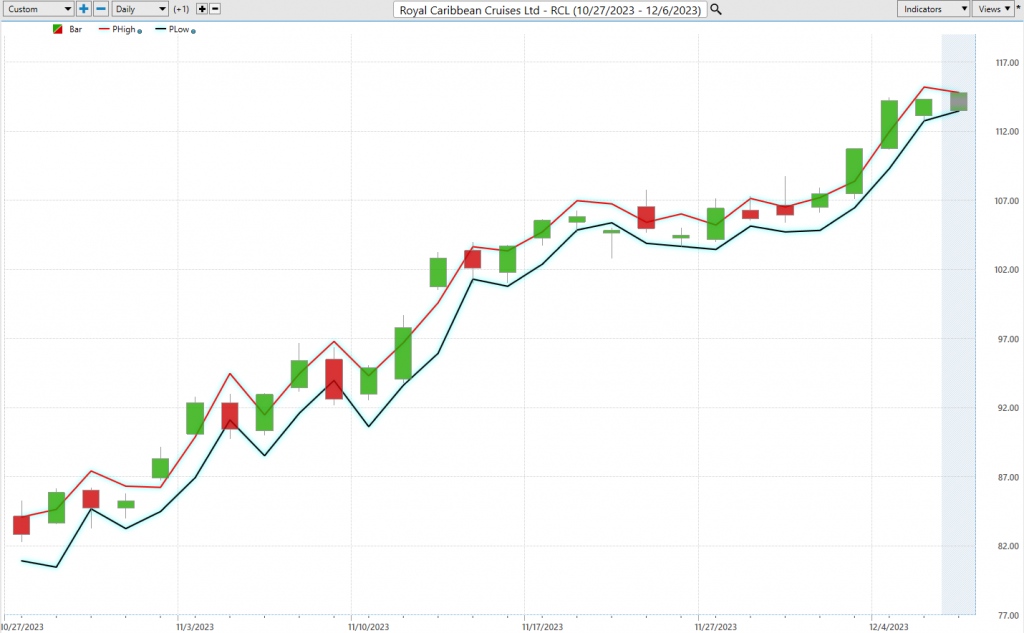
WT Finance Institute A.I. Predictive Blue Line Forecast
On the following chart, you will see the power of the WT Finance Institute Predictive blue line which determines the medium-term trend price forecast.
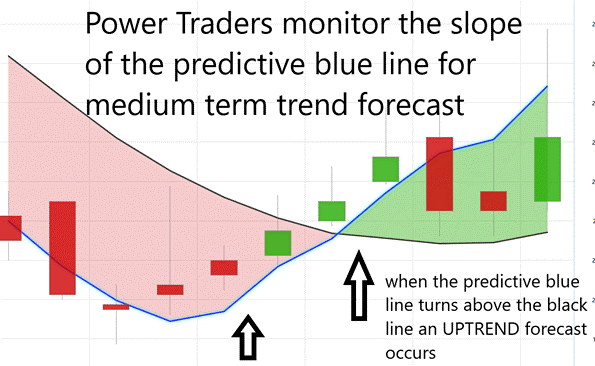
In the fast-paced, ever-evolving landscape of today’s market, traders are in perpetual search of the most potent tools and strategies to navigate this intricate financial terrain. Introducing WT Finance Institute Software, a pioneer in the domain of artificial intelligence, delivering traders a distinctive and precision-focused lens into the realm of risk and reward analysis. At its core lies the predictive blue line, an innovation that serves as a guiding star in forecasting market trends.
Visualize this predictive blue line as your financial beacon, its trajectory a steadfast indicator of market direction. When it ascends, it signals a market on the rise, ushering in opportunities for astute buying. Conversely, a descending slope hints at a market downturn, suggesting potential selling opportunities.
Yet, there’s a deeper layer to this narrative. The predictive blue line also illuminates the ‘value zone’ – a strategic sweet spot for traders. During an upward trajectory, this zone, nestled just below the blue line, becomes the focus for savvy investors. It represents a pivotal convergence of price and intrinsic value, unveiling the genuine worth of an asset.
This predictive tool isn’t a mere shot in the dark; it’s the culmination of WT Finance Institute’s revolutionary AI technology, an exquisite fusion of neural networks, machine learning and intermarket analysis. This potent amalgamation delves deep, disassembling the fundamental price drivers of an asset, harnessing AI to unveil its core essence.
In tandem with the predictive blue line, we encounter the black line, akin to our market rearview mirror, tracing the 10-day moving average of prices. It furnishes context to the forward-looking insights of the blue line. The interplay between these lines is where the enchantment unfolds, offering traders a lucid perspective on market momentum and emerging prospects.
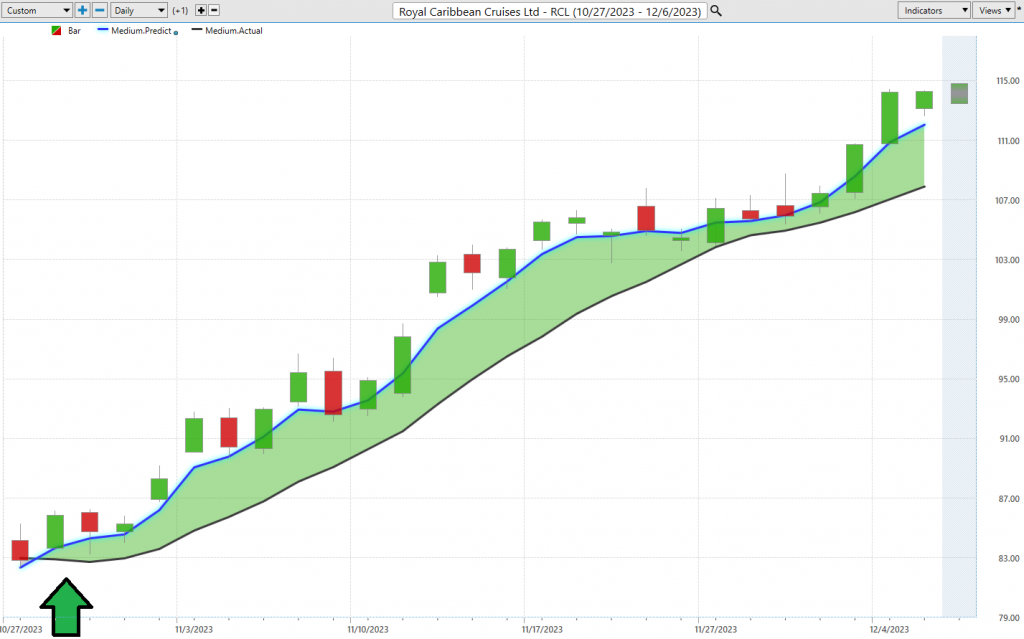
Here’s a pivotal insight for traders: when the predictive blue line surpasses the black line, envision it as the market’s green light, signaling an opportune entry point for an upward trajectory. This intersection, where price meets potential value, signifies an undervalued asset poised for ascent.
As you navigate the intricate terrain of the market, keep a watchful eye on the predictive blue line. Grasping its synergy with the black line can be your ticket to enlightened decision-making and prosperous trading. Stay vigilant, stay ahead, and allow WT Finance Institute Software to serve as your compass in the dynamic realm of trading.
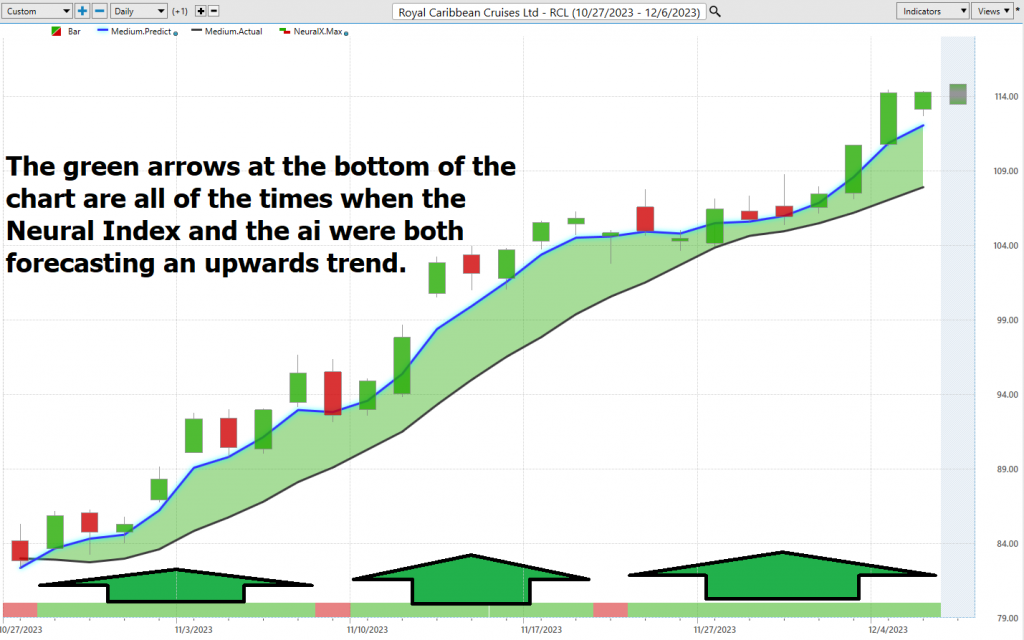
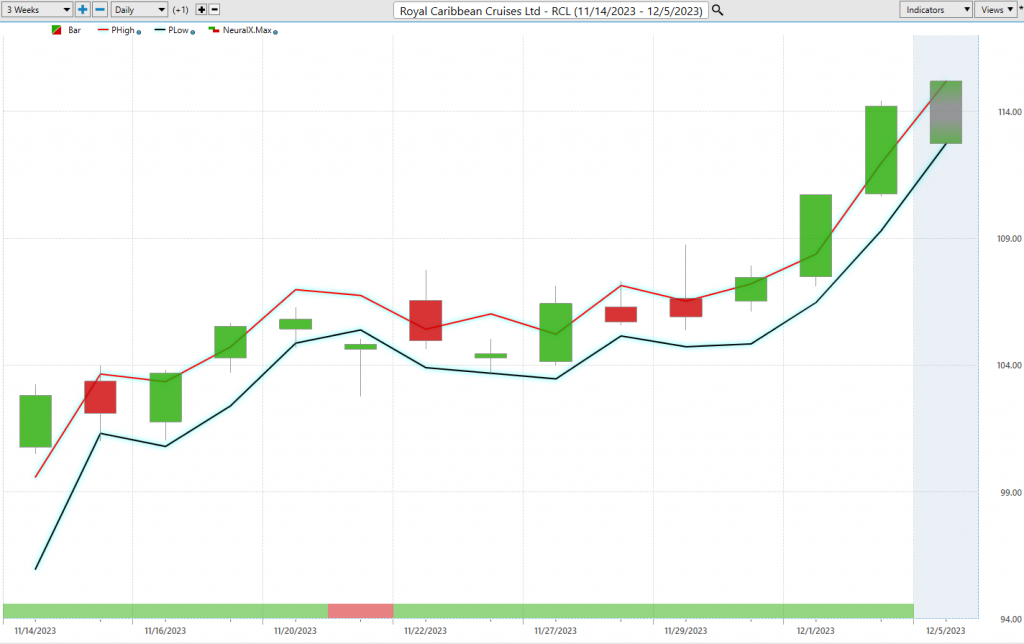
Neural Network Indicator (Machine Learning)
Right there, at the very bottom of this chart, we have what we call the Neural Network Indicator. This gem, my friends, is akin to possessing a market wizard for short-term market movements. When that Neural Net Indicator goes green, it shouts ‘strength.’ However, when it bathes in red, it’s sounding the alarm for short-term market fragility. And let’s not overlook the ‘yellow,’ which signals a period of sideways action.
Now, you’re probably itching to know the secret sauce behind this Neural Net Indicator, aren’t you? Well, allow me to unravel the mystery. It all boils down to neural networks – these digital virtuosos that are the rock stars of the trading world. They come equipped with an arsenal of sophisticated functions, sifting through colossal volumes of data to serve us traders with the insights we crave. It’s akin to having the sharpest financial minds at our disposal, and they’re continually evolving, always adapting.
These neural networks, inspired by the intricate workings of the human brain, have become the go-to tool for traders seeking an edge in the high-stakes arena of finance. So, let’s dive deep into the construction of these neural networks for trading. It’s all about deep learning, a process that involves feeding massive troves of financial data into these AI marvels. We then let them do what they do best: learn. They achieve this by adjusting the weights of their connections, akin to how our own brains adapt through experience. As these networks learn, they become virtuosos at identifying intricate patterns and making predictions regarding future price movements.
First and foremost, we’re talking about heightened accuracy . These neural networks dissect data in ways that even the keenest human minds can’t fathom. They unearth concealed gems within the data, and that can translate into significant gains.
But that’s not all. Automation is another priceless perk. Picture liberating traders from the mundane chore of making every trading decision. Neural networks can shoulder much of that burden, permitting traders to concentrate on more critical aspects of their craft, such as research and analysis.
In sum, neural networks are the trader’s trusted companions, a high-tech ally that sharpens decision-making processes and paves the way for more profitable trades. It’s a brave new world, my friends, and these neural networks stand at the forefront of it all. The future of trading has arrived, and it’s coded in neural brilliance.
Now, here’s the golden rule for all you traders out there: confirmation reigns supreme. The true pros, the Power Traders, cross-check that predictive blue line with our trusty Neural Network Indicator. When both align in harmony, it’s as clear as day. But when they sing a cautious tune in unison, it’s time to take a step back and reassess your strategy.
For you Power Traders, the combination of the Neural Network and A.I. forecasts is akin to striking gold. When they converge, it’s time to seize the moment. But when they diverge, proceed with caution. Remember, in trading, double confirmation is the name of the game.
So, here’s my counsel to all you Power Traders: harness the full potential of this tool. Cross-reference that chart with the predictive blue line and the Neural Network Indicator to pinpoint your entry and exit points. For the serious traders among us, these neural networks are the next-gen wizardry that uncovers those concealed patterns and interdependencies that evade others.
And here’s the crux, traders, as it’s of paramount importance. Keep a vigilant eye on that Neural Net, whether it’s for LONG or SHORT positions. It’s as straightforward as this: when the A.I. forecast and the Neural Net both glow green, it’s time to dive in and seek potential profits. Power Traders are always on the lookout for those sweet spots where both the Neural Network and A.I. agree – that’s where you’ll find statistically robust trading strategies.
Daily Range Forecast & Analysis
For traders, the WT Finance Institute Daily Price Range forecast stands as a financial guiding star, an unwavering beacon steering them through the often-tumultuous waters of market price movements.
Now, let’s delve into the realm of trading range metrics for the tech giant Royal Caribbean, examining the daily, weekly, and monthly intervals to unearth insights that inform their trading decisions.
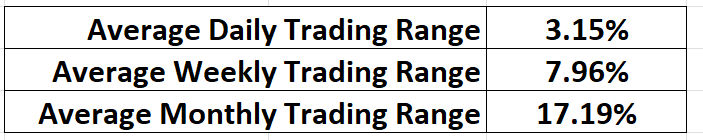
While this data is valuable, often it is ancient history as it represents everything that has occurred in the past. Every trader grapples with the daily puzzle of pinpointing those precise moments to make their market moves. It’s a formidable challenge, yet with WT Finance Institute’s formidable A.I. and the Daily Price Range Forecast, it’s akin to having a market sage softly whispering invaluable counsel in their ears.
Picture having a subtle nudge, a gentle prod, that foresees the market’s next move. By seizing opportunities at the lower end of the forecast and crafting exit strategies at their peak, traders can potentially tilt the odds in their favor while maintaining a firm grasp on risk management.
However, there’s a pivotal consideration here: the daily valuation of the stock market isn’t solely shaped by corporate maneuvers or financial disclosures. A multitude of factors, from a fleeting tweet to global events, can sway the balance. Thus, predicting market movements is a nuanced art. Yet, WT Finance Institute A.I. has carved a unique niche, harmoniously blending A.I., neural brilliance, and machine learning in the relentless quest for that elusive perfect prediction.
The core of successful trading revolves around identifying ideal entry and exit points in the market. WT Finance Institute doesn’t just aid in locating those pivotal moments; it accomplishes this with remarkable precision. The Daily Range forecast receives daily updates, providing a glimpse into potential price trajectories. It’s akin to having a seasoned market sage sharing time-tested insights.
Now, cast your eyes upon that chart. It’s more than aesthetically pleasing curves; it’s a roadmap for strategic stop placements and risk management. Note how seldom prices dip below that prominent dark line. It’s a clear indicator, pointing to the optimal zone for buy stop placements, ensuring that risks remain finely calibrated.
While $RCL presents a multitude of opportunities, it’s imperative for traders to grasp how to harness its volatility, for in the world of trading, knowledge indeed holds the key to power.
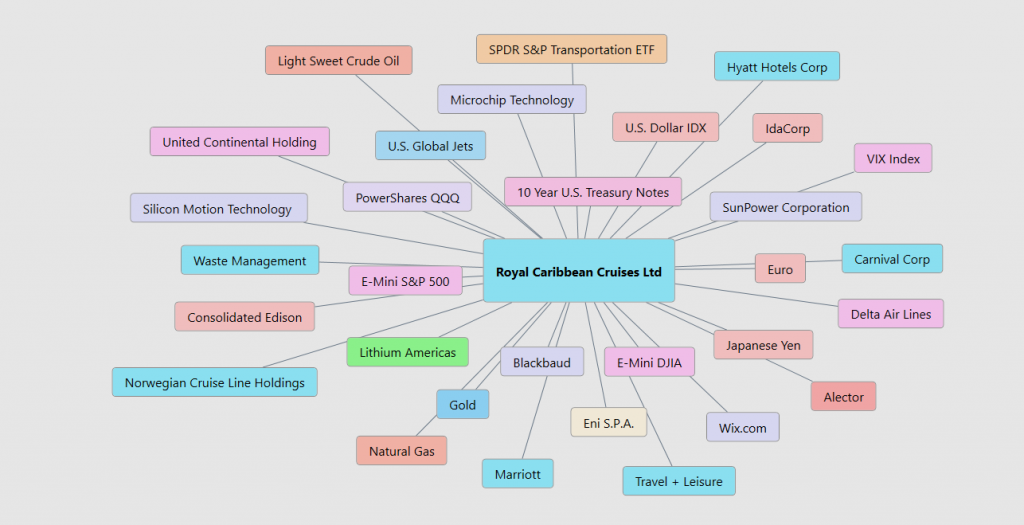
Intermarket Analysis
Intermarket analysis is the art and science of connecting the dots in the world of finance. It’s like being a detective, but instead of solving crimes, we’re uncovering hidden relationships between different markets and asset classes. You see, in this complex financial ecosystem, everything is interconnected. What happens in one market can have a ripple effect on another. Intermarket analysis helps us understand these connections and use them to our advantage in making investment decisions. So, think of it as the Sherlock Holmes of the financial world, piecing together clues from various markets to solve the mystery of where the money is flowing.
Intermarket analysis is all about seeing the bigger picture. It’s like looking at a puzzle, where each piece represents a different market or asset class. By analyzing how these pieces fit together, we can get a clearer picture of the overall market trends and where opportunities may lie. It’s about recognizing that the bond market, the stock market, the currency market, and commodities are all interconnected, and they can provide valuable insights into each other’s movements. Think of Intermarket analysis as your financial GPS, helping you navigate the markets with a better understanding of where you’re headed.
Intermarket analysis, my fellow traders, is the cornerstone of a holistic approach to market analysis. It’s about recognizing that the financial markets are not isolated islands but rather interconnected ecosystems. Intermarket analysis allows us to discern the subtle relationships and correlations between these markets, providing valuable insights into potential trends and opportunities. It’s the art of seeing the big picture and using that perspective to make more informed trading decisions, ultimately helping you stay one step ahead in the ever-evolving world of finance.
Consider this analogy: just as the fall of one domino sets off a chain reaction, intermarket analysis allows us to anticipate the domino effect in financial markets. It grants us the ability to grasp the broader canvas, understanding how shifts in one market can reverberate across others and how global developments cast shadows over our investments.
Now study the following graphic of the 31 primary drivers of $RCL.
Our Suggestion
Let’s talk about why Royal Caribbean ($RCL) should be front and center on your trading radar for the upcoming year. As I often emphasize, focusing on winners is the key to tipping the scales overwhelmingly in your favor , especially when you adopt a long-term perspective and employ prudent money management strategies.
In the fast-paced world of trading, market selection stands as your secret sauce for achieving success. It’s the game-changing factor that distinguishes the pros from the amateurs in this dynamic arena. The ultimate secret to consistent profits boils down to a single critical element: choosing the right market to concentrate your efforts on.
But why, you may wonder, is market selection such a pivotal aspect? Well, my friends, it’s all about taming the enigmatic beast known as volatility – that double-edged sword of trading. Volatility can sway both ways, serving up tantalizing profits one moment and financial headaches the next. Novices often fall prey to their whims and emerge disheartened. However, the pros, they cherry-pick markets that complement their style and risk appetite, turning volatility from a source of dread into a catalyst for growth.
Now, speaking of Royal Caribbean ($RCL), let me tell you, it’s a veritable treasure trove of trading prospects for the upcoming year. Why, you ask? Well, a stock that consistently achieves 52-week highs is undeniably doing something right. This isn’t a matter of opinion; it’s the market’s resounding declaration that $RCL is indeed a WINNER.
Trading winners is the name of the game, and $RCL seems to be signaling its success loud and clear.
Volatility, as we all know, is a force to be reckoned with. But here’s the thing, when you select markets that align with your style, volatility becomes your ally, not your foe. It’s about turning market dynamics into your favor and navigating the turbulence with finesse.
So, as we set our sights on Royal Caribbean ($RCL), it’s clear that this stock is on an upward trajectory. Those 52-week highs aren’t a fluke; they’re a testament to its winning streak. $RCL is within 20% of its 10-year highs, which is the next target for the bulls. But remember, trading success isn’t just about picking the right market; it’s also about disciplined money management. So, keep your eyes on the A.I. trend analysis, and always practice smart risk management in your trades.
We will re-evaluate daily based upon:
- New Wall Street Analysts’ Estimates
- New 52-week high and low boundaries
- WT Finance Institute A.I. Forecast (Predictive Blue Line)
- Neural Network Forecast
- Daily Range Forecast
The trend in $RCL is UP. We will look to the bottom of the daily range forecast to find opportunities to position ourselves LONG with tight stops for short-term trades.
Let’s Be Careful Out There!
It’s Not Magic.
It’s Machine Learning.
Disclaimer: THERE IS A HIGH DEGREE OF RISK INVOLVED IN TRADING. IT IS NOT PRUDENT OR ADVISABLE TO MAKE TRADING DECISIONS THAT ARE BEYOND YOUR FINANCIAL MEANS OR INVOLVE TRADING CAPITAL THAT YOU ARE NOT WILLING AND CAPABLE OF LOSING.
WT Finance Institute’S MARKETING CAMPAIGNS, OF ANY KIND, DO NOT CONSTITUTE TRADING ADVICE OR AN ENDORSEMENT OR RECOMMENDATION BY AI Wealth Creation 4.0 OR ANY ASSOCIATED AFFILIATES OF ANY TRADING METHODS, PROGRAMS, SYSTEMS OR ROUTINES. WT Finance Institute’S PERSONNEL ARE NOT LICENSED BROKERS OR ADVISORS AND DO NOT OFFER TRADING ADVICE.