| This week’s a.i. Stock Spotlight is Garmin ($GRMN) |

Garmin Ltd. ($GRMN) stands as a notable leader in the realm of global technology, particularly within the sectors of GPS navigation and wearable technology. Founded by Gary Burrell and Min Kao in 1989, Garmin has etched its name in the annals of tech innovation, primarily through its GPS devices tailored for automotive, aviation, marine, outdoor, and sports activities. The company’s journey from inception to becoming a cornerstone in GPS technology mirrors the ingenuity and foresight of its founders.
Garmin generates its revenue through a diversified portfolio spread across several profit centers, essentially segmented into five main categories: automotive, aviation, marine, outdoor, and fitness. Each of these segments caters to specific market needs, from navigation systems for cars and boats to wearable devices that monitor health and activity levels.
The company is headquartered in Schaffhausen, Switzerland, with operational headquarters located in Olathe, Kansas, and employs 16,000 people worldwide. This global footprint has allowed Garmin to maintain a strong presence in key markets around the world, leveraging local expertise while steering innovation from its central hubs.
Since its founding, Garmin has demonstrated an exceptional knack for innovation and market adaptation. The company became profitable shortly after its inception, a rare feat in the technology sector, underscoring its founders’ strategic vision and the universal appeal of its product offerings. Financially, Garmin has maintained a robust balance sheet with minimal debt, a reflection of its prudent financial management and strong cash flow generation capabilities.
Garmin’s main competitors include tech giants like Apple, Fitbit, and TomTom, among others. These companies vie for market share in the GPS and wearable tech spaces, pushing the bounds of innovation and consumer engagement. Despite the fierce competition, Garmin has managed to carve out a unique niche for itself, particularly among outdoor enthusiasts and professional athletes who value precision, reliability, and durability in their devices.
The biggest opportunity for Garmin lies in the expanding wearable technology market, where health, fitness, and outdoor activities continue to gain popularity. The integration of smart features and health monitoring capabilities in wearable devices presents a lucrative growth avenue. Conversely, the primary risk stems from the rapid pace of technological advancement and competition. Staying ahead in innovation, protecting intellectual property, and responding to consumer preferences are paramount challenges.
Over the past decade, Garmin has strategically acquired several companies to bolster its product lineup and technological capabilities. These acquisitions have enabled Garmin to expand its reach into new markets and enhance its product offerings, from fitness trackers to advanced navigation systems.
Garmin operates specifically within the scientific and technical instruments industry and is known for its innovative products in GPS technology and wearable devices. Achieving consistent sales growth in the technology hardware sector presents a significant challenge due to intense competition and rapidly evolving consumer preferences, factors that contribute to the frequent shifts in brand popularity. Garmin, however, has proven its capability to navigate these hurdles successfully.
In 2023, Garmin reported revenue of $5.23 billion, marking a 7.57% increase from the previous year’s $4.86 billion. The company’s earnings saw a significant rise of 32.46% to $1.29 billion, showcasing strong financial health and profitability.
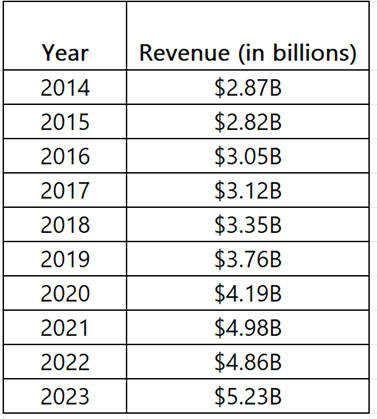
Garmin has shown remarkable resilience and growth, boosting revenue in nine out of the last ten years, with 2022 standing as the lone exception where revenue slightly dipped by 2%. This success story is a testament to Garmin’s diverse and innovative product range. Investing in Garmin means gaining exposure to a spectrum of tech niches, from consumer wearables to aviation navigation solutions, offering shareholders a safeguard against downturns in any single market segment. In 2023, three out of Garmin’s five operational sectors achieved their highest sales records.
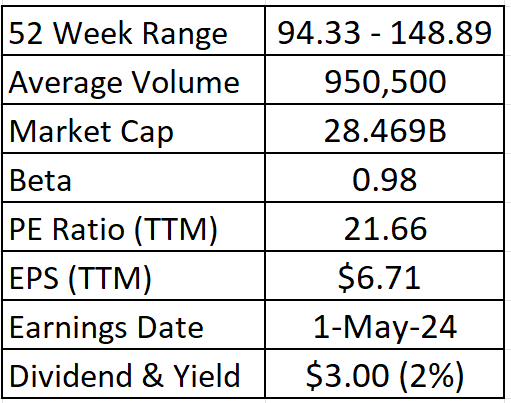
Garmin’s shares have experienced noteworthy growth, reaching a new 52-week high of $148.89 as of March 2024. This indicates a 54.7% price increase in share price over the last 52 weeks, reflecting investor confidence and the company’s robust market position. The company’s Price-to-Earnings (P/E) ratio stands at 21.66, with an earnings per share (EPS) of $6.71, suggesting a valuation that factors in its growth prospects and profitability.
Garmin also maintains an attractive dividend yield, with an annual dividend of $3.00 per share, translating to a 2.00% yield, which is appealing for income-focused investors.
Garmin has been proactive in expanding its product portfolio and entering new markets, evident from its recent announcements and collaborations. These initiatives are likely to support future revenue streams and strengthen its position in the competitive technology sector. The company’s ability to innovate and adapt to changing market demands, coupled with its strong financial performance, underpins its potential for sustained growth. In the third quarter, the company reported significant growth in its fitness segment, driven by strong demand for wearables, and introduced new products such as the Venu® 3 smartwatch and the vívoactive® 5. The outdoor segment saw growth led by adventure watches, while the aviation segment grew due to OEM product categories. However, the marine segment experienced a slight decline in revenue.
In summary, Garmin exhibits solid financial health with promising revenue and earnings growth. Its strategic initiatives point towards an ongoing commitment to innovation and market expansion.
Wall Street analysts have historically viewed Garmin as a resilient and innovative company, often praising its ability to navigate market shifts and maintain profitability. As a leader in the GPS and wearable tech niches, Garmin has consistently outpaced many of its competitors, attributed to its strong brand, diverse product range, and commitment to quality.
Analyzing Garmin’s revenue and earnings over the last ten years reveals a trajectory of consistent growth and stability, underscoring the company’s adaptability and strategic acumen in a dynamic market. Significant investments in R&D, a keen focus on customer needs, and strategic acquisitions have been pivotal in driving this growth.
In conclusion, Garmin represents a fascinating study in sustained innovation, strategic growth, and financial acumen. From its origins as a pioneer in GPS technology to its status as a diversified tech conglomerate, Garmin has navigated the complexities of the global market with remarkable finesse. As it continues to explore new frontiers in wearable technology and beyond, Garmin’s journey is a testament to the enduring power of vision, adaptability, and relentless pursuit of excellence.
In this stock study we will look at the following metrics and indicators.
Wall Street Analysts’ Estimates
52-week high and low boundaries
A.I. Predictive Blue Line
The Best Case – Worst Case Scenarios
Neural Network Forecast
Daily Range Forecast
Intermarket Analysis
Our Trading Suggestion
We don’t base decisions on things like earnings or fundamental cash flow valuations. However, we do look at them to better understand the financial landscape that a company is operating under.
Wall Street Analysts’ Estimates
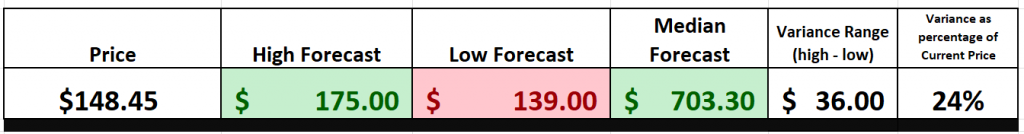
Based on 7 Wall Street analysts offering 12-month price targets for GARMIN in the last 3 months, the average price target is $148.50 with a high forecast of $175.00 and a low forecast of $139.00.
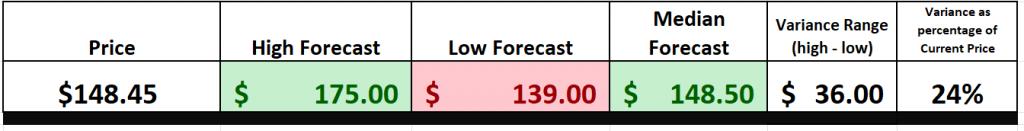
We typically like to look at the variance between the most bullish and bearish forecasts and use that as a gauge for future expected volatility. Currently this variance is 24% or $36 which is considered moderate in comparison to other high performing stocks.
We find this variance valuable as often rallies and declines are confined to this level of volatility.
52-Week High and Low Boundaries
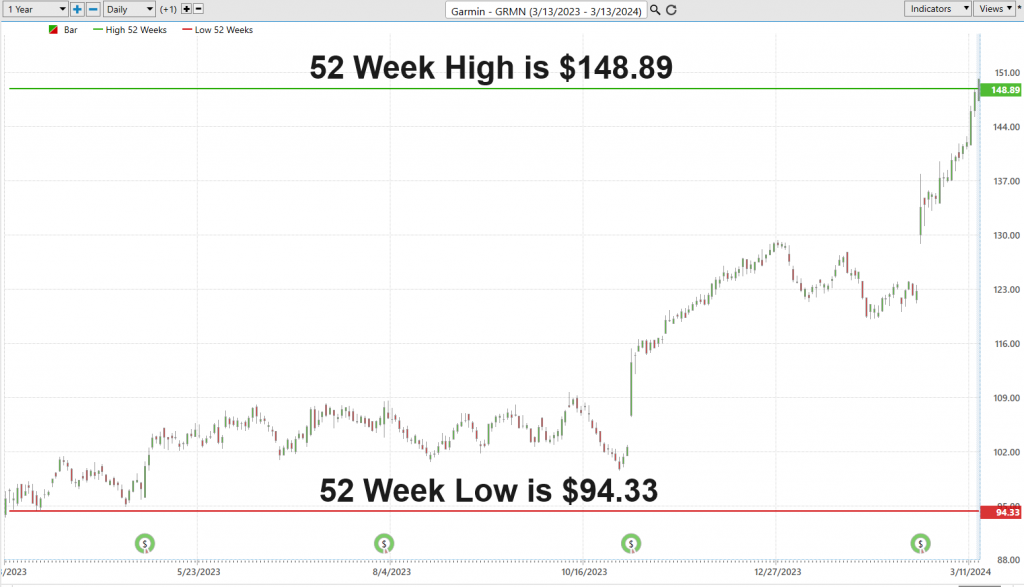
Over the past 52 weeks $GRMN has traded as high as $148.89 and as low as $94.33.
The annual trading range was $54.56. These numbers provide us with an accurate perspective of historic volatility which we can calculate by comparing the annual trading range to the current price. Over the last 52 weeks the historic volatility was 37%, which is moderate. This value tells us that based upon the recent past it would be perfectly normal to expect prices to trade in a 37% trading range over the following 52 weeks.
Equally of importance is the fact that $GRMN is trading at its 99th percentile of the last 52 weeks.
The 52-week boundaries of a stock—its highest and lowest price over the past year—are like our navigational stars. They’re crucial for spotting trends and making smart decisions about where to invest and trade. These boundaries give us a glimpse into a stock’s stability and potential. Highs might signal strength or overvaluation, while lows could indicate a bargain or trouble ahead. By analyzing these extremes, traders choose their markets wisely, seeking the best opportunities while managing risk. It’s about reading the market’s map, identifying where the opportunity lies.
Now, think of the stock market as a season of your favorite TV series, full of ups and downs, twists, and turns. The 52-week boundaries help us understand the plot so far – showing us how high and low the stock can go under current conditions. This is like having a preview of potential future episodes, giving savvy investors clues about whether the next season might hit new highs or drop to unforeseen lows. By studying these trends, traders can make educated decisions about the stock’s next moves, deciding whether to ride the wave or wait for a better entry point.
Is the stock you are studying moving with the broader market? Or is it moving counter to the prevailing market trend? It is outperforming or underperforming the market? These questions are of paramount importance when we begin a trend analysis of any stock we are looking to trade or invest in.
Moreover, these boundaries influence the psychological mindset of traders and investors alike. A stock nearing its 52-week high might be seen as a winner, gaining momentum, and attracting more interest. Conversely, one nearing its low could be viewed as undervalued, ripe for a comeback, or as a warning to steer clear. By analyzing these extremes, traders select markets not just based on numerical analysis but also on market sentiment and investor behavior. This dual approach, combining hard data with psychological insight, empowers traders to make more nuanced and informed decisions in the ever-changing seas of the stock market.
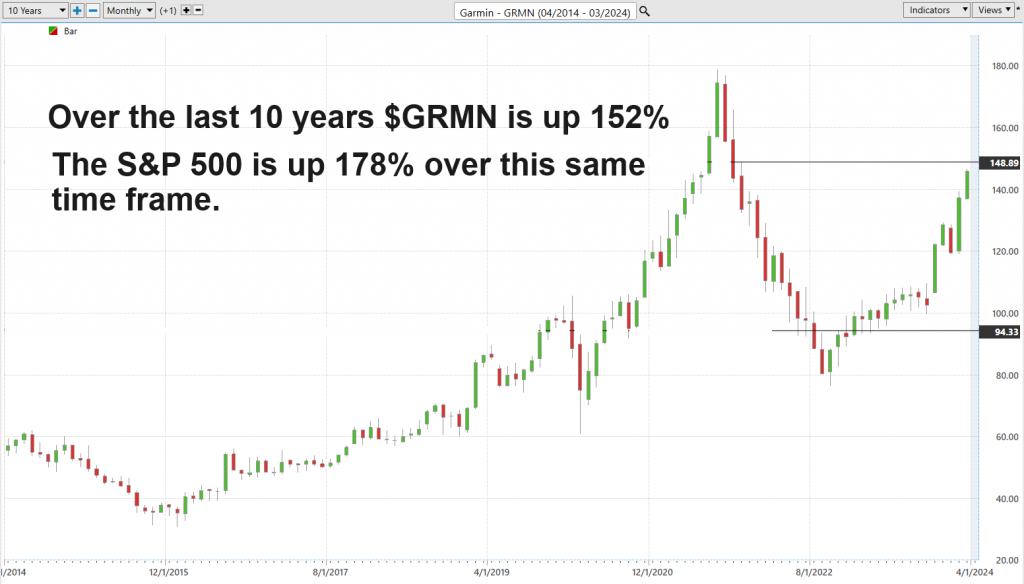
When we zoom out further, we can see on the 10-year chart that $GRMN is up 152% which is less than the S&P 500 Index which is UP 178% over the same time frame.
Best Case – Worst Case Scenario
Before entering a trade, it’s essential to thoroughly understand the risks involved. This understanding can be achieved by analyzing the magnitude of past rallies and declines within the year, offering insights into potential best and worst-case scenarios. This analysis allows traders to gauge the stock’s volatility and prepare for possible outcomes, ensuring decisions are made with a clear understanding of the risk/reward ratio. By comparing these extremes, investors can determine if the potential return justifies the risk, enabling them to enter trades with their eyes wide open and expectations grounded in reality.
Further refining this approach involves examining external factors that could influence the stock’s performance, such as market trends, economic indicators, and company-specific news. This comprehensive analysis helps in identifying not just historical patterns but also potential future triggers for price movements. Engaging in this level of detailed review ensures that traders are not caught off guard by sudden market shifts, allowing for more strategic decision-making.
Ultimately, this best case and worst-case analysis forms the backbone of risk management in trading. It encourages a disciplined approach to investing, where decisions are based on thorough research and a balanced assessment of potential outcomes. This methodology does not guarantee success in every trade but significantly enhances the ability to navigate the market’s inherent uncertainties with confidence and strategic foresight, aiming for long-term investment growth while minimizing exposure to undue risk.
This exercise transcends mere market analysis; it’s an exploration into common sense, uncovering the raw essence of risk and reward that pulsates through the veins of the stock market.
This pragmatic approach demystifies analysis by quickly allowing you to see the best case and worst-case scenarios.
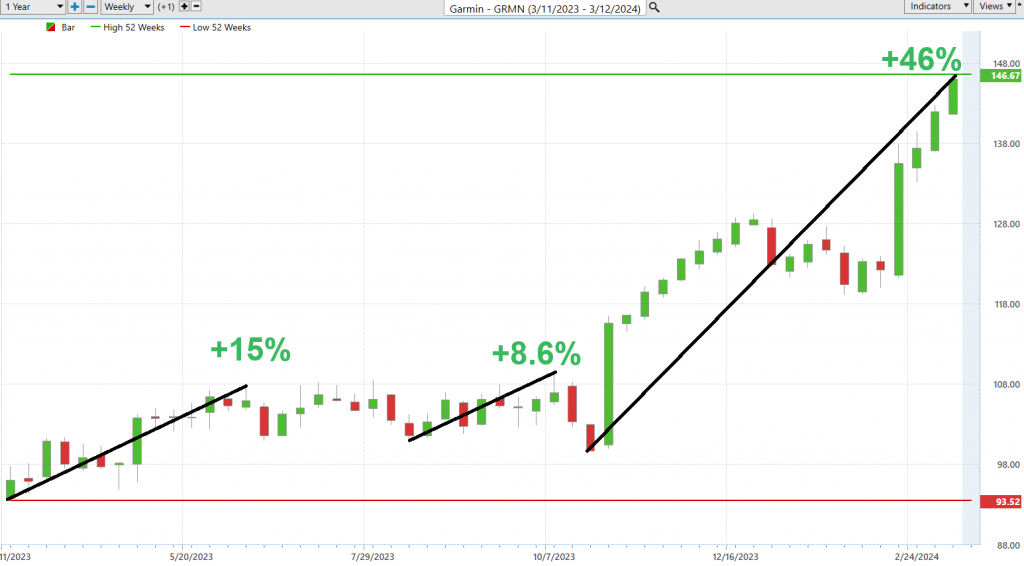
First, we perform the best-case analysis:
Followed by the worst-case analysis:
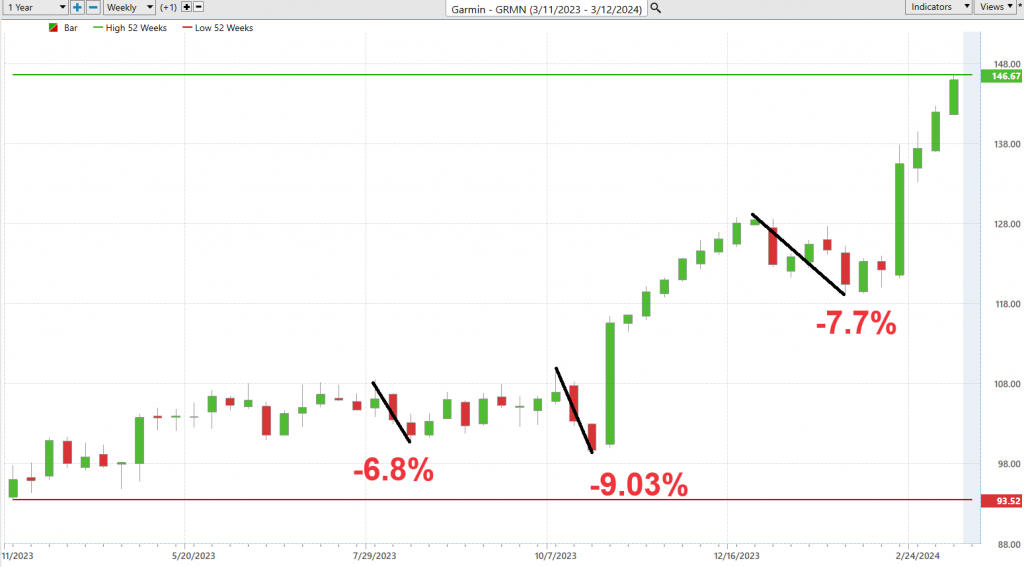
The simple conclusion we can draw from this exercise is that the bulls are clearly in control and that over the past 52 weeks declines have been very meager in comparison to the rallies.
The spotlight then shifts to volatility, measured through the lens of Beta—a metric that quantifies a stock’s volatility in relation to the overall market. With a Beta of .98, GARMIN ($GRMN) emerges as being 2% less volatile than the broader market.
Delving into Beta reveals its layers: a Beta of 1 mirrors market movements; above 1 suggests more volatility, offering a roller-coaster experience; below 1 indicates a smoother, less market-sensitive path. Analyzing $GRMN through this lens, we uncover a performer that has elevated its revenue, earnings, and stock value with slightly less market volatility than the broader market.
Beta, our trusted “risk-o-meter,” helps shape a portfolio that matches our risk appetite and financial goals. This knowledge empowers informed decision-making in portfolio management, making understanding Beta essential for navigating the market’s ebbs and flows.
Next, we compare the performance of $GRMN against all of the major stock indexes across multiple time frames to judge performance and better understand risk.
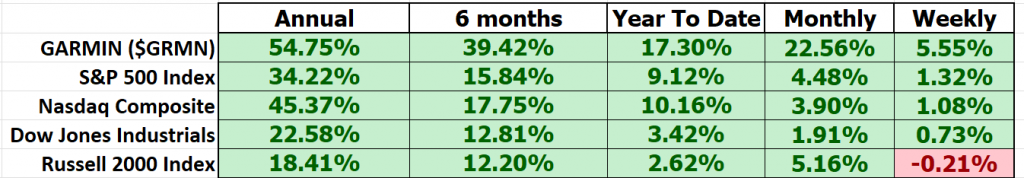
Clearly, $GRMN has outperformed across all major time frames.
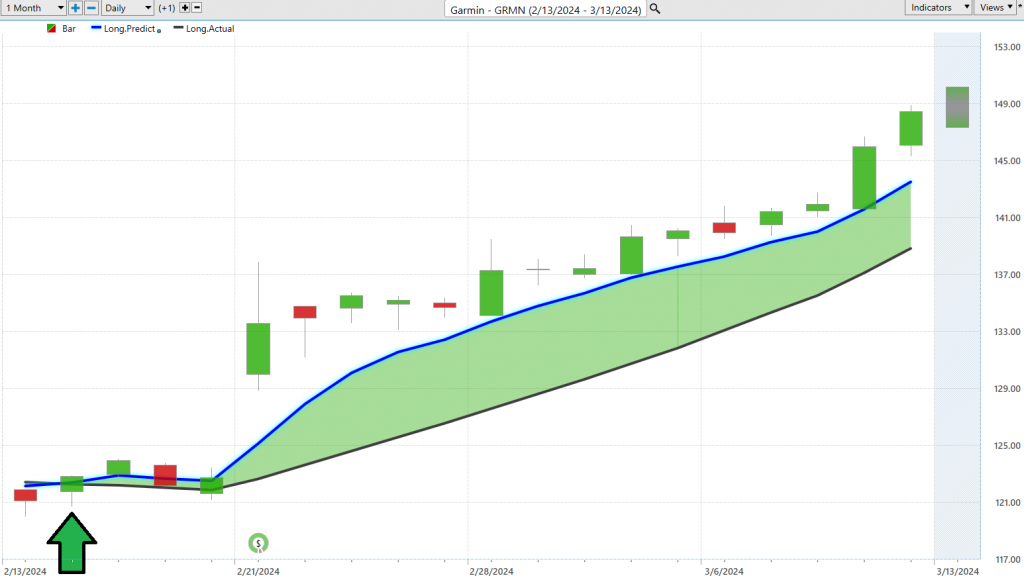
A.I. Predictive Blue Line Forecast .
Our guiding principles are as follows:
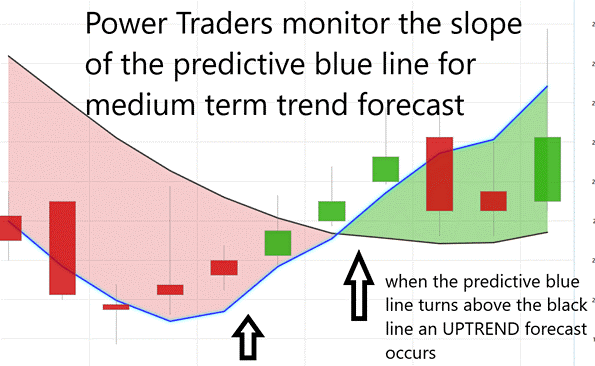
– The trajectory of the predictive blue line dictates the trend forecast and overall trajectory of $GRMN.
– Ideally, the VALUE ZONE is determined to seek buying opportunities at or below the predictive blue line or selling opportunities above it during a downtrend.
– Naturally, as the predictive blue line slopes downward, traders anticipate lower prices, either retreating to the sidelines or hedging their positions.
In the ever-evolving world of trading, the search for innovative tools remains constant. Enter Software, a standout in the fintech landscape, leveraging artificial intelligence to forecast market trends. It introduces the “A.I. predictive blue line,” akin to a financial North Star, guiding traders with insights on market directions and identifying the ‘value zone’ for optimal trading decisions. This technological marvel, powered by neural networks and intermarket analysis, delves deep into price determinants, unveiling the intrinsic worth of assets and shaping strategic trading moves.
The essence of ’s predictive blue line transcends mere market direction, guiding traders towards the ‘value zone,’ a pivotal area in an uptrend signaling a stock’s true worth. This is no mere speculation but a result of sophisticated A.I., blending neural networks with intermarket analysis to uncover intrinsic values.
Furthermore, the black line, reflecting the 10-day simple moving average, offers historical context of what prices have done in the recent past, enriching the predictive insights of the blue line. The synergy between these lines, blending past and future, crystallizes opportunities for traders, a testament to ’s innovative fusion of neural network prowess and market analysis for those navigating the financial markets’ velocity.
In essence, one glance at the chart unveils the forecast of artificial intelligence.
Neural Network Indicator (Machine Learning)
A neural network for traders is a form of artificial intelligence that mimics the human brain’s ability to recognize patterns and make predictions. It’s constructed by layering nodes (neurons) in interconnected networks, where each layer processes inputs and passes them to the next, refining predictions at each step. These networks are developed using vast datasets, teaching them to recognize market patterns and trends. Traders and financial analysts use them to analyze market data, improving decision-making by forecasting market movements, identifying trading opportunities, and managing risks more effectively.
But Power Traders don’t put all their eggs in one basket. No, they’re strategists, combining the insights of the Neural Network Indicator with other tools like the Predictive Blue Line. It’s this blend of technology and strategy that elevates their trading game.
In the high-octane world of trading, where every second counts, traders, especially those new to the game, are always scouting for that game-changer. Enter the neural network, a tool not just of the future, but of now, offering a peek into the market’s mind. These digital brains feast on data, learning, evolving, and getting sharper with each trade. They’re the secret weapon for traders, minimizing errors, and spotting patterns that are invisible to the naked eye, keeping them one step ahead. It’s not just about data analysis; it’s about making that analysis work tirelessly for you, ensuring that when the market moves, you’re moving first, armed with insights that are as precise as they are profitable. This blend of technology and strategy? That’s the trader’s new best friend.
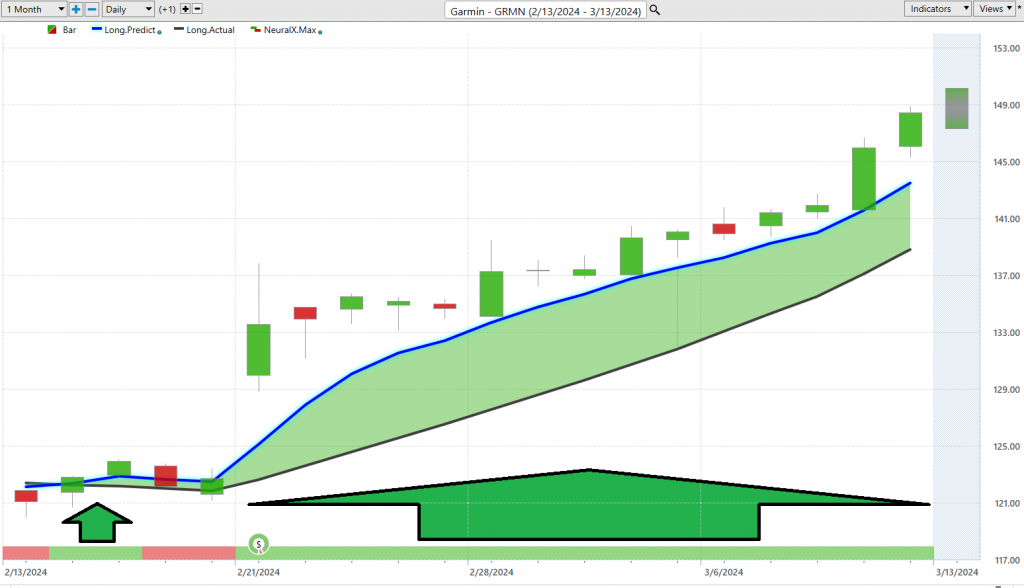
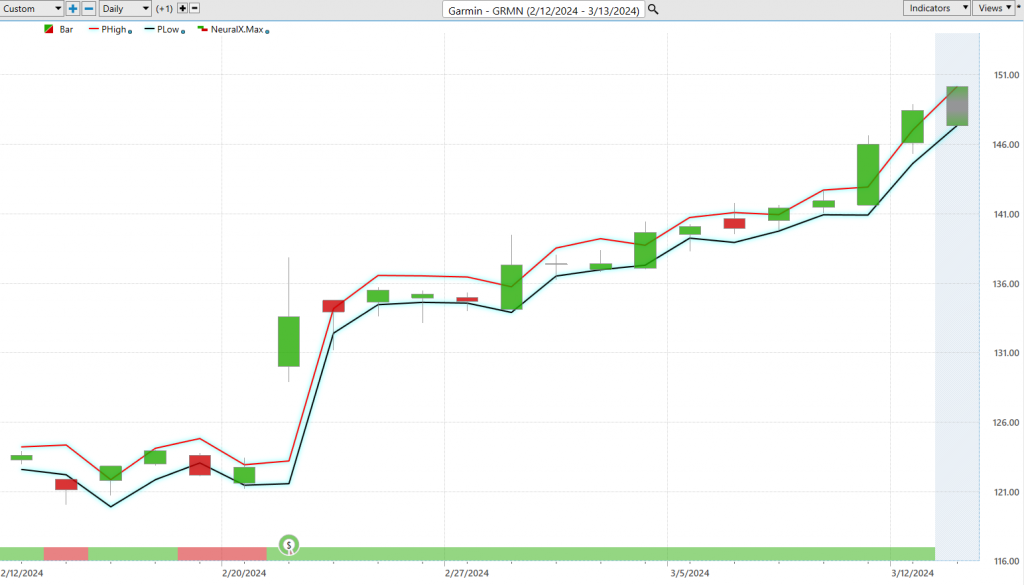
The arrows on the chart above are all the times when the Neural Index and the Predictive Blue Line were both pointing in the same direction. We refer to this as the “double confirmation setup” which is a very high probability trade.
Earnings for $GRMN were released on February 21, 2024. The expectations were for $1.40 a share. They came in 22% better at $1.72 per share. The artificial intelligence and neural index both turned positive one week earlier on February 14th. Since the neural network and ai both turned positive $GRMN has rallied 21.29%.
This is how artificial intelligence keeps traders on the right side of the right trend at the right time.
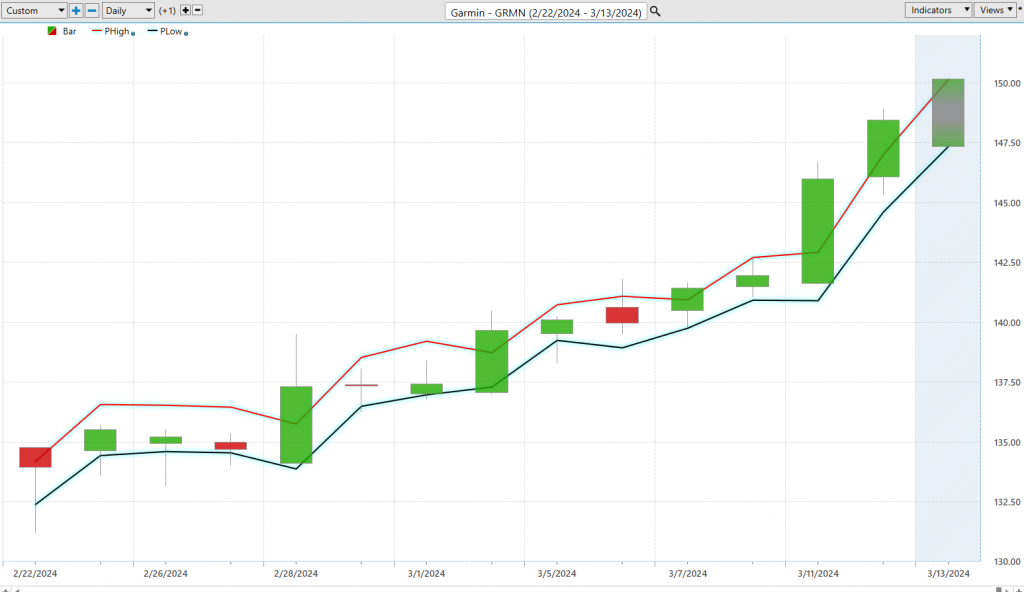
Software Daily Price Range Prediction
Finding the perfect moment to dive in and out of the market is a puzzle every short-term trader wrestles with. In this fast-paced arena, even a split second can separate a win from a loss. Imagine harnessing the power of AI, machine learning, and neural networks—our modern-day technological marvels. These tools sift through historical data, picking out patterns and predicting market moves with astonishing accuracy. For traders, this isn’t just data analysis; it’s a strategic edge, turning the unpredictable market tides into navigable waters, and setting the stage for informed, precise trading moves. It’s about making the unseen seen, turning risk into calculated strategy.
Consider, if you will, the average trading ranges—daily, weekly, monthly—over the past year.
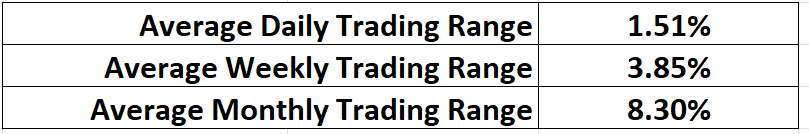
Yet, herein lies the challenge: mere knowledge of these ranges is not enough. How do you pinpoint the exact price levels to buy and sell?
Behold the Daily Range Forecast chart, crafted specifically for the short-term swing trader. This isn’t just another chart; it’s a guide illuminating the likely course of each trading day. With the integration of A.I., this tool surpasses traditional analysis, decoding the market’s rhythm. It serves as a trusted navigator for Power Traders, enabling them to navigate the market’s volatility with precision, identifying optimal entry and exit points with unparalleled clarity.
Intermarket Analysis
Intermarket analysis is a method used by traders to understand the relationships between different financial markets (like stocks, bonds, commodities, and currencies) and how they influence each other. This approach is important because it provides a comprehensive view of the global financial landscape, helping traders to identify trends, correlations, and potential trading opportunities across various asset classes. It improves trading results by allowing for more informed decision-making and better risk management through diversification and timing trades based on the interconnected dynamics of the markets. Typically, intermarket analysis is calculated using statistical methods to identify correlations and causations among different market indicators.
In a world where financial markets are intricately linked, grasping the complex web of relationships that drive market dynamics is crucial for trading success. Intermarket analysis stands out as an indispensable tool, offering a structured approach to decoding the intricate interactions among various asset classes. This analytical strategy reveals the correlations and dependencies across financial instruments, shedding light on broad market trends and unveiling potential trading opportunities. Its holistic perspective on market dynamics is key to forecasting trends across asset classes, thereby enabling traders to navigate the market landscape with enhanced insight and strategic acumen. Through the pioneering work of Louis Mendelsohn in integrating intermarket relationships into trading strategies, traders are empowered with a multifaceted analysis tool, significantly refining their trading approach.
Here are the 31 key drivers of $GRMN’s price.
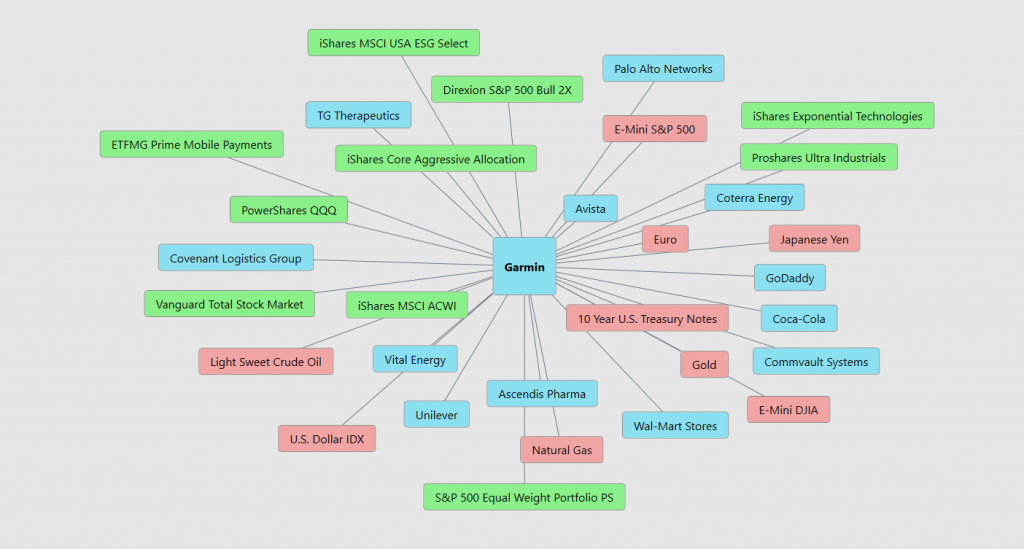
We advise traders to study these drivers as often hidden gems will be uncovered in parallel markets. Intermarket analysis is utilized by a broad range of market participants, including individual traders, financial analysts, portfolio managers, and institutional investors. These users apply intermarket analysis to enhance their understanding of market dynamics, improve their trading strategies, and manage risk more effectively by identifying correlations and predicting trends across different asset classes.
Our Suggestion
The next earnings call for $GRMN will occur on May 1, 2024. The majority of Wall Street analysts are optimistic based on recent revenue and earnings growth.
The company is no longer undervalued which requires that traders place even a greater attention on the artificial intelligence for daily trading guidance.
Here are the important metrics:
Garmin has declared a proposed dividend increase of 3% and the authorization of a $300 million share repurchase program by its board of directors, underpinned by the company’s robust cash flow. This financial maneuvering underscores Garmin’s strong financial health, allowing it to return value to shareholders while sustaining its operational and strategic objectives.
Technically speaking the stock has broken a new 52-week highs regularly over the past 4 weeks. For those who are already positioned this is the type of environment traders dream about where you sit back and enjoy the ride.
For traders looking to get in utilize the daily range forecast for guidance.
We continue to think that $GRMN will continue to offer great tremendous opportunities in the coming year. Pay close attention to the 52-week high for resistance and when it is consistently breached it will function as support.
$GRMN deserves to be on your trading radar.
Garmin’s growth in product sales across its divisions, coupled with the prospect of increased dividend payouts, positions the stock appealingly for both growth and income-oriented investors. This dual potential is a significant factor behind its impressive outperformance of the broader market.
We advise that you practice good money management on all of your trades and that you follow the A.I. forecast for your trend analysis to determine optimal entries and exits.
Let’s Be Careful Out There!
Remember, It’s Not Magic .
It’s Machine Learning.
Disclaimer: THERE IS A HIGH DEGREE OF RISK INVOLVED IN TRADING. IT IS NOT PRUDENT OR ADVISABLE TO MAKE TRADING DECISIONS THAT ARE BEYOND YOUR FINANCIAL MEANS OR INVOLVE TRADING CAPITAL THAT YOU ARE NOT WILLING AND CAPABLE OF LOSING.
WT Finance Institute’S MARKETING CAMPAIGNS, OF ANY KIND, DO NOT CONSTITUTE TRADING ADVICE OR AN ENDORSEMENT OR RECOMMENDATION BY AI Wealth Creation 4.0 OR ANY ASSOCIATED AFFILIATES OF ANY TRADING METHODS, PROGRAMS, SYSTEMS OR ROUTINES. WT Finance Institute’S PERSONNEL ARE NOT LICENSED BROKERS OR ADVISORS AND DO NOT OFFER TRADING ADVICE.