| This week’s a.i. stock spotlight is NVIDIA ($NVDA) |
Nvidia’s stock continues to move higher, influenced by news of Elon Musk’s xAI startup, which recently raised $6 billion. xAI plans to build a supercomputer with Nvidia’s GPUs, highlighting Nvidia’s ongoing AI-driven revenue growth.
All traders and investors are focused on knowing who the fastest horse in the race is. Without question, $NVDA has outperformed all stocks and continues to boast huge revenue and earnings growth.
The graphic below shows you the parabolic earnings and revenue growth that $NVDA is experiencing.
$NVDA posted revenue of $25.04 billion for the quarter. That was up 18% from the previous quarter and 262% higher year over year.
$NVDA also posted earnings of $6.12 per share. The Street was expecting $5.58.
What is incredible about $NVDA’s earnings and revenue growth is that the company is generating earnings that are 206% higher today than the entire REVENUE they generated in 2017! It’s truly remarkable. I am not aware of any other company that has ever seen a growth trajectory of this magnitude. Revenue in 6 years is up 527%!
Nvidia’s stock also benefits from a recent 10-for-1 stock split announcement and strong data center revenue. Despite its high valuation, Nvidia’s growth prospects in AI computing justify investor optimism. Additionally, Nvidia increased its dividend by 150%.
We are witnessing a masterclass in raising capital courtesy of Elon Musk, with Nvidia poised to reap significant benefits. Nvidia’s stock is soaring once again, and this isn’t just a random spike. No, Nvidia’s meteoric rise is being propelled by Musk’s xAI startup, which just secured a whopping $6 billion in fresh capital.
Now, why is this significant? Well, Nvidia has been riding high on the AI wave, monetizing its processors like never before. Their GPUs are in high demand among tech giants building AI models, and now xAI, Musk’s ambitious AI venture, is joining the fray. With plans to build a supercomputer potentially powered by tens of thousands of Nvidia chips, xAI is set to become a major player, further fueling Nvidia’s sales.
Nvidia’s success story doesn’t end there. The company recently announced a 10-for-1 stock split, reducing its $1,000 share price to $100 per share come June 10. This strategic move echoes their last split in 2021, which saw a 20% stock price surge in just two months. Nvidia’s trajectory is tempting conservative and aggressive traders with this announcement.
Let me give you three compelling reasons why investors and analysts are wildly bullish $NVDA.
1. **Data Center Revenue Growth**: Nvidia’s GPUs are at the heart of the AI revolution. The company reported a 427% year-over-year increase in its data center division for Q1 of fiscal 2025. Quarter-over-quarter, revenue rose 23%, underscoring the relentless demand for AI computing power.
2. **Valuation**: Despite its soaring success, Nvidia’s valuation remains attractive. Trading at 35 times forward earnings, it’s cheaper than Microsoft, yet growing faster. The transformation Nvidia is spearheading in the AI industry makes its stock valuation less of a concern to many analysts. For the fiscal year 2025, Nvidia is projected to achieve substantial growth. Analysts forecast Nvidia’s revenue to reach approximately $111.3 billion, significantly up from this year’s stunning performance. Earnings per share (EPS) are also expected to rise impressively, with estimates suggesting an EPS of around $22.21.
These projections reflect Nvidia’s continued dominance in the AI and data center markets, bolstered by ongoing demand for their advanced GPUs and AI technologies. Investors remain optimistic about Nvidia’s ability to sustain this growth trajectory, driven by innovations and strategic partnerships in the AI sector.
3. **Dividend Growth**: Nvidia’s recent earnings release also revealed a 150% increase in its dividend. Although still modest, this increase lays the groundwork for potentially larger future payouts.
In the words of CEO Jensen Huang, “The next industrial revolution has begun,” and Nvidia is right at the center of this seismic shift. $NVDA has positioned itself as the solution in the ai boom for the tech industry.
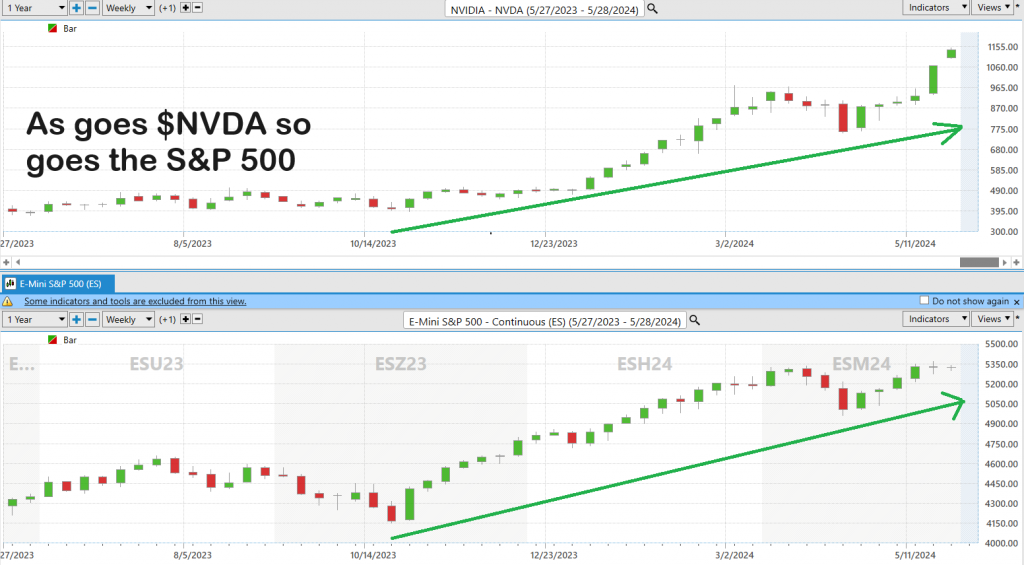
$NVDA isn’t just making waves; it’s setting the pace in the big leagues. First up, Nvidia is a top contender in the NASDAQ-100 Index, which spotlights the top 100 non-financial juggernauts on the NASDAQ exchange. Here, Nvidia flexes a solid 7% weighting. Next, we see it holding court in the prestigious S&P 500 Index, featuring America’s 500 corporate titans, where it commands a noteworthy 3.61% weighting.
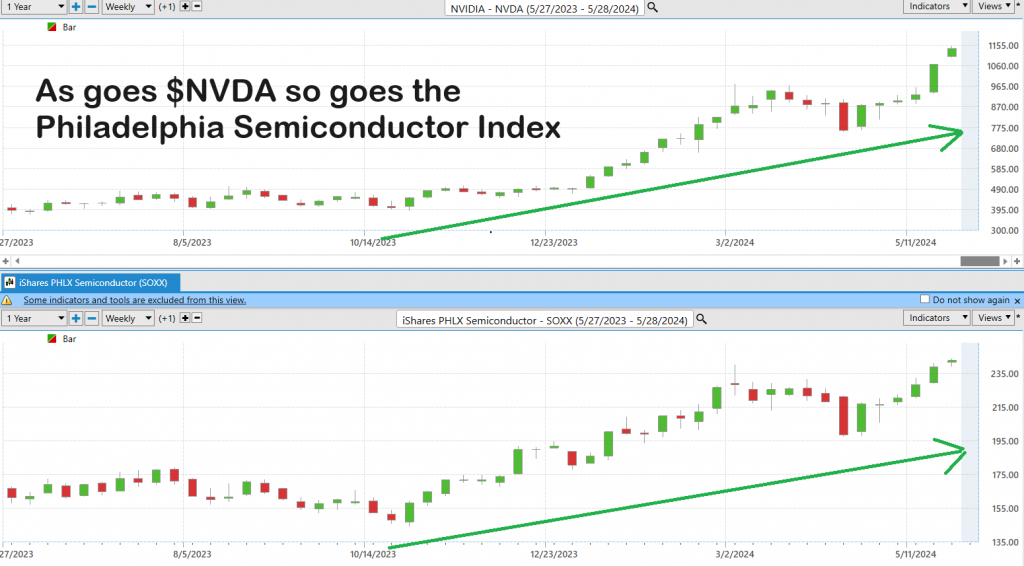
But the accolades don’t stop there. Nvidia stands tall in the PHLX Semiconductor Sector Index, the gold standard for evaluating semiconductor industry performance, boasting a mighty 7.54% weighting. These indexes aren’t just numbers—they’re the pulse of the market. And let me tell you, when Nvidia moves, the broader market often follows. This is a testament to its influence and pivotal role in shaping market dynamics.
Stay tuned, because as we delve deeper, you’ll see how Nvidia’s performance is not just a reflection of its own success, but a barometer for the tech sector and beyond.
In this stock study we will look at the following metrics and indicators.
- Wall Street Analysts’ Estimates
- 52-week high and low boundaries
- Vantagepoint A.I. Predictive Blue Line
- The Best Case – Worst Case Scenarios
- Neural Network Forecast
- Daily Range Forecast
- Intermarket Analysis
- Our trading suggestion
We don’t base decisions on things like earnings or fundamental cash flow valuations. However, we do look at them to better understand the financial landscape that a company is operating under.
Wall Street Analysts’ Estimates
Let’s break down what the analysts are projecting for Nvidia ($NVDA) over the next 12 months. According to the latest insights from the market mavens, the average price target for Nvidia is a staggering $1,179.72 . But that’s not all. On the high end, some analysts are betting big with estimates soaring to $1,400. On the flip side, the more conservative projections dip to around $870.
This spectrum of estimates underscores the robust confidence and anticipation surrounding Nvidia’s performance and potential. Whether you’re a seasoned investor or a market newcomer, these numbers highlight Nvidia as a formidable player with significant upside potential in the tech arena. Stay tuned, because Nvidia is not just in the game—it’s aiming to redefine it.
We find this variance valuable as often rallies and declines are confined to this level of volatility.
52-Week High and Low Boundaries
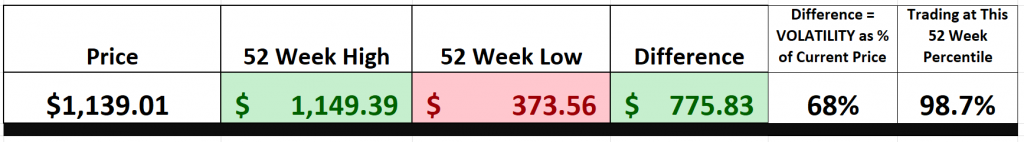
Over the past 52 weeks $NVDA has traded as high as $1149.39 and as low as $373.56.
The annual trading range was $775.83 . Let’s talk about the volatility of Nvidia ($NVDA) and what it means for investors. Looking at the numbers, we get a clear picture of the historic volatility by comparing the annual trading range to the current price. Over the past 52 weeks, Nvidia’s historic volatility was a whopping 68%. This is significantly higher than what we see with broader market indexes. What does this tell us? It means that, based on recent history, it’s entirely within the realm of possibility for Nvidia’s stock price to swing 68% higher or lower over the next year.
Equally important is where Nvidia stands today—trading at the 98th percentile of its 52-week range. This high percentile indicates that Nvidia is near the top of its trading range for the past year, signaling strong investor confidence and bullish sentiment in the market.
In summary, Nvidia’s high volatility and current trading position make it a stock to watch closely, reflecting both the potential for significant price movements and the market’s high expectations.
Let’s talk about a crucial element when analyzing trading opportunities: a stock’s 52-week high and low. These numbers are far more than just data points; they serve as the stock’s report card, offering a clear view of its performance over the past year. Understanding these boundaries is essential for grasping historical trends and gauging the stock’s journey.
The 52-week high and low provide insight into the stock’s momentum, indicating strong support and resistance levels. When a stock like Nvidia consistently hits higher highs and higher lows, it suggests a bullish trend—a sign of strength that often begets more strength. Conversely, a pattern of lower highs and lower lows points to a bearish trend.
These boundaries also reflect investor sentiment. Near the 52-week high, optimism is often at its peak, while proximity to the 52-week low can signal widespread investor jitters. Here’s the kicker: in the volatile world of the stock market, these highs and lows hold significant sway. If a stock breaks above its 52-week high, it’s like a green light signaling a potentially lucrative buying opportunity. On the other hand, if it dips below its 52-week low, that’s a glaring red flag.
Remember, folks, a trend in motion tends to stay in motion until it stops. This principle underscores the importance of momentum in trading. When you see a stock like Nvidia pushing through its 52-week high consistently, it’s a strong indicator that it there is massive investor confidence supporting the higher valuation. Conversely, falling below the 52-week low often suggests further declines.
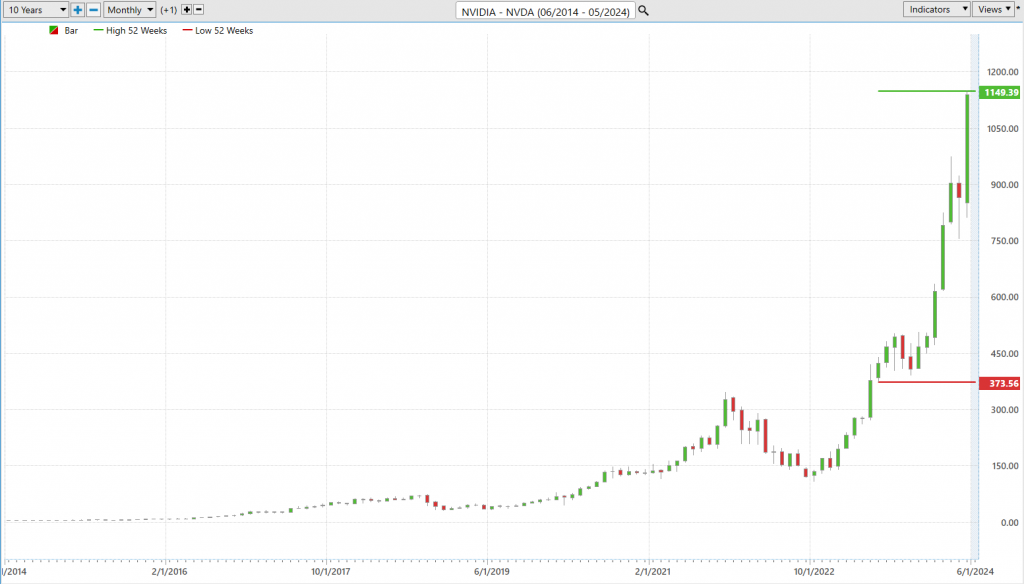
So, as you navigate the market, keep a close eye on these 52-week boundaries. They are your compass, guiding you through the bullish peaks and bearish valleys of stock performance. And always remember, in the stock market, strength often begets strength, and a trend in motion tends to stay in motion until it hits a stopping point. Zooming out to the 10-year chart shows you how explosive the move in $NVDA has been this past year.
Best Case – Worst Case Scenario
Let’s delve into a critical tool that every savvy investor and trader should have in their arsenal – understanding the delicate balance between risk and reward. It’s not about complex strategies; it’s about a straightforward analysis that lays bare the best-case and worst-case scenarios. Imagine this: we’re charting the peaks and troughs of market movements over the past year, akin to navigating the tumultuous waves of a stormy sea. This is your key to unlocking the truth about risk and reward amidst real-world volatility.
Picture this scenario: we’re connecting the dots between the strongest rallies and the strongest declines, akin to measuring the ebbs and flows of those waves. This isn’t just about market jargon; it’s about gaining a profound insight into the essence of risk and reward of $NVDA specifically. By doing this simple and practical exercise, you can quickly understand the best case and worst-case scenarios.
So, here’s the crux of the matter: we need to carefully evaluate those bullish rallies against the bearish downturns. It’s like sailing through choppy waters, where understanding the stakes – risk and volatility – is paramount. But this isn’t just a fancy maneuver; it’s a strategic mindset. By dissecting both the peaks and valleys, we gain a comprehensive understanding of a stock’s potential. It’s not merely about projecting future gains; it’s about embracing the realities of risk as well. This approach acts as our guiding beacon through the turbulent seas of market fluctuations, revealing the true dynamics of assets.
So, don’t just skim through those charts; truly absorb them. This isn’t just about tactics; it’s about crafting a robust strategy that empowers you to make well-informed decisions, manage your exposure, and construct an investment plan that can weather any storm.
Now, let’s dive into the nitty-gritty. From this VantagePoint, we can instantly grasp the potential rewards and risks of the past year for $NVDA.
Firstly, let’s outline the best-case scenario:
Now, onto the worst-case scenario:
Viewed from this perspective, we can immediately see the reward and risk of the past year for $NVDA and can quantitatively see what the rallies and declines have looked like. The bulls are in control and the declines have been quite mild in comparison.
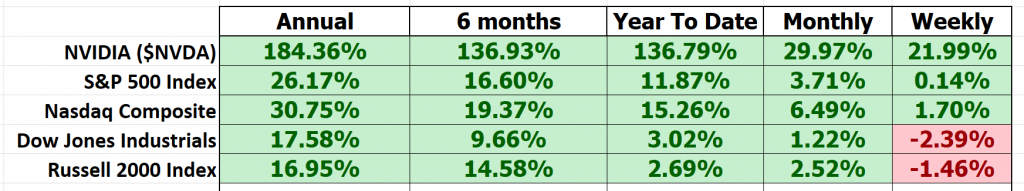
Next, we need to compare $NVDA to the broader stock market indices. By doing so, we can immediately see that $NVDA has massively outperformed the broader market.
Clearly, $NVDA has massively outperformed the broader market.
A couple of very striking metrics are in that table. Notice how year to date the Dow Jones Industrials and the Russell 2000 Index are not even keeping pace with the rate of inflation. Meanwhile $NVDA is up 136.79%
Last but not least we need to compare the volatility of $NVDA to the broader market. This is done by looking at BETA. Beta is a measure of a stock’s volatility in relation to the overall market. A beta of 1 indicates the stock tends to move in line with the market, while a beta greater than 1 suggests higher volatility, and a beta less than 1 implies lower volatility compared to the market.
NVIDIA ($NVDA), over the past 5 years, exhibits a beta of 2.45, indicating it is 145% more volatile than the broader market . So in $NVDA we have a stock which has massively outperformed the broader market with 145% more volatility.
Doing this type of analysis allows me to see the bigger picture. $NVDA is by far the fastest horse in the race, but that does not mean we throw caution to the wind. To trade successfully we need to always be realistic about risk and reward and keep greed in check.
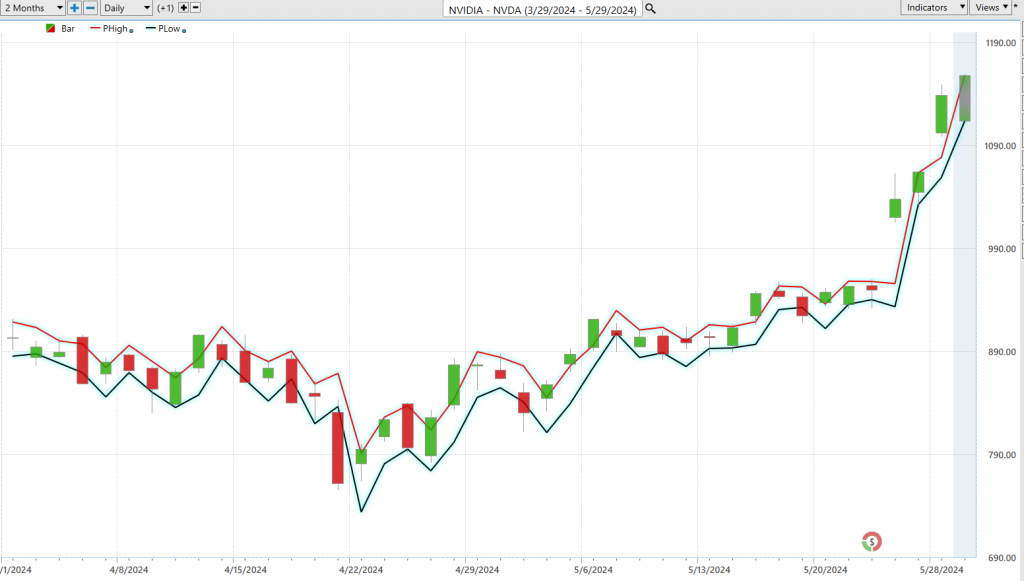
Vantagepoint A.I. Predictive Blue Line Analysis
Our guiding principles are as follows:
– The trajectory of the predictive blue line dictates the trend forecast and overall trajectory of $NVDA.
– Ideally, the VALUE ZONE is determined to seek buying opportunities at or below the predictive blue line or selling opportunities above it during a downtrend.
– Naturally, as the predictive blue line slopes downward, traders anticipate lower prices, either retreating to the sidelines or hedging their positions.
Through VantagePoint Software and its artificial intelligence, traders are apprised of trend forecasts by monitoring the slope of the predictive blue line.
In today’s fast-paced market environment, traders are on the lookout for effective tools and strategies to navigate the complex financial landscape. Enter VantagePoint Software, a trailblazer in artificial intelligence, providing traders with a sharp focus on risk and reward analysis. Central to this technology is the predictive blue line, offering clear insights into market trends.
Think of this predictive blue line as your financial compass , with its slope guiding the market’s direction. An upward slope indicates a bullish market, presenting buying opportunities. On the flip side, a downward trend suggests a market downturn, signaling potential selling points.
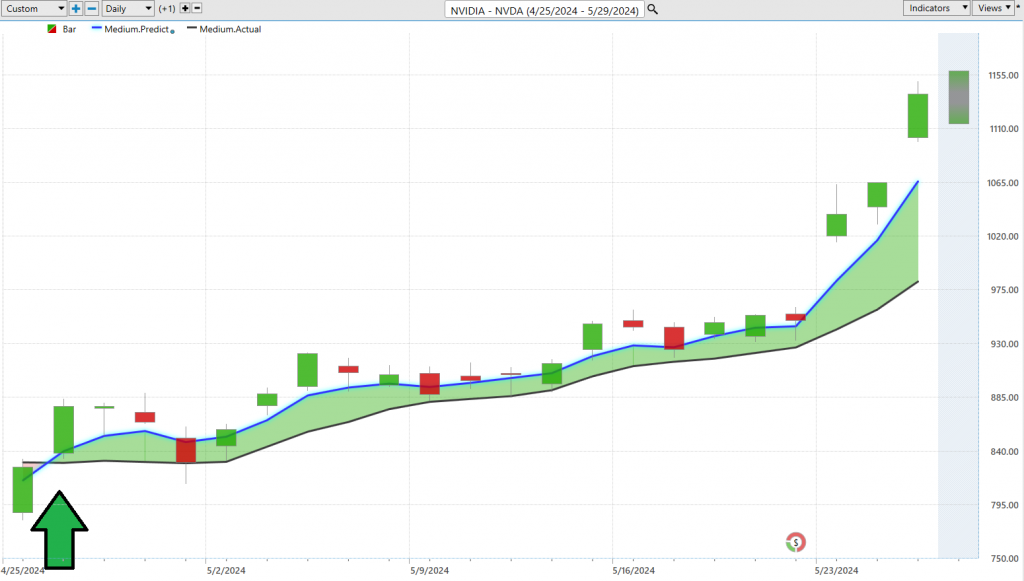
This blue line pinpoints the ‘value zone’ – an essential area for traders. In an uptrend, this zone lies just below the blue line, highlighting a convergence of price and intrinsic value, revealing the asset’s true worth. Observe on the chart above that the UP forecast was generated on April 26 th . Prices slid 7% before reversing course. However, Power Traders were focused on the value zone (the green channel) looking to position themselves for higher prices.
This isn’t mere speculation; it’s backed by VantagePoint’s cutting-edge A.I. technology, which combines neural networks with intermarket analysis. This powerful combination delves deep, analyzing price drivers and leveraging A.I. to uncover intrinsic value.
Accompanying the predictive blue line is the black line, reflecting recent market history through the 10-day moving average, providing context to the blue line’s predictions. The interaction between these lines reveals market momentum and emerging opportunities.
Powered by VantagePoint’s patented Neural Network and Intermarket Analysis, the predictive blue line uses artificial intelligence and statistical correlations to dissect the strongest price drivers of an asset. A quick look at the chart reveals the insightful forecasts generated by artificial intelligence.
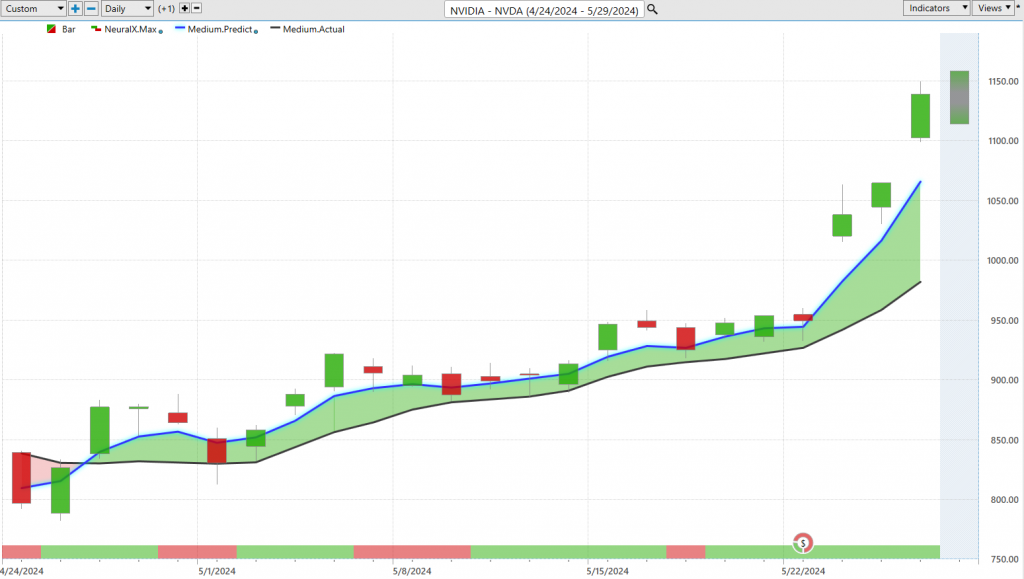
Neural Network Indicator (Machine Learning)
In the fast-paced world of trading, neural networks have emerged as advanced tools that mimic the human brain’s structure and function to analyze market data. These networks consist of interconnected nodes that identify complex patterns within vast datasets, offering traders sophisticated pattern recognition capabilities.
Key benefits of neural networks in trading include minimizing human error, enhancing prediction precision, and providing real-time insights into emerging trends. These adaptive systems continuously refine their predictions, making them invaluable in dynamic market environments.
At the core of trading strategies is the Neural Network Indicator, which, when combined with the Triple Cross indicator, helps traders pinpoint critical market entry and exit points with precision. This synergy allows traders to capitalize on market opportunities effectively.
For instance, the chart of NVIDIA ($NVDA) demonstrates how these tools provide ‘double confirmation’ signals, aligning predictive data with the Neural Network Indicator to highlight high-probability trading strategies. This integration of advanced technology and market analysis helps traders stay ahead in the ever-evolving financial landscape.
Since the UP forecast was generated on April 26 th , $NVDA has rallied over 30% in 22 trading sessions. This is how Power Traders stay on the right side of the right trend at the right time.
VantagePoint Software Daily Price Range Prediction
Let’s talk about the cutting-edge tools that are revolutionizing the trading world: artificial intelligence (AI), machine learning, and neural networks. These technologies are crucial for traders aiming to pinpoint the next day’s trading range with precision. By sifting through mountains of historical market data, these AI-driven tools identify patterns, trends, and correlations that drive price movements.
Machine learning algorithms are experts at recognizing patterns, while neural networks excel at predictive modeling. This powerful combination allows traders to forecast future price movements with remarkable accuracy. Real-time analysis ensures traders can adapt to the ever-changing market conditions, while the ability to define the trading range precisely aids in risk management and decision-making. In essence, AI provides traders with a significant competitive edge, enhancing their data analysis, opportunity identification, and trading strategy optimization in dynamic financial markets.
Take NVIDIA stock ($NVDA) as an example. Examine its average trading ranges on a daily, weekly, and monthly basis.
It’s like a volatility barometer. But here’s the thing – knowing the ranges is just the start. The real challenge is identifying those prime entry and exit points.
Now, let’s focus on the Daily Range Forecast chart, an essential tool crafted for short-term swing traders. It goes beyond traditional charting, serving as a predictive oracle that unveils the expected course of each trading day.
In the high-speed world of trading, precision isn’t just a virtue; it’s a necessity. Enter Vantagepoint A.I.’s Daily Range Forecast. Armed with AI, machine learning, and neural networks, this tool isn’t merely crunching numbers; it’s interpreting the market’s rhythm for each trading session. Think of it as your personal navigator in the trading universe, guiding traders to deftly navigate market fluctuations and identify optimal entry points. In trading, staying ahead of the curve is not just beneficial; it’s essential.
Intermarket Analysis
Intermarket analysis is a methodology used by traders and investors to understand the relationships and interactions between different financial markets. By studying these correlations, traders can gain insights into broader market trends and identify potential trading opportunities. The primary markets involved in intermarket analysis include stocks, bonds, commodities, and currencies.
In today’s interconnected world, understanding what drives market prices is crucial for success in trading. That’s where intermarket analysis comes into play. This method looks at the correlations and interdependencies among stocks, bonds, currencies, commodities, and indices to uncover broader market trends and identify trading opportunities based upon uncovering the 31 key drivers of price for $NVDA stock.
The real power of intermarket analysis lies in its ability to give traders a comprehensive view of market dynamics. By seeing how different markets interact, traders can grasp the underlying forces that drive price movements and predict trends across multiple asset classes. This holistic approach not only helps in making more informed decisions but also in managing risk effectively.
Louis Mendelsohn, a pioneer in trading and technical analysis, made significant contributions to this field with his VantagePoint A.I. trading software. His work integrating intermarket relationships into trading strategies has allowed traders to analyze multiple markets simultaneously and gain invaluable insights.
By studying the interplay between asset classes, traders can spot correlations. For instance, the inverse relationship between stocks and bonds or how commodity prices affect currency rates. This analysis helps traders foresee trends in one market by observing movements in others. A surge in commodity prices, for example, might indicate inflationary pressures, affecting currencies and interest rates.
Intermarket analysis aids in timing trades by identifying convergences or divergences. If stock prices rise while bond yields fall, it could signal a bullish trend in equities.
In summary, intermarket analysis provides traders with a broader perspective on market dynamics and a deeper understanding of how different asset classes are interconnected. By incorporating these insights into their strategies, traders can gain a competitive edge and enhance their performance in the financial markets.
As you dig into the Intermarket Analysis you will discover that since $NVDA is a component of the S&P 500, the NASDAQ and The Philadelphia Semiconductor Index you will understand its significance to the broader market performance and utlook.
The following charts are shared to highlight the very powerful correlation that $NVDA has to the indexes which it is a component of. As goes $NVDA so goes the market.
Our Suggestion
The next earnings call for $NVDA will occur on August 21, 2024.
Looking ahead, analysts have high expectations for NVIDIA’s revenue and earnings growth. For the fiscal year ending January 31, 2025, NVIDIA is projected to generate revenue of approximately $111.3 billion, with an EPS forecast of $57.69. By the fiscal year 2026, revenue is expected to increase to $134.2 billion with an EPS of $68.1. These metrics are beyond impressive.
What all traders and investors must asses though is can they ($NVDA) do it on the backs of a slowing economic environment. Food prices are increasing faster than the p[rice of the Dow Jones Industrials of the $NASDAQ. That is quite the contradiction to confront when it comes to the tales of a strong and resilient economy.
$NVDA is heralded as the economy when you listen to financial media. I will stress that it is one stock in the broader economy.
This growth is driven by NVIDIA’s strong performance in sectors like data centers and gaming, bolstered by the increasing demand for AI and machine learning applications. As a result, NVIDIA’s revenue and earnings are expected to continue their upward trajectory, providing a solid outlook for investors and traders.
Traders should brace themselves for greater-than-usual volatility, but don’t let that shake your confidence. $NVDA is poised to continue offering tremendous opportunities in the coming year, thanks to its pivotal role in an economy swiftly moving towards robotics and artificial intelligence solutions.
Over the past year, $NVDA has been the standout performer among the Magnificent 7. It’s been making new 52-week highs and even hitting new 10-year highs consistently over the last few months. This isn’t just a fluke; it’s a clear sign that NVIDIA is overcoming any and all obstacles in its path to success.
As we move forward, it’s crucial to practice sound money management with all your trades. Always refer to the A.I. forecast for trend analysis to pinpoint the best entry and exit points. The rapid advancements in tech and NVIDIA’s leadership in the AI space make it a stock to watch closely. Any dips you see will likely be short-lived, presenting golden opportunities for savvy investors to capitalize on.
Stay informed, stay strategic, and let the A.I. guide your trading decisions.
Here’s to another year of potential gains with $NVDA!
Let’s Be Careful Out There!
Remember, It’s Not Magic.
It’s Machine Learning.
Disclaimer: THERE IS A HIGH DEGREE OF RISK INVOLVED IN TRADING. IT IS NOT PRUDENT OR ADVISABLE TO MAKE TRADING DECISIONS THAT ARE BEYOND YOUR FINANCIAL MEANS OR INVOLVE TRADING CAPITAL THAT YOU ARE NOT WILLING AND CAPABLE OF LOSING.
VANTAGEPOINT’S MARKETING CAMPAIGNS, OF ANY KIND, DO NOT CONSTITUTE TRADING ADVICE OR AN ENDORSEMENT OR RECOMMENDATION BY VANTAGEPOINT AI OR ANY ASSOCIATED AFFILIATES OF ANY TRADING METHODS, PROGRAMS, SYSTEMS OR ROUTINES. VANTAGEPOINT’S PERSONNEL ARE NOT LICENSED BROKERS OR ADVISORS AND DO NOT OFFER TRADING ADVICE.