| This week’s stock analysis is Financial Select Sector SPDR Fund ($XLF) |
Over the past few weeks, we have seen some interesting events occur with the Credit Rating agencies. For this reason, we are doing a DEEP Dive analysis on the Financial Select Sector SPDR ETF ($XLF).
The XLF ETF (Exchange-Traded Fund) is a financial product that tracks the performance of companies operating in the financial sector of the stock market. More specifically, the XLF ETF aims to replicate the performance of an underlying index known as the Financial Select Sector Index. This index includes a selection of large U.S. financial companies, such as banks, insurance companies, investment firms, and other related businesses.
The XLF ETF allows investors to gain exposure to a diversified portfolio of financial sector companies without having to purchase individual stocks of each company separately. It provides a way to invest in the broader financial industry, rather than betting on the performance of any single company. The performance of the XLF ETF is closely tied to the performance of the companies within the financial sector that it tracks.
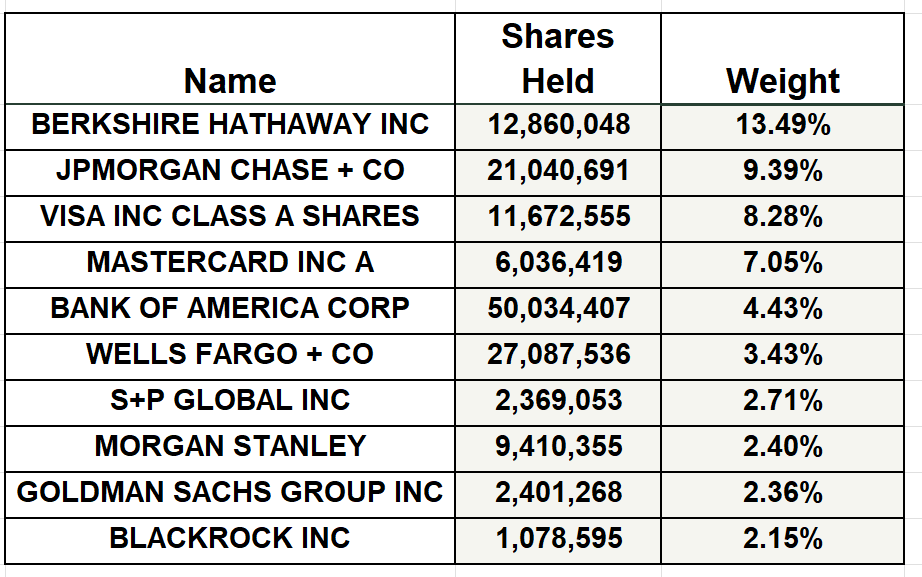
Here are the major holdings of the $XLF:
Investing in an ETF like XLF can provide benefits such as diversification, liquidity, and ease of trading, as ETFs trade on stock exchanges like individual stocks. However, like all investments, the value of the XLF ETF can fluctuate based on market conditions and the performance of the underlying companies. It’s important for investors to conduct thorough research and consider their investment goals and risk tolerance before investing in any ETF.
The Financial Select Sector SPDR Fund (XLF) is an exchange-traded fund (ETF) that provides exposure to the financial sector. Here’s a summary of the pertinent information:
– **Creation Date**: XLF was launched on December 16, 1998.
– **Management**: The ETF is managed by State Street.
– **Assets Under Management (AUM)**: roughly $34.69 billion.
– **Expense Ratio**: The Gross Expense Ratio is 0.10%.
– ** Dividend Yield**: XLF has a dividend yield of 2%.
The ETF tracks an index of S&P 500 financial stocks, weighted by market cap. It has a total of 75 holdings from the United States that are part of the Financial Select Sector index. The top 10 holdings constitute 55.42% of the fund’s assets.
The analysis of this ETF is to gauge the Financial sector’s reaction to the recent credit downgrades. This exploration aims to provide an initial insight into the sector’s resilience and adaptability in the face of such fiscal challenges. Additionally, by delving into the extended historical trajectory of this asset, we aim to uncover patterns and lessons that could inform future trading ideas.
The major credit rating agencies, often referred to as the “Big Three,” are:
1. **Standard & Poor’s (S&P)**: Founded in 1860, S&P is an American financial services company and is a division of S&P Global. It provides credit ratings on bonds, short-term debt, and other financial instruments.
2. **Moody’s Investors Service**: Established in 1909, Moody’s is an American company that offers research, credit ratings, and risk analysis.
3. **Fitch Ratings**: Founded in 1913, Fitch is a dual-headquartered company based in both New York City and London. It is one of the newer agencies among the Big Three but has grown significantly in influence.
These agencies assess the creditworthiness of various entities, including governments, corporations, and financial institutions. Their ratings can influence interest rates, investment flows, and financial market stability.
Moody’s Investors Service remains the sole major credit rating agency to uphold a top-tier rating for the United States. This comes after Fitch recently downgraded the U.S. sovereign rating and Standard & Poor’s did the same back in 2011. While this may appear to be a minor point, only one out of three of the major credit rating agencies considers US Treasuries to be AAA.
When credit rating agencies adjust, it is a source of volatility. More importantly, when credit rating agencies disagree on each other’s ratings it is a source of continuous concern for traders and investors.
On August 2, 2023, downgraded the U.S. government’s top credit rating from AAA to AA+. This decision was met with strong disapproval from the White House, which expressed surprise, especially since the debt ceiling crisis had been resolved two months prior.
Fitch cited multiple reasons for the downgrade:
1. Anticipated fiscal deterioration over the next three years.
2. Repeated last-minute debt ceiling negotiations, which posed threats to the government’s ability to meet its financial obligations.
3. A decline in governance standards over the past two decades, especially concerning fiscal and debt matters.
The immediate market reaction saw a shift from stocks to government bonds and the dollar. However, the long-term impact of the downgrade on investor sentiment remains to be seen.
The reason this credit downgrade is important is because this is only the second time a major rating agency has stripped the U.S. of its AAA rating. While Fitch’s decision has raised concerns about the U.S.’s fiscal health, the actual impact on U.S. debt trading and the broader financial market is still unfolding.
On the heels of these two stories CNBC reported that FITCH may be forced to downgrade dozens of banks including JP Morgan Chase.
In this stock study we will look at the following metrics and indicators.
- Wall Street Analysts’ Estimates
- 52-week high and low boundaries
- Best Case – Worst Case Analysis
- Vantagepoint A.I. Triple Cross Indicator
- Neural Network Forecast
- On Balance Volume Analysis
- Daily Range Forecast
- Intermarket Analysis
- Our trading suggestion
We don’t base our decisions on things like earnings or fundamental cash flow valuations. However, we do look at them to better understand the financial landscape that a company is operating under.
Analysts Ratings
Based on 876 Wall Street analysts offering 12-month price targets to XLF holdings in the last 3 months. The average price target is $39.54 with a high forecast of $46.77 and a low forecast of $34.60. The average price target represents a 13.1% change from the last price of $34.27. What we also like to do is subtract the low Wall Street analysts forecast ($34.60) from the high forecast ($46.77) to arrive at what we call a Wall Street Analysts volatility variance (12.17) which simply needs to be divided by the current price ($34.21). This tells us that there is a variance of 34.7% from most optimistic to pessimistic of Wall Street Analysts who watch the stock 24/7.
By performing this simple calculation, it tells us how much volatility over the next year Wall Street’s top minds think is baked into the $XLF price forecast.
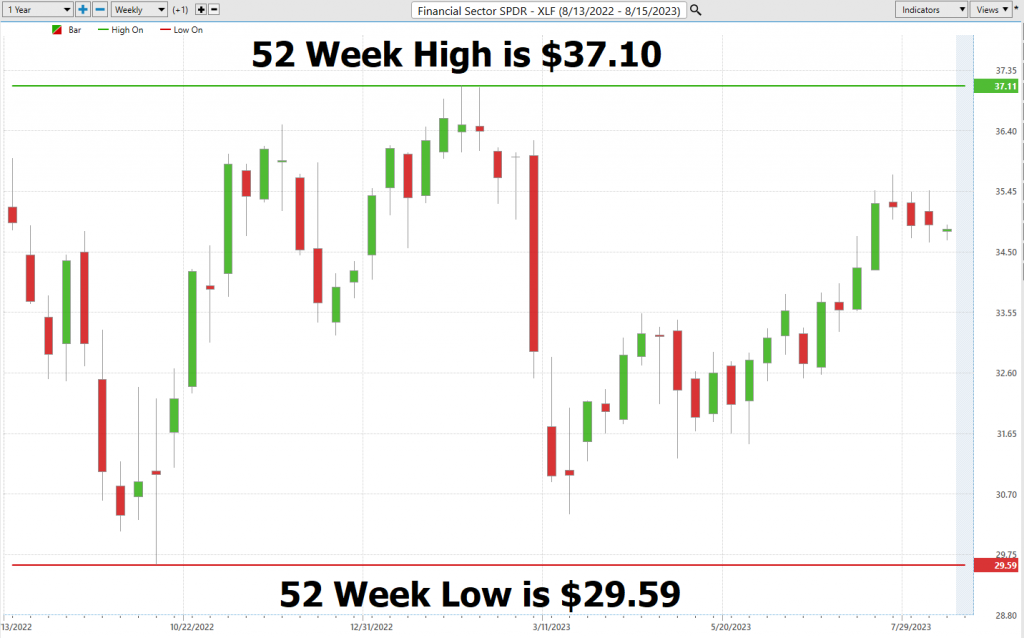
52-week High-Low Chart
Over the past year we have seen $XLF trade as low as $29.59 and as high as $37.11. This tells us that the annual trading range is $7.52.
We would also like to divide the current price of $34.21 by the annual trading range ($7.52) to get a broad-based estimate of trading volatility based upon last year’s price action. This tells us that the volatility of $XLF over the past year has been 21.9%. This value also provides us with a basic estimate in letting us know that if the future is like the recent past, it would be normal for $XLF to trade in a range that is 21.9% higher and/or lower than the current price over the next year.
In the tapestry of financial markets, the 52-week boundaries are not just a fleeting data point. They are a linchpin, a cornerstone that astute market players keenly monitor, and their significance is manifold.
Here’s the decode.
These boundaries transcend mere numbers. They are a barometer for discerning ‘fair value’ and clearly defining where the asset is trading in relation to its 52-week range. Market mavens deploy it as a compass, determining if a security’s current trading range aligns with its recent trajectory. Think of it as the market’s pulse check, assessing if a stock’s valuation holds water.
The intrigue doesn’t end there. The vicinity of the 52-week low becomes a hunting ground for veterans, seeking early tremors of a potential price resurgence. The 52-week low, in essence, isn’t just chart trivia. It’s akin to a marathoner’s personal worst time, a metric that seasoned traders swear by. Hence, this low boundary becomes an indispensable tool in a trader’s analytical arsenal.
Now, for the pièce de resistance – an asset not just grazing 52-week zeniths but also breaching decade-long peaks. Such a feat isn’t mere chart-topping; it’s a testament to unparalleled tenacity and performance. Visualize an asset that’s not just outstripping its recent benchmarks but is eclipsing its historical milestones. Such bullish fervor isn’t just a temporal spike; it’s a defiance of market norms, a beacon of enduring strength.
The underpinning factor? Market psychology . These unprecedented highs function as a magnet, drawing investors into a whirlpool of bullish sentiment. The ensuing domino effect sees more capital influx, propelling prices further. It’s a self-perpetuating cycle of bullishness.
This isn’t market serendipity; it’s a metric of growth dynamism. Wall Street’s analytical brigade delves deep, sifting through granular data to decode this expansion trajectory. As market participants, aligning with this growth and leveraging innovative tools like A.I. and machine learning becomes the strategy du jour.
Currently $XLF is trading at the 62nd percentile of its 52-week range.
Elite traders often juxtapose these volatility metrics with insights from Wall Street’s analytical maestros to decode the price nuances of $XLF. And for those with a penchant for the long game, a deep dive into $XLF’s decade-long monthly chart can offer illuminating insights.
On the 10-year Chart $XLF is currently trading at the 72nd percentile of its 10-year trading range.
Best Case – Worst Case Analysis
Over the last 10 Years, $XLF is up 114.29%
Over the last 5 years, $XLF shares are up 21.4%
Over the last 52 weeks, $XLF is down 4.47%
Since the credit downgrades were announced $XLF is down 3.1%
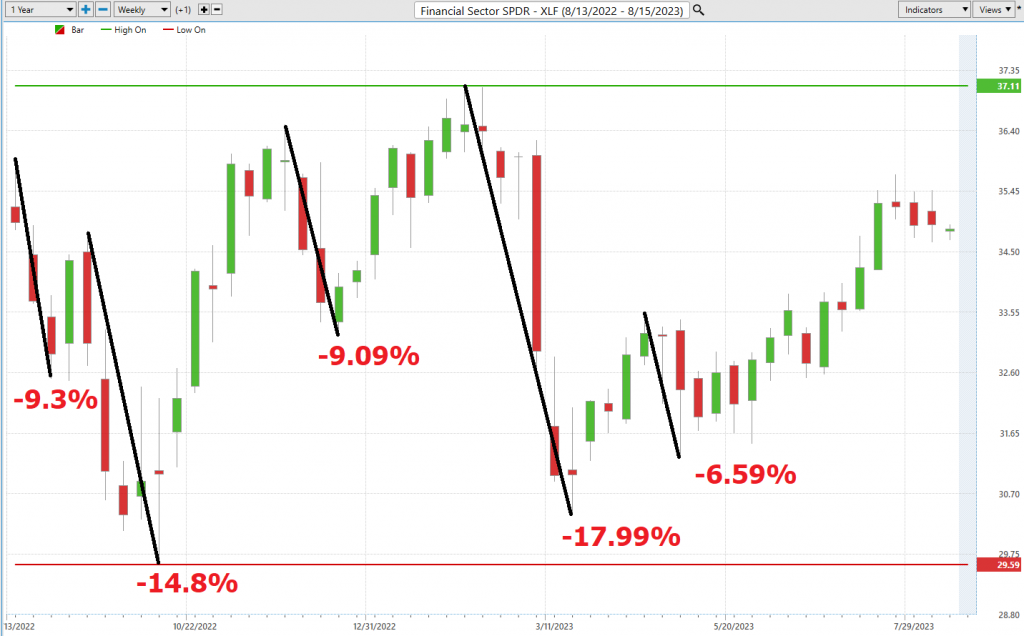
Moving forward, our intent is to get a real-world perspective of risk and volatility. We can accomplish this by looking at the practical realm of performance. We deem it crucial, prior to initiating any trade, to have a comprehensive understanding of how the past year’s rallies compare to the declines. This exercise offers us a glimpse into the actual price movements of $XLF, aiding us in comprehending its volatility.
To realize this goal, we merely link the highest and lowest uninterrupted points on the $XLF to simply understand how the rallies have compared to the declines.
First the best-case analysis:
Followed by the worst-case analysis:
When we delve into a trade, it’s crucial to compare the highest rallies to the steepest declines. This comparison gives us a clear picture of the asset’s real-time volatility and allows us to juxtapose the performance of the asset we’re considering with the returns of the major market indexes. Successful trading is always about being acutely aware of an asset’s potential volatility. As traders, we’re on the lookout for MOTION. But remember, motion is a double-edged sword. By initially examining rallies and declines, we can swiftly determine whether an asset is retaining its gains or not. We can also quickly determine the best and worst rallies and declines over the past year by simply connecting the uninterrupted high points and low points.
A couple of important takeaways emerge from this simple analysis.
- Observe how the rallies and declines remained extremely close to the statistical volatility boundaries of 21.9%. Meanwhile, the Wall Street analyst’s variance of 34.7% still remains a bit extreme.
Our expectation is that over the following year NORMAL price action will resemble what has occurred over the past 12 months.
You can quickly observe the level of risk and opportunity by doing this analysis on your own any time you trade. Astute traders will place $XLF on their radar and pay close attention to the UP forecasts after a major selloff has occurred.
Lastly, we compare the performance of $XLF to the broader stock market indexes.
On Wall Street, ‘BETA’ holds a prominent place and important definition. Defined in its essence, the beta (β) of a stock serves as a barometer of its volatility vis-à-vis the broader market, often benchmarked against indices like the S&P 500. At its core, beta deciphers a stock’s susceptibility to market ebbs and flows.
To distill the concept of BETA:
– **Beta = 1**: This suggests the stock marches in lockstep with the market. For instance, a 5% uptick in the market would likely see a parallel 5% surge in a stock with a beta of 1.
– **Beta > 1**: Here, the stock exhibits heightened volatility compared to the market. Take a beta of 1.5: it implies the stock’s volatility overshadows the market by 50%. Thus, a 5% market rise could propel the stock by 7.5%—and the inverse holds true.
– **Beta < 1**: This denotes a stock’s subdued volatility relative to the market. With a beta of 0.5, the stock’s volatility is halved compared to the market. A market surge of 5% might nudge the stock by a mere 2.5%.
For the record, $XLF’s beta stands at 1.09, gauged over a 5-year monthly span.
However, a caveat: beta leans on historical data, and as seasoned investors know, past trajectories don’t guarantee future outcomes. Elevated beta doesn’t inherently equate to lofty returns—it underscores amplified volatility, and by extension, potential risk.
For the discerning investor, beta offers a lens to fathom the risk quotient of an asset in relation to the market’s broader pulse. It’s an instrumental tool, aiding in sculpting portfolios that resonate with an investor’s risk appetite and financial aspirations.
Clearly, $XLF has underperformed the broader stock market indexes across all major important time frames.
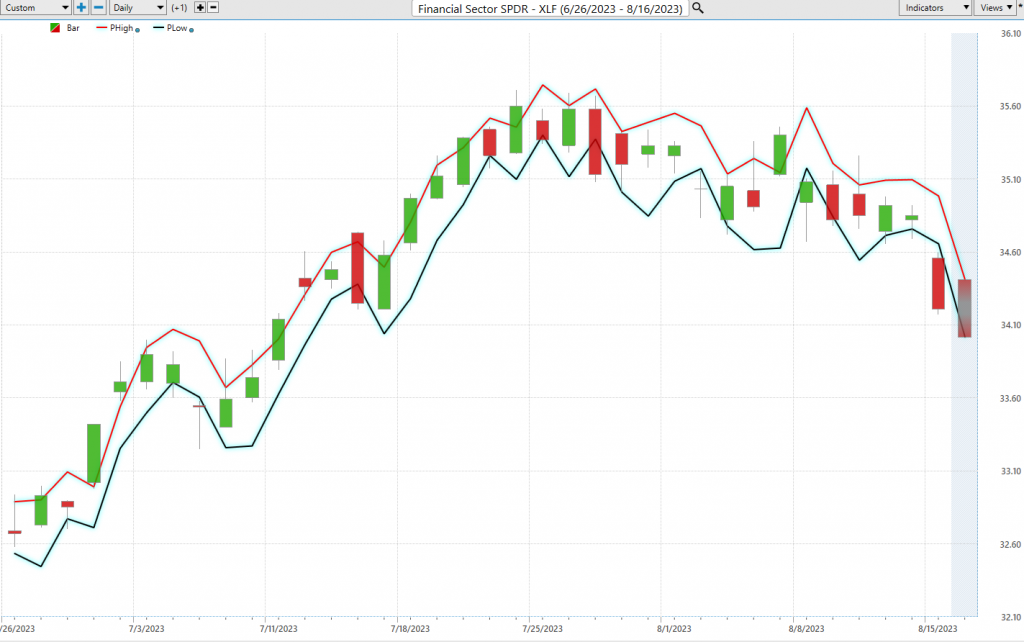
The Vantagepoint A.I. Predictive Blue Line
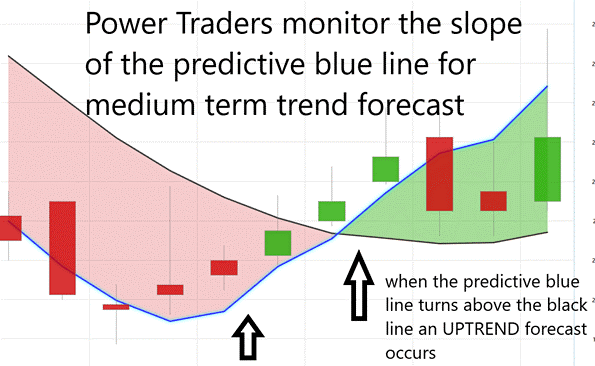
Using VantagePoint Software and artificial intelligence, traders are alerted to trend forecasts by monitoring the slope of the predictive blue line. The black line is a simple 10-day moving average of prices which simply tells you what has occurred in the market. The predictive blue line also acts as a value zone where in uptrends traders try to purchase the asset at or below the blue line.
When studying the chart below, it’s imperative to consider the interplay between the black line and the predictive blue line. The black line simply provides a historical perspective. It informs you about the past price points and the average price over the previous ten days.
Contrastingly, the predictive blue line, backed by VantagePoint’s proprietary Neural Network and Intermarket Analysis, predicts future values and trends. It harnesses artificial intelligence and employs statistical correlations to identify the most potent price influencers of an asset.
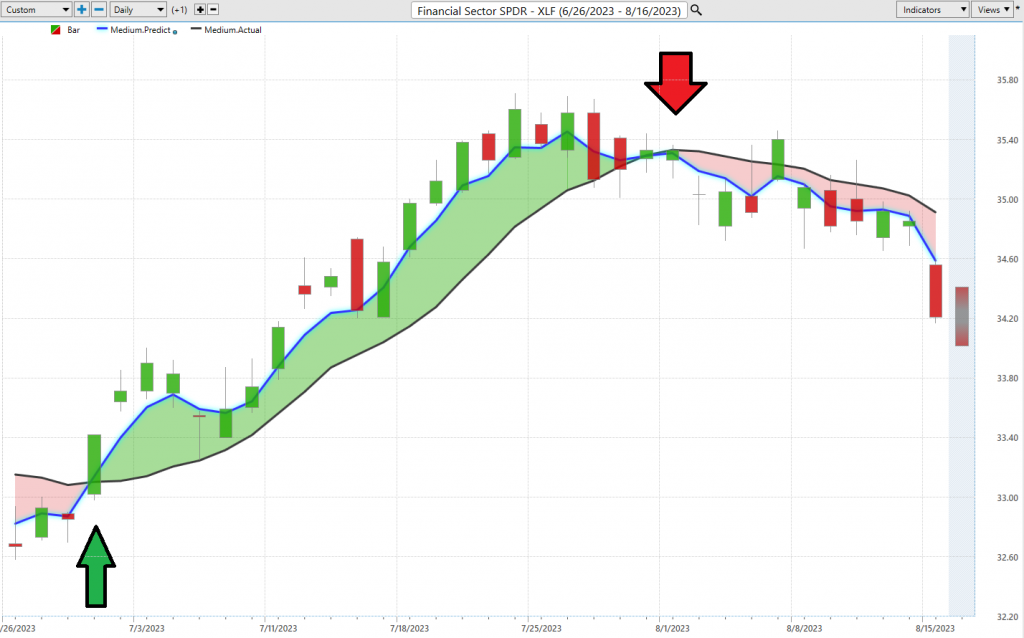
Our focus will be on the past 4 weeks of $XLF price action, providing an opportunity for you to witness firsthand the remarkable capabilities of artificial intelligence in a live trading scenario. While our approach is conservative, we believe that such technological advancements provide an exciting window into trend analysis and risk management.
Whenever we see the predictive blue line move above the black line, we are presented with an UP-forecast entry opportunity. These are highlighted by the UP arrow on the chart.
Whenever the predictive blue line moves below the black line, we are presented with a DOWN forecast entry opportunity. More importantly, there is no guesswork involved. Traders know where the value zone and trend are at all times.
The Up forecast resulted in gains of 4.78%.
The down forecast is currently profitable to the tune of r 3.1%.
Fine Tuning Entries with The Neural Net Indicator
In the realm of advanced trading analytics, the Neural Index Indicator stands out as a sophisticated predictive tool, offering traders a lens into potential market dynamics. A green color from the indicator typically heralds market strength, while a red alert cautions of imminent short-term volatility. We advocate for astute traders to synergize this tool with the predictive blue line, refining their market entry and exits with exacting precision.
Neural networks represent the pinnacle of computational prowess, harnessing vast computational capabilities to distill vast data sets, charting the most strategic market trajectory. This self-optimizing mechanism acts as a vigilant sentinel, continually enhancing its analytical acumen, making it an indispensable trading complement.
Savvy traders, always on the hunt for statistically robust trading opportunities, integrate both neural networks and artificial intelligence to pinpoint those high-potential trades. They employ a “dual validation” approach, seeking alignment between the predictive blue line and the Neural Net—crafting an environment conducive to maximizing trade success probabilities. The chart annotations above highlight instances where the neural index and the A.I. concurrently indicated a unified market direction.
Our suggestion to seasoned traders is to pay unwavering attention to the trajectory of the predictive blue line, ensuring its congruence with the Neural Index. Observe the chart above: the Neural Net consistently unveiled dual validation trading prospects. These confluences, where the predictive blue line and Neural Net converge, signal high-probability trade scenarios, primed for capitalization.
By aligning with the Neural Network Indicator and leveraging the insights of the predictive blue line, traders are positioned to preempt and capitalize on high-yield market opportunities.”
VantagePoint Software Daily Price Range Prediction
One of the powerful features in the Vantagepoint A.I. Software which Power Traders use daily is the Daily Price Range prediction forecast.
This forecast is what permits Power Traders to truly fine tune their entries and exits into the market.
Over the past year here are the average trading ranges for the monthly, weekly, and daily time frames.
Amidst this level of volatility, there is either tremendous opportunity or risk. It will always depend upon where the trader decides to place their entries and exits.
Here is the price chart of $XLF during the most recent 6-week runup featuring the Daily Price Range forecast and the Neural Net Indicator. Observe how the trend is always very clearly delineated. Traders use the predicted high and low prices as guides in their overall trading strategy.
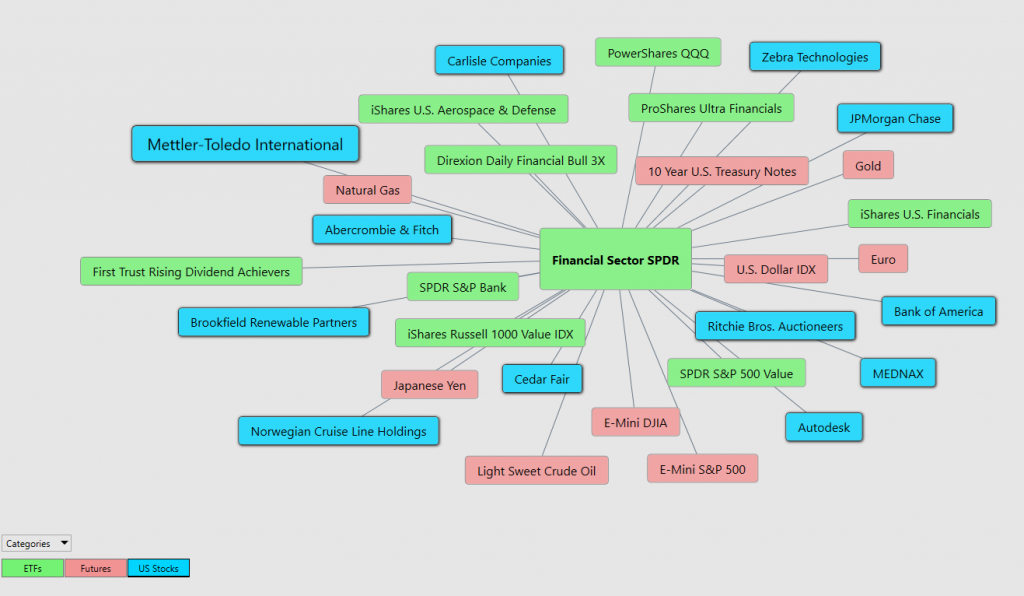
Intermarket Analysis
Vantagepoint Software is emerging as a focal point in trading circles, lauded for its pioneering approach to Intermarket analysis. This method delves deep into the intricate web of market relationships, pinpointing assets with pronounced statistical correlations that often dictate price movements. While traditional chart analysis offers a glimpse into support and resistance levels, the complexities of today’s global marketplace necessitate a broader lens, probing the myriad interconnections that shape market dynamics.
Intermarket analysis, at its core, is a sophisticated technique that evaluates markets by gauging the interrelations between diverse asset classes. It transcends the boundaries of conventional single-market scrutiny, such as stock or forex evaluations, by factoring in the ripple effects from other asset markets.
The foundational belief underpinning intermarket analysis is the intricate interplay among various markets—be it stocks, bonds, commodities, or currencies. These interdependencies play a pivotal role in steering overarching market trajectories. To illustrate, a surge in interest rates, a domain of the bond market, might tilt investor preference towards bonds, consequently dampening equity allure and precipitating a stock market decline.
John Murphy, former CNBC correspondent and a stalwart in the realm of intermarket analysis, has championed this approach. His seminal works, including “Intermarket Analysis: Profiting from Global Market Relationships,” underscore the tenet that markets are inextricably linked. Echoing this sentiment, Lou Mendelsohn, the visionary behind Vantagepoint A.I., has ardently advocated for Intermarket Analysis.
For traders, intermarket analysis offers a panoramic market vista. It eschews the tunnel vision of single-market evaluations, opting instead for a comprehensive assessment of intertwined market dynamics. This holistic perspective can potentially sharpen predictive accuracy, illuminating market trajectories and trends with greater clarity.
Furthermore, understanding these relationships allows traders to manage risk more effectively. If one asset class is expected to decline, a trader can offset potential losses by investing in another asset that is expected to rise.
It’s important to note that while intermarket analysis can be immensely helpful, it should be used in conjunction with other forms of analysis to confirm signals and predictions, not as a standalone tool.
Fluctuations in interest rates, crude oil prices, and the volatility of the dollar, among other variables, have a profound impact on business decisions in these challenging times. Investors and traders alike face the daunting task of identifying these factors. The key drivers of $XLF price movement, for instance, hold great value for traders, as it can reveal the ETFs most likely to acquire $XLF and other industries that impact its price movement.
Suggestion
$XLF deserves to be on your radar. The current downtrend has some more to run but pay attention to the a.i. forecast when the next UP opportunity occurs.
The trend is DOWN.
Momentum is DOWN.
The downgrade by FITCH has seen a downtrend begin.
Five months have elapsed since the onset of the regional banking turmoil, marked by Silicon Valley Bank’s unexpected collapse in March. As Wall Street reflects on this quarter, it’s imperative to dissect the root causes of this banking crisis, the subsequent ramifications on bank balance sheets, and the broader implications for the U.S. economic landscape.
Historically, banks have been the linchpin of credit infusion into the economy, either through securities acquisition or direct lending. It’s a well-established fact that the economy thrives on credit augmentation, making instances of bank credit contraction a rarity.
However, in the wake of SVB’s downfall, there was a pronounced dip in bank credit, a trend that persists, given the prevailing challenges of an inverted yield curve and looming recessionary threats. The genesis of this regional banking debacle can be traced back to escalating interest rates coupled with an inverted yield curve. This environment precipitated a dip in economical deposits, compelling banks to pivot towards pricier borrowing avenues.
Consequently, banks have been recalibrating their balance sheets, curbing their credit offerings to the economy, which has ushered in a tangible shrinkage in bank credit. Current trajectories indicate that banks might further tighten their lending belts. Such a lending pullback could exacerbate the economy’s descent into deeper recessionary waters.
In the current economic climate, banks are showing reluctance to expand their balance sheets or extend fresh credit. The underlying rationale is the diminished profitability of such actions, especially when they necessitate taking on heightened risks amidst mounting signs of a recession.
We expect the downtrend to continue and after a few more percentage points on the downside it will consolidate before resuming an UPTREND. We think the $XLF ETF provides great exposure to the top financial companies. While it is premature to recommend being bullish at present time, simply review the rallies in this ETF and you will come to appreciate how fast and sudden they are.
We think smart traders will exercise patience waiting for the right time to resume LONGS in the $XLF ETF. The bears are in control at present.
The predictive blue line is the guidance that we will be following. Wall Street Analysts are slowly revising their estimates upward.
Our advice: Follow the a.i. trend analysis and practice good money management on all your trades .
We will re-evaluate this analysis based upon:
- Wall Street Analysts’ Estimates
- 52-week high and low boundaries
- Vantagepoint A.I. Forecast (Predictive Blue Line)
- ON Balance Volume
- Neural Network Forecast
- Daily Range Forecast
- Intermarket Analysis
Let’s Be Careful Out There!
Remember, It’s Not Magic.
It’s Machine Learning.
Disclaimer: THERE IS A HIGH DEGREE OF RISK INVOLVED IN TRADING. IT IS NOT PRUDENT OR ADVISABLE TO MAKE TRADING DECISIONS THAT ARE BEYOND YOUR FINANCIAL MEANS OR INVOLVE TRADING CAPITAL THAT YOU ARE NOT WILLING AND CAPABLE OF LOSING.
VANTAGEPOINT’S MARKETING CAMPAIGNS, OF ANY KIND, DO NOT CONSTITUTE TRADING ADVICE OR AN ENDORSEMENT OR RECOMMENDATION BY VANTAGEPOINT AI OR ANY ASSOCIATED AFFILIATES OF ANY TRADING METHODS, PROGRAMS, SYSTEMS OR ROUTINES. VANTAGEPOINT’S PERSONNEL ARE NOT LICENSED BROKERS OR ADVISORS AND DO NOT OFFER TRADING ADVICE.