| This week’s stock analysis is United Rentals ($URI) |
United Rentals Inc. (URI) is a prominent company in the equipment rental industry. Established in 1997, it was founded by Bradley S. Jacobs. The company’s headquarters is in Stamford, Connecticut. With a focus on equipment rental services, United Rentals offers a diverse range of industrial equipment, tools, and construction machinery to various sectors, including construction, industrial, and commercial businesses.
The company generates revenue primarily through the rental and leasing of its equipment inventory. This includes equipment like aerial work platforms, earthmoving machinery, generators, power tools, and other construction-related equipment. United Rentals serves its clients on a short-term or long-term basis, providing them with the necessary tools to complete their projects efficiently.
The company’s fortunes are very much correlated to the ebb and flow of the construction industry. Traditionally when the economy is expanding, and people and companies are building, companies like $URI do well. This also however is the company’s Achilles heel because when the economy contracts, and enters slower periods of economic growth, people and businesses do not build.
United Rentals has made several strategic acquisitions to expand its market presence and enhance its offerings.
1. RSC Holdings Inc. (2012): This acquisition was one of the largest in the equipment rental industry. By acquiring RSC Holdings, United Rentals significantly expanded its equipment fleet and customer base, solidifying its position as a leader in the industry.
2. NES Rentals Holdings II Inc. (2017): The acquisition of NES Rentals allowed United Rentals to strengthen its presence in key markets, particularly in the Midwest and on the East Coast of the United States.
3. Neff Corporation (2017): With the acquisition of Neff Corporation, United Rentals further expanded its customer reach and increased its fleet of rental equipment, particularly in the construction and industrial sectors.
4. BlueLine Rental (2018): United Rentals acquired BlueLine Rental, which provided a boost to its capabilities in the construction and industrial equipment rental space. This acquisition also helped United Rentals extend its footprint across multiple regions.
United Rentals Inc. is among the leaders in the equipment rental industry, competing with other major players such as Ashtead Group (parent company of Sunbelt Rentals) and Herc Rentals.
The current main competitors of Sunbelt Rentals that are publicly traded are:
Ashtead Group plc (AHT): A UK-based company that operates in the US under the name Sunbelt Rentals.
Herc Holdings Inc. (HRI): Formerly known as Hertz Equipment Rental Corporation, Herc Holdings operates in the equipment rental sector primarily in North America.
H&E Equipment Services, Inc. (HEES): This company provides heavy equipment rental services in various parts of the US.
United Rentals’ main opportunities lie in the continued growth of construction and industrial activities, which drive demand for rental equipment. Additionally, as companies increasingly focus on cost efficiency, renting equipment instead of owning can provide them with financial flexibility. However, there are inherent risks in the business model, such as economic downturns affecting construction activity or potential fluctuations in rental rates.
The company’s product portfolio includes a wide range of equipment. Traditionally, heavy construction equipment rentals have been the most significant source of revenue.
Wall Street analysts have generally viewed United Rentals favorably due to its strong market position and consistent financial performance. The company’s strategic acquisitions and ability to cater to various industries have contributed to this positive perception.
In its niche, United Rentals has established itself as a leader due to its extensive equipment inventory, nationwide presence, and strategic acquisitions. The market cap of the company is $33.22 billion. It has a price-earnings ratio of 14.7. Its dividend yield is 1.22%.
In this stock analysis, we will evaluate the following metrics and indicators to determine what the best course of action is regarding $URI stock trading.
- Wall Street Analysts’ Estimates
- 52-week high and low boundaries
- Vantagepoint A.I. Forecast (Triple Cross)
- Neural Network Forecast
- On Balance Volume Analysis
- Daily Range Forecast
- Intermarket Analysis
- Our Suggestion
We don’t base decisions on things like earnings or fundamental cash flow valuations. However, we do look at them to better understand the financial landscape that a company is operating under.
Analysts Ratings
The very first thing we like to do in our analysis is to take a quick look at what the Wall Street Analysts are thinking about $URI.
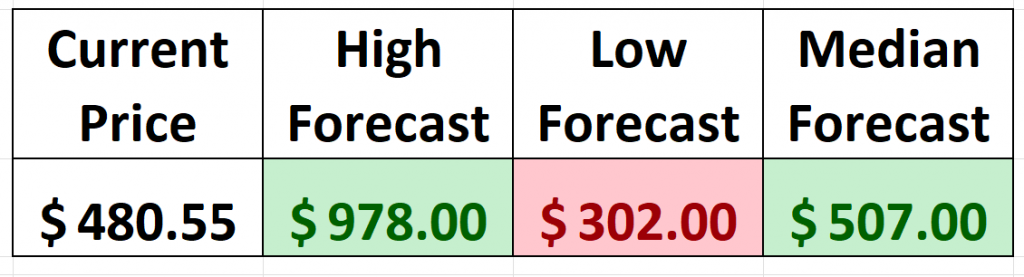
The 17 analysts offering 12-month price forecasts for United Rentals Inc have a median target of 507.00 , with a high estimate of 978.00 and a low estimate of 302.00 . The median estimate represents a +5.55% increase from the last price of $480.55.
This tells us that the brightest minds on Wall Street which watch the stock full time think that $URI has analysts believing it is undervalued. This should see higher than normal volatility which is perfect for Power Traders.
However, we can also get an estimate of future expected volatility by subtracting the low estimate ($302) from the high estimate ($978 ) and dividing that value ($676) into the current price ($480.55). This practical exercise tells us that Wall Street Analysts have a massive variance of opinion which amounts to 140% of the current price.
A good rule of thumb to follow is that the higher the variance among Wall Street Analysts the greater the volatility of an asset. Volatility is what creates movement. As traders we must respect and understand that movement cuts in both directions.
52-week High-Low Chart
Next, we want to see where we are trading in relation to the 52-week range.
Over the last 52 weeks, $URI has traded as high as $492.22 and as low as $256.23. This provides us with an annual trading range of $235.99. It is currently trading up against its 52-week high as well as making new 10-year highs.
Longtime readers of our stock studies recognize that one of our favorite all-time filters is looking for stocks that are simultaneously making new 52-week highs and new 10-year highs. When this occurs, you need to put these assets under the microscope and try to understand why they are moving up and breaking new ground.
The 52-week low price boundary isn’t just a random figure on the charts – it’s a crucial touchstone that seasoned traders have on their radar, and for a multitude of compelling reasons.
Let’s break it down.
First off, this boundary isn’t just a number; it’s a benchmark for “fair value.” The pros use it to gauge whether a security is trading within a reasonable range considering its recent performance. Essentially, it’s like a litmus test for whether a stock is being priced sensibly.
But the plot thickens. Professional traders often scour the terrain around the 52-week low boundary for signs of a bottoming-out phenomenon. It’s like catching the first few notes of a brand-new symphony – a hint that the security might be ready to launch into a fresh uptrend. This, my friends, is where the pros separate themselves from the pack, as they’re adept at identifying potential turnarounds before the rest of the market catches on.
So, whether you’re crunching numbers or reading tea leaves, this 52-week low boundary isn’t just a line on a chart; it’s a pivotal touchpoint that experts use to inform their trading moves. Think of these boundaries the way that a long distance thinks of their best and worst times in a race.
Now, let’s talk about a real power move – an asset scaling new heights, hitting not just 52-week highs, but simultaneously, 10-year highs. That’s a signal that shouldn’t be taken lightly. It’s not just about breaking records; it’s about shattering expectations and painting a picture of exceptional resilience and performance.
Imagine this: an asset isn’t just outpacing its recent past; it’s leaving its long-term history in the dust. This, my friends, is a bullish trend that has not only stood strong against the tests of time but has defied the whims of market volatility.
So, why is this such a market game-changer? Psychology plays a pivotal role. These new highs are like a siren’s call, luring in investors and generating a buzz of optimism and momentum. It’s the ripple effect – more investors jump aboard, driving the price even higher. It’s like a virtuous cycle of success.
This isn’t just a casual phenomenon; it’s a yardstick for growth and expansion. Analysts on Wall Street exhaustively dissect every tidbit of fundamental data to forecast and comprehend growth. As traders, we want to position ourselves where growth’s happening and let A.I., neural networks, and machine learning navigate the course.
If you’re seeking to make great trades and better trading decisions, this is a vital part of your playbook. So, remember, it’s not just about knowing where these boundaries sit, it’s about embracing the dance between them. It’s your toolkit for today’s trading challenges.
Spotting an asset scaling both 52-week and 10-year highs is often like striking gold. It’s not just about the numbers; it’s about capturing a moment of strength and momentum, harnessing an asset’s growth potential. Just look at United Rentals ($URI) journey.
Additionally, what we often like to do as well is to divide the annual trading range ($235.99) by the current price ($477.82) to provide us with a very basic and generic calculation of how the annualized volatility for $URI, which is currently 49.4%.
What this number tells us is that we can define NORMAL for the next year that $URI could trade in a range 49.4% higher and or lower than the current price.
We always advise traders to pay attention to the 52-week high boundary and to view it in relation to what is happening in the broader market. The 52-week high when breached successfully is usually a launchpad for higher prices. However, this boundary is also a stall zone for rallies.
Our experience has been that when a company successfully breaches a 10-year high and a 52-week high you should pay attention and place this candidate on your radar. These instances are rare and are indicative of a company that is consistently growing.
$URI clearly is in this category as highlighted by the following two charts.
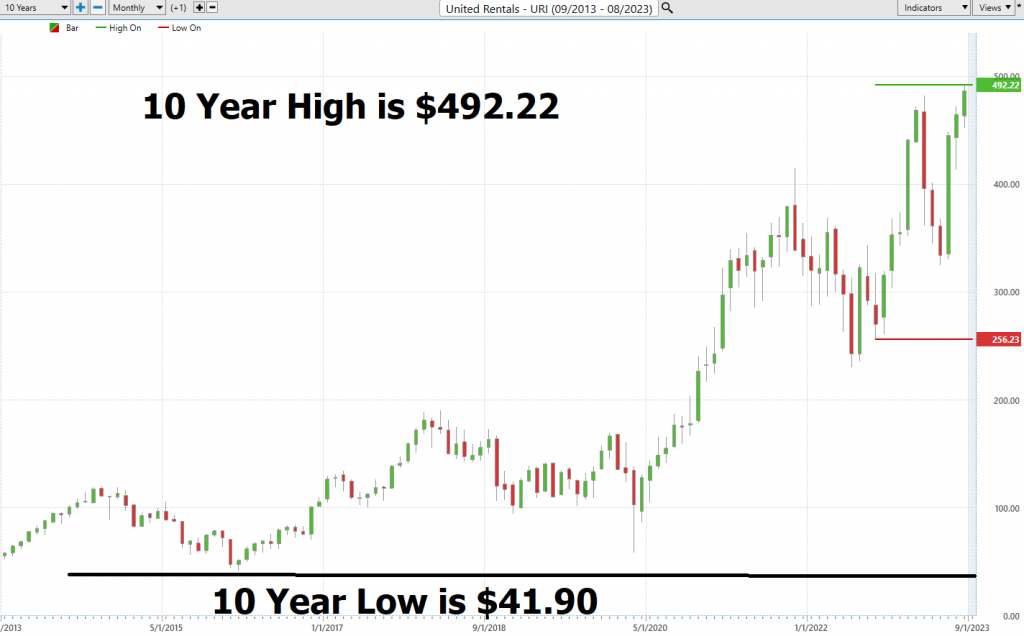
Here is the 10 Year Chart on $URI.
Best Case – Worst-Case Scenarios
Over the last 5 years, $URI shares are up 221%.
Over the last 10 Years $URI is up 746%.
Over the last 52 weeks, $URI shares are up 49.1%
When we study the long term 52-week chart we can look at the best case and worst-case scenarios just to get an eyeball perspective of the risk and volatility of this asset. This is worth doing anytime you invest or trade to monetarily understand what the potential risks and rewards have been over the past year.
This exercise provides a snapshot of the best rallies and worst drawdowns that $URI has experienced over the past year measured on a percentage basis.
Here is the best-case analysis on $URI.
Followed by the worst-case analysis:
It’s worth doing this type of baseline analysis because it allows you to quickly understand the real risk and opportunity associated when trading $URI. Observe how the best rallies and worst declines often stay within the statistical volatility estimate of + and – 49.4% which we discussed in our analysis of 52-week boundaries.
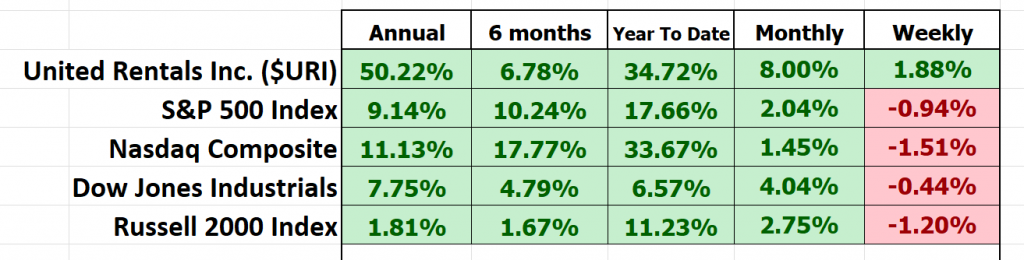
Next, we compare $URI to the major broad market indexes. By doing this we can easily see that $URI has outperformed the broader market but has done so with significantly more volatility. Traders refer to this as BETA. The beta (β) of a stock is a measure of its volatility in relation to the overall market, typically a broad market index like the S&P 500. In essence, beta represents the stock’s sensitivity to market movements.
Here’s a simple way to understand what BETA means:
Beta = 1: The stock’s price is expected to move in line with the market. For example, if the market goes up by 5%, a stock with a beta of 1 is also expected to go up by 5%.
Beta > 1**: The stock is more volatile than the market. A beta of 1.5, for instance, suggests that the stock is 50% more volatile than the market. So, if the market goes up by 5%, the stock might go up by 7.5% (and vice versa).
Beta < 1**: The stock is less volatile than the market . A beta of 0.5 indicates that the stock is 50% less volatile than the market. If the market goes up by 5%, the stock might go up by only 2.5%.
The BETA on $URI is 1.89 and is measured on a 5-year monthly basis.
Beta is based on past data, and past performance is not always indicative of future results. A high beta does not necessarily mean high returns. It simply indicates higher volatility and, therefore, potentially higher risk.
Investors use beta to understand and measure the risk of a particular stock relative to the risk of the broader market. It helps in constructing portfolios that align with an investor’s risk tolerance and investment objectives.
So, in $URI have an asset which has outperformed the broader stock market indexes but has done so with significantly greater volatility.
Measured by any comparative performance metric, $URI has been a solid and stellar performer. Based upon all of our analysis so far, we would place it firmly on your trading radar as stocks like this will offer numerous trading opportunities in the coming year.
The Vantagepoint A.I. Triple Cross Indicator
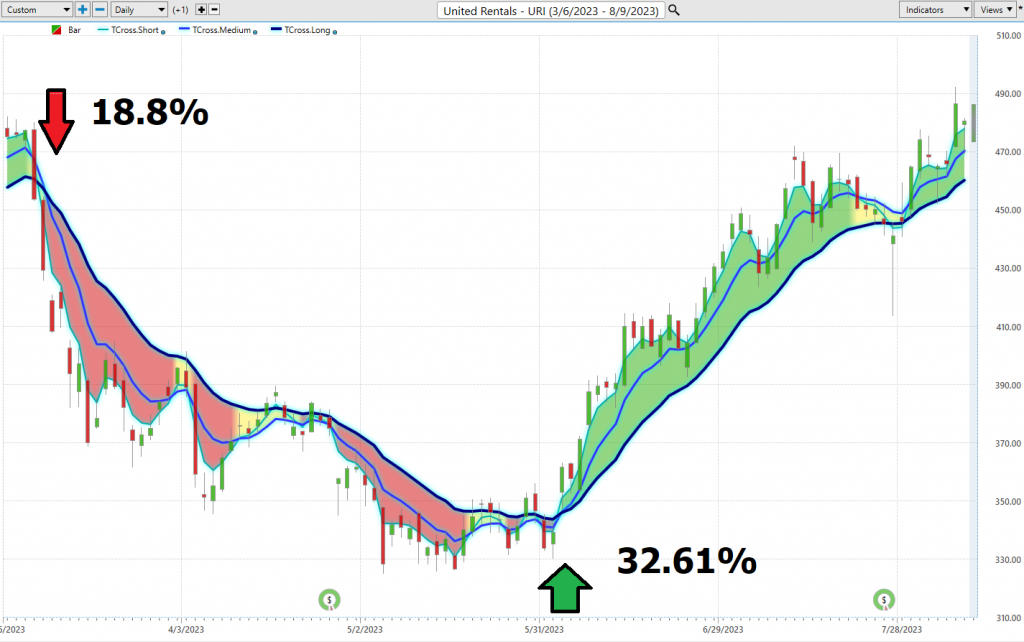
In the world of finance, the Vantagepoint A.I. Triple Cross indicator stands out as a beacon of innovation. instead of the conventional duo of moving averages, this game-changer employs a three predictive moving average. We’re talking about a 3-day, an 8-day, and an 18-day predictive moving average, each tailored to capture the nuances of short-term, medium-term, and long-term market movements.
Here’s the genius behind it: The Triple Cross doesn’t rush. It’s like a seasoned Wall Street veteran, waiting for the right moment, sipping his morning coffee while watching the numbers. When the short-term average dances past the medium-term, it’s akin to the first chime of the opening bell, hinting at a possible shift in the market winds. But the real action begins when the medium-term gracefully overtakes the long-term average. That’s the market’s symphony reaching its crescendo, signaling a confirmed trend change. It’s the harmony of these three averages that sets the stage for a market performance.
What’s truly remarkable is how the Triple Cross indicator, with its trio of predictive data, offers traders a sharper edge. It cuts down the noise, shields them from the pitfalls of hasty decisions, and guards against the deceptive lures of a tumultuous market.
In the grand theater of trading, the Triple Cross Indicator shines as a leading actor, adept at spotting the early signs of a plot twist, backed by the supporting roles of its three moving averages. It promises not just more trades, but smarter ones, elevating the art of trading to a masterful performance.
Now, for a real treat, let’s dive into the recent performance of United Rentals ($URI). The charts, as they say, don’t lie.
Power traders use the Triple Cross Indicator to help determine both the value zone as well as the trend direction.
Fine Tuning Entries with The Neural Net Indicator
In the financial charts, the Neural Network Indicator forecasts market momentum. Green indicates strength; red suggests short-term market weakness. Essentially, a Neural Net is a sophisticated computational system that interprets vast data, refining its performance over time.
Originating from 1950s research at institutions like Cornell and Carnegie Mellon, these computer algorithms identify asset price trends to predict market movements. Their design mirrors human neural and memory functions, making decisions based on patterns rather than set rules. Their complexity varies, with some handling extensive datasets for intricate modeling. Today, they’re integral to trading, with firms like Vantagepoint A.I. leveraging them for predictive stock analytics. Major banks, including Goldman Sachs and JPMorgan Chase, depend on neural networks for global trading decisions, underscoring their future significance in finance.
For optimal trading, Power Traders seek a DOUBLE confirmation signal: alignment between the blue predictive line and the Neural Net’s forecast. The arrows on the chart are all of the moments when the Neural Index and the Triple Cross Indicator were aligned and both pointing in the same direction.
Using AI and machine learning, neural networks are invaluable for predicting stock prices, analyzing vast financial data, and spotting anomalies. Power Traders combine neural network insights with AI for reliable trading opportunities.
We advocate that Power Traders cross reference the chart with the predictive blue line and neural network indicator to create optimal entry and exit points.
Power Traders are always looking to apply both the neural network and a.i. to the markets to find statistically sound trading opportunities.
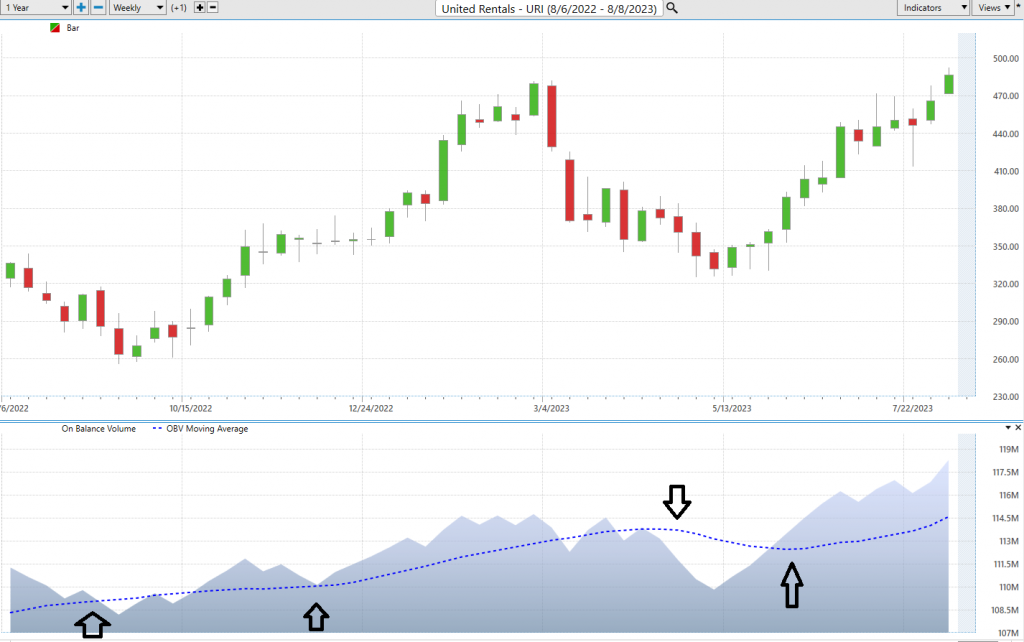
On Balance Volume Analysis
The main concept behind On Balance volume is that changes in trading volume can provide valuable insights into the strength of a price trend. OBV considers both the volume and price movement of an asset and attempts to identify trends and potential reversals .
You can read more about how to apply On Balance Volume to your trading by clicking here.
OBV serves multiple purposes in a trader’s toolkit.
Firstly, it can help identify accumulation and distribution phases, indicating whether a security is being bought or sold heavily .
Secondly, divergence between price and OBV can signal potential trend reversals.
Moreover, OBV can be used to confirm the strength of trends, providing traders with more conviction in their trading decisions.
Essentially, On Balance Volume (OBV) is a momentum-based technical indicator that assesses buying or selling pressure on an asset.
What we want to see when looking to buy an asset is that the slope of the OBV moving average is aligned with the trend of the asset we are studying.
The theory is that VOLUME precedes price.
In applying this analysis to $URI we clearly see that BUYING VOLUME has clearly been supporting the rallies in the stock.
What On Balance Volume is doing is differentiating between BUYING Volume and Selling Volume.
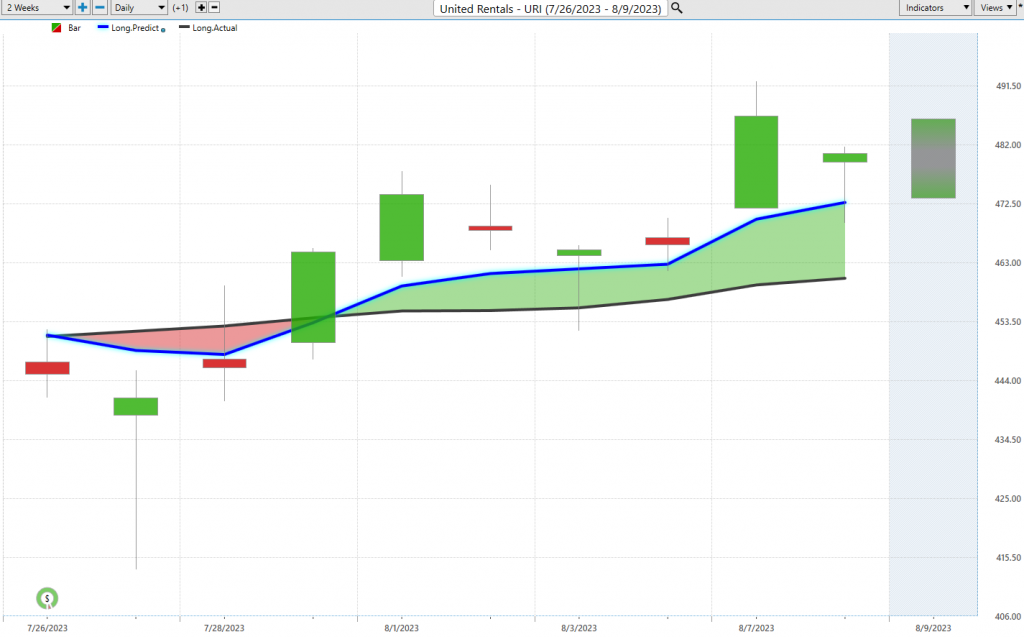
VantagePoint Software Daily Price Range Prediction
The purpose of all these indicators so far is to help traders stay on the right side of the right trend at the right time.
One of the powerful features in the Vantagepoint A.I. Software which Power Traders use daily is the Daily Price Range prediction forecast.
This forecast is what permits Power Traders to truly fine tune their entries and exits into the market, often looking for smaller time frames and more granular trading opportunities.
Over the past year this following graphic shows what the average trading ranges for $URI have been on a daily, weekly, and monthly basis. This is a measurement of what has occurred. It also provides a guide to what short-term swing traders can expect over a given time frame.
In the high-stakes world of trading, pinpointing value and discerning entry and exit points are paramount. Enter Vantagepoint A.I.’s Daily Range forecast, a tool that delivers this intel with surgical precision. Harnessing AI, machine learning, and neural networks, it crafts a daily forecast for each trading session, guiding traders to strategically navigate market trends.
Intermarket Analysis
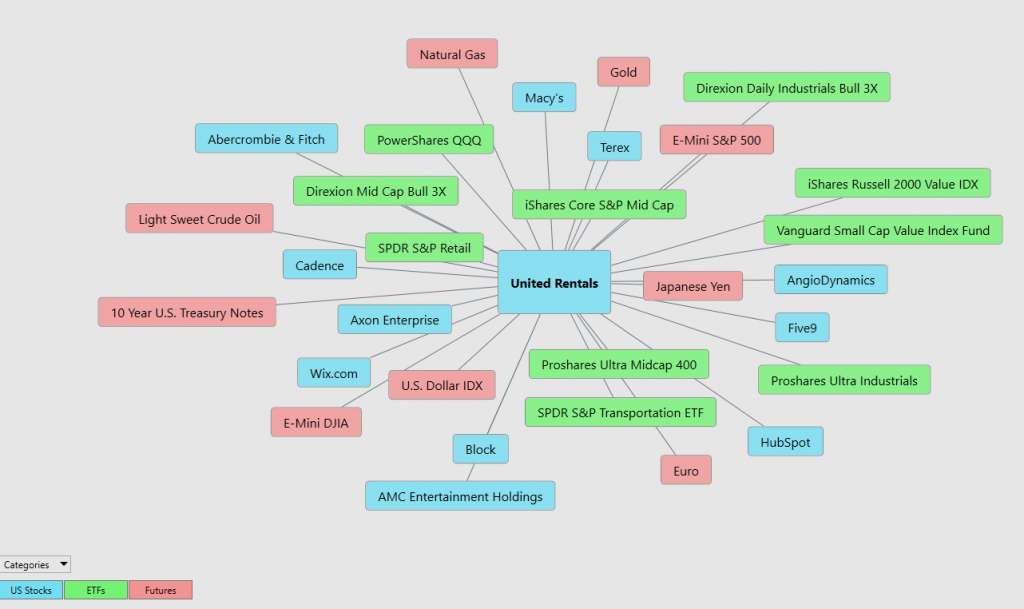
What makes the Vantagepoint Software truly unique is its ability to perform Intermarket analysis and to locate those assets which are most interconnected that are responsible for driving the price of $URI higher or lower.
Studying the charts can always provide objective realities in terms of locating support and resistance levels which become very clear on a chart. But we live in a global marketplace. Everything is interconnected. The billion-dollar question for traders is always what are the key drivers of price for the underlying asset that I am trading?
These intangibles are invisible to the naked eye yet show extremely high statistical correlations.
The concept of intermarket analysis was first introduced by renowned economists like Jacob Frenkel, Alfred Chandler, and Robert Shiller who believed that the interaction among different markets could impact aggregate economic performance. In financial trading this type of research was pioneered by Vantagepoint A.I. founder, Lou Mendelsohn.
In the intricate web of global finance, a ripple in one market can cascade across commodities, bonds, stocks, and currencies. Recognizing these correlations is pivotal for traders to forecast market shifts and craft potent strategies. Intermarket analysis, a tool primarily in the arsenal of institutional investors, evaluates asset prices across sectors, balancing profit potential with portfolio risk. Enhanced by modern data technologies, this approach is now within reach of individual investors. It illuminates the interdependencies across assets and regions, enriching traders’ decision-making toolkit. By integrating technical and intermarket analyses, traders can discern nuanced market relationships, positioning themselves ahead of global economic shifts. Variables like interest rate increases, oil price fluctuations, and dollar volatility shape corporate decisions in today’s volatile landscape, and discerning these factors remains a paramount challenge for market players.
There is immense value to be had in studying and understanding the key drivers of $URI price action.
By doing so you can often see which ETFs are most likely acquiring $URI as well as uncovering other industries, commodities, forex which affect $URI price movement.
Here is a graphic worthy of your further study. It displays the top 31 drivers of $URI’s price action.
Our Suggestion
$URI is a great momentum and volatility play. Every great trend must climb a wall of worry. For $URI since it services the construction industry, a slowdown in economic growth will cause huge problems. Internally the management team at $URI is betting that the government’s commitment to infrastructure will continue to bolster sales and performance.
On the positive side, $URI is a market leader in the Equipment rental business . On the negative side it has a cash-to-debt ratio of only .02 . The cash-to-debt ratio is a financial metric that measures a company’s liquidity position by comparing its total cash and cash equivalents to its total debt.
While you would expect an equipment rental business to have a low cash-to-debt ratio, this metric appears unequivocally low.
The cash-to-debt ratio provides insights into a company’s ability to cover its outstanding debt with its available cash. A higher ratio indicates that the company has more cash relative to its debt, suggesting better financial health and a lower risk of default. Conversely, a lower ratio indicates that the company has less cash compared to its debt, which might raise concerns about its ability to meet its debt obligations during a slowdown.
A cash-to-debt ratio of 0.02 means that for every dollar of debt the company has, it has $0.02 in cash and cash equivalents. This is a very low ratio, indicating that the company has very little cash relative to its debt. Such a situation might be concerning for investors and creditors, as it suggests that the company might face challenges in servicing its debt, especially if it encounters any financial difficulties or unexpected expenses. It’s important to note, however, that the ideal cash-to-debt ratio can vary by industry, and some industries might naturally have lower ratios due to their business models.
While we are traders and not long-term investors, we need to look at the fundamental backdrop that a company is operating under. A low cash-to-debt ratio is another one of those metrics that contributes to higher-than-normal volatility, and we must recognize this as part of our decision-making process.
However, based upon its relative performance to the broader stock market as well as its industry this is a company you should put firmly on your radar and monitor closely. We think it will offer great trading opportunities moving forward.
$URI looks bullish. The trend is UP. Volatility is high.
We will use the Vantagepoint A.I. daily range forecast to guide our decisions moving forward.
We urge all traders to practice good money management and allow the artificial intelligence to guide your decision-making process.
As mentioned earlier in this analysis, whenever a stock makes 10-year highs you need to place it on your radar as it is communicating to the world that it is growing and overcoming all obstacles related to its business model.
Pay attention to $URI.
Let’s Be Careful Out There!
Remember, It’s Not Magic.
It’s Machine Learning.
Disclaimer: THERE IS A HIGH DEGREE OF RISK INVOLVED IN TRADING. IT IS NOT PRUDENT OR ADVISABLE TO MAKE TRADING DECISIONS THAT ARE BEYOND YOUR FINANCIAL MEANS OR INVOLVE TRADING CAPITAL THAT YOU ARE NOT WILLING AND CAPABLE OF LOSING.
VANTAGEPOINT’S MARKETING CAMPAIGNS, OF ANY KIND, DO NOT CONSTITUTE TRADING ADVICE OR AN ENDORSEMENT OR RECOMMENDATION BY VANTAGEPOINT AI OR ANY ASSOCIATED AFFILIATES OF ANY TRADING METHODS, PROGRAMS, SYSTEMS OR ROUTINES. VANTAGEPOINT’S PERSONNEL ARE NOT LICENSED BROKERS OR ADVISORS AND DO NOT OFFER TRADING ADVICE.