| This week’s stock analysis is Childrens Place – ($PLCE) |

In the bustling arena of children’s fashion, The Children’s Place, Inc. is a standout player. This dynamic company is all about delivering apparel, footwear, accessories, and other items that capture the spirit of childhood. The firm’s dedication to style and value shines through its exclusive brands: The Children’s Place, Baby Place, and Gymboree.
The Children’s Place, Inc. operates in two distinct segments: The Children’s Place U.S. and The Children’s Place International. The U.S. segment includes the company’s stores in the U.S. and Puerto Rico, as well as its U.S.-based wholesale business. The Children’s Place International segment, on the other hand, covers the company’s Canadian stores, its Canadian-based wholesale business, and its international franchisees.
The Children’s Place, Inc. was born in 1969, thanks to the vision of David Pulver and Clinton A. Clark. Today, the company’s headquarters are located in Secaucus, New Jersey. From this base, The Children’s Place, Inc. continues to delight children and parents with its fashionable and affordable offerings.
In a move that has sent a wave of optimism rippling through the investor community, CEO Jane Elfers recently made a significant personal investment in the company. The news that Elfers purchased 43,000 shares at an average price of $23.70 per share has led to a sharp rebound in the company’s stock. This substantial purchase, totaling just over $1 million, was duly reported in a Form 4 regulatory filing.
Elfers’ investment is a powerful vote of confidence in The Children’s Place. It’s a clear demonstration that she is not just leading the company but is also personally invested in its success. With this latest acquisition, Elfers now holds a total of 370,033 shares of The Children’s Place stock. Given the recent rise in the stock’s price, this represents a holding of more than $10.9 million in a company with a market cap just shy of $372.5 million. CEO Jane Elfers controls 2.86% of the shares of the company.
The Form 4, filed with the Securities and Exchange Commission (SEC), does not provide any specific reasons for the transaction. As is customary, neither Elfers nor The Children’s Place has made any public comment on the purchase. Companies and executives typically remain silent about their personal investment activities.
However, when a key executive makes such a substantial and sudden investment, it sends a potent signal of confidence in the company’s future. This move by Elfers certainly places The Children’s Place in the spotlight as a company to watch closely.
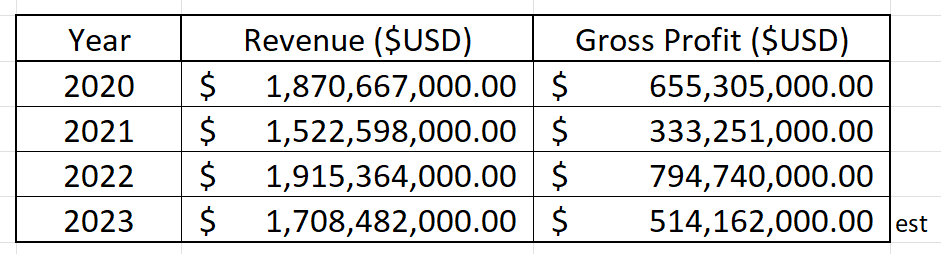
On the flip side of that optimism are the companies’ revenues and profits, which are lower today than they were in 2020. Bears on Wall Street look at this contraction as a reason to sell the stock short. During 2021, $PLCE lost 94% of its value! Skeptics claim that the large purchase of shares from CEO Jane Elfers simply triggered a short-covering rally in the shares.
The Children’s Place is working diligently to bolster its performance by expanding its customer base, elevating brand recognition, offering superior products, and enhancing its digital reach. The company’s strategic growth initiatives and focus on inventory optimization are set to provide a boost in the latter half of fiscal 2023.
In a bid to engage more effectively with customers, streamline its supply chain, and enhance financial flexibility, The Children’s Place is strategically investing in digital platforms. It’s noteworthy that digital sales accounted for 48% of total retail sales in fiscal 2022. The company’s leadership anticipates that by fiscal 2025, digital revenues will represent about 60% of retail sales, translating to more than $1 billion in sales.
The Children’s Place is also committed to optimizing its store fleet. In line with this strategy, the company plans to close approximately 100 stores, with the majority of closures taking place in 2023. By the start of 2024, the company aims to operate an optimized fleet of around 500 stores. These closures align with the company’s shift towards digitization, reflecting the evolving shopping habits of consumers.
As the global supply chain environment gradually normalizes, The Children’s Place anticipates a decline in costs in the second half of fiscal 2023. The company expects to see an annualized benefit of more than $100 million in 2023 from this cost reduction.
However, The Children’s Place is not without its challenges. The company has been wrestling with subdued consumer demand due to high inflation and increased promotional activity from key competitors. Given the challenging macroeconomic environment, the company has revised its outlook for fiscal 2023. It now projects net sales in the range of $1.575-$1.590 billion, down from the previous guidance of $1.62-$1.66 billion. This forecast indicates a decline from the $1.71 billion reported in fiscal 2022.
In 2019, The Children’s Place operated 961 stores in the United States, Canada, and Puerto Rico. At this writing, they have 525 stores. By the end of 2023, analysts expect them to have only 500 stores or less. With these massive store closures, the company has also laid off over 17% of its workforce in just the past year.
Earnings on $PLCE have declined by 0.5% per year over the past 5 years. Debt is not well covered by operating cash flow. The share price has been volatile over the past 3 months. Analyst Forecasted Target price is lower than the current share price.
In this weekly stock study, we will look at and analyze the following indicators and metrics which are our guidelines to dictate our behavior regarding any stock analysis.
- Wall Street Analysts’ Estimates
- 52-week high and low boundaries
- Vantagepoint A.I. Predictive Blue Line
- The Best Case – Worst Case Scenarios
- Neural Network Forecast
- Daily Range Forecast
- Intermarket Analysis
- Our trading suggestion
We don’t base our trading decisions on things like earnings or fundamental cash flow valuations. However, we do look at them to better understand the financial landscape that a company is operating under.
Wall Street Analysts’ Estimates
The 4 analysts offering 12-month price forecasts for Children’s Place Inc ($PLCE) have a median target of $26.00, with a high estimate of $43.00 and a low estimate of $20.00. The median estimate represents a -12.96% decrease from the last price of $29.87.
When we subtract the low forecast of $20 from the high forecast of $43, we end up with a variance of $23 which is extremely high for a stock priced at $29.87.
This giant variance is a roadmap to massive fluctuations in price and volatility.
We love to see this heavily divergent opinion as it tells us that volatility is baked into the mix.
52-Week High and Low Boundaries
Over the past year we have seen $PLCE trade as low as $14.27 and as high as $57.00. This tells us that the annual trading range is $42.73.
We also like to divide the annual trading range of $42.73 by the current price of $29.87 to get a broad-based estimate of trading volatility. This tells us that the volatility of $$PLCE over the past year has been 143%%. This value also provides us with a basic estimate in letting us know that if the future is like the recent past, it would be normal for $$PLCE to trade in a range that is 143% higher and lower than the current price over the next year.
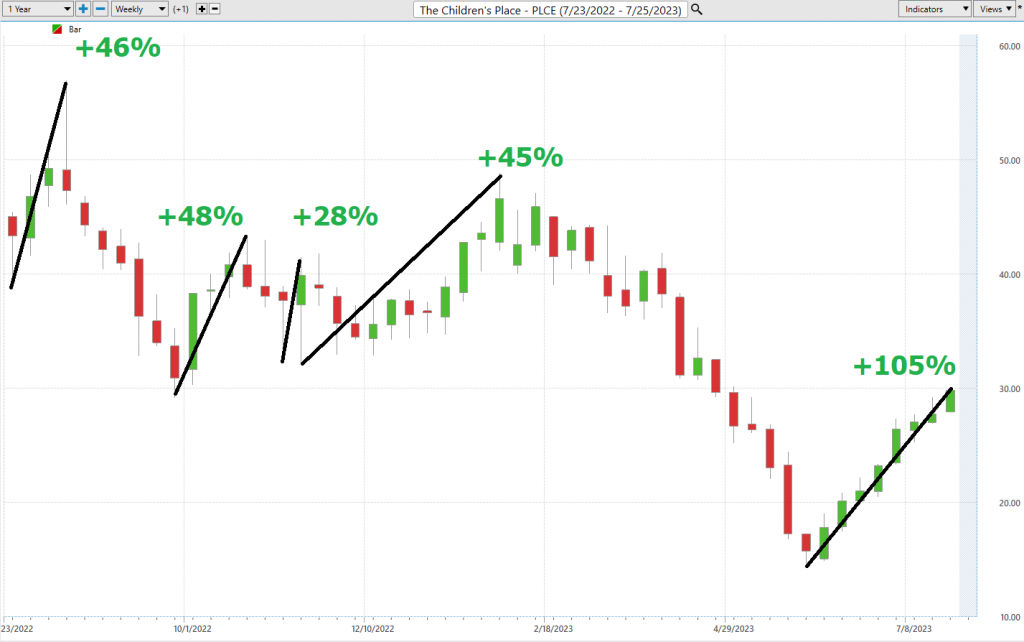
Here is the annual 52-week chart of $$PLCE so that you can see the powerful price journey it has taken over the last few months.
In the world of professional trading, the 52-week low price boundary holds a significant place. It’s a beacon that guides traders in determining the “fair value” of a security. It also helps them identify when a security is “cheap” or trading notably below its analyst estimates, which could signal a lucrative buying opportunity. Furthermore, these seasoned traders often watch for a bottoming price action near the 52-week low boundary, a sign that the security might be on the cusp of a new uptrend. Therefore, the 52-week low boundary is a crucial tool in their analytical arsenal.
Typically, when a stock hits a 52-week low, it’s seen as a negative indicator. If the stock continues to plummet and sets a new 52-week low, it’s often viewed as a harbinger of more negativity. However, when the low price level is tested repeatedly and holds firm, it’s time to sit up and take notice. Often, this bottoming price action can trigger impressive price rallies. This is precisely what we’ve seen with $PLCE, which has surged a remarkable 107% off its 52-week lows in the past 45 trading sessions.
Interestingly, this is what occurred with $PLCE. The stock bottomed on June 1 st , 2023. When CEO Jane Elfers purchased $1 million more of $PLCE it was July 5 th . This vote of confidence by an insider was perceived by traders that the market had in fact bottomed and was indicative of a trend change.
Power Traders often juxtapose these broad volatility estimates with Wall Street Analysts’ estimates to gain a comprehensive understanding of the price action in $PLCE.
It’s also beneficial to take a step back and examine the longer-term 10-year monthly chart for $PLCE. Simply observe what is obvious. The stock had lost 94% of its value in 2021. Currently, $PLCE is trading in the 37 th percentile of its 52 week range.
Best Case – Worst Case Scenario $PLCE
When we delve into a trade or a long-term investment opportunity, it’s crucial to compare the highest rallies to the steepest declines. This comparison gives us a clear picture of the asset’s real-time volatility and allows us to juxtapose the performance of the asset we’re considering with the returns of the major market indexes.
Statistical annualized volatility is a gauge of the degree of variation in a stock’s price over time. It’s the estimated standard deviation of price movements during regular market trading. To put it in numbers, the longer the time period used to calculate its average, the more precise and realistic it becomes in forecasting future performance. But instead of just treating this as a number, we prefer to examine the charts from a best-case analysis and worst-case analysis perspective. This approach gives us a genuine assessment of what this volatility signifies in terms of potential performance.
Successful trading is always about being acutely aware of an asset’s potential volatility. As traders, we’re on the lookout for MOTION. But remember, motion is a double-edged sword. By initially examining rallies and declines, we can swiftly determine whether an asset is retaining its gains or not. Bear in mind that $PLCE has an annualized volatility of 143%. This figure means that it’s “NORMAL” for the stock to be 143% higher or lower over the next 12 months.
Here is the BEST-CASE analysis.
Followed by the WORST-CASE Analysis:
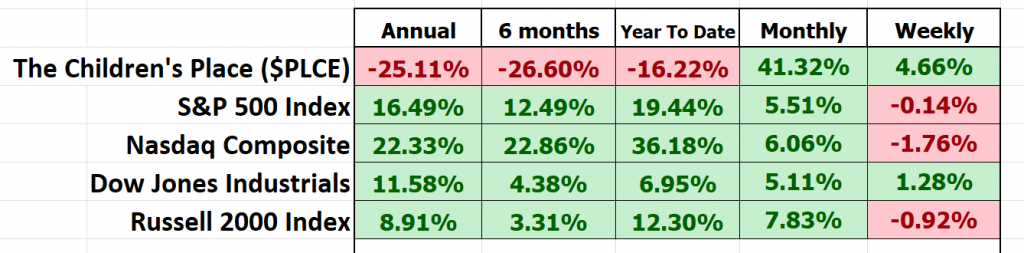
Next, we compare the performance of $PLCE to the broader major stock market indexes.
What we can quickly see through this simple analysis is that $PLCE outperformed over the shorter time frames, while it massively underperformed the broader stock market indexes over the longer-term time frames.
The following comparison graphic is of $PLCE to the $SP500 over the last 5 years. It shows that over the last 5 years $PLCE is down 79% while the $S&P500 Index is up 57%.
What we can easily conclude from this analysis is that regardless of the PR floating around in the trading space regarding the rebuilding efforts of $PLCE, this is clearly a hit-and-run trading vehicle. Out loyalty is to the trend and only to the trend!
Vantagepoint A.I. Forecast Predictive Blue Line
Let’s do some basic trend forecasting analysis based upon looking at the VantagePoint predictive blue line over the last year. On the following chart you will see the power of the VantagePoint Predictive blue line which determines the medium term trend price forecast.
The guidelines we abide by are as follows:
- The slope of the predictive blue line determines the trend and general direction of $PLCE
- When the blue line turns above the black line an UP opportunity occurs
- When the blue line turns below the black line a DOWN opportunity occurs
- Ideally, the VALUE ZONE is determined to try and buy the asset at or below the predictive blue line.
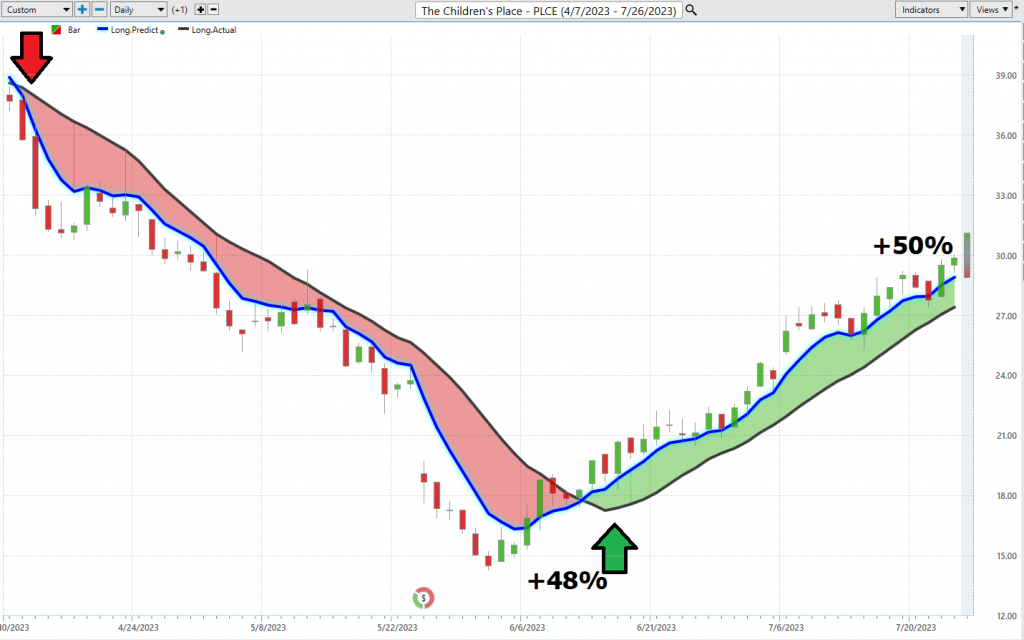
Over the last 4 months there have been 2 trading opportunities. Both have been winners.
Trade #1 generated 48% on the short side of the market in 46 days.
Trade #2 generated 50% in 29 sessions.
This is the power and effectiveness of the Vantagepoint A.I. forecast in assisting traders to stay on the right side of the trend at the right time.
The predictive blue line is the initial indicator which Power Traders use to monitor and navigate the trend.
Next traders cross-reference this signal with the historical pattern recognition available with machine learning and the Neural Index.
Neural Network Indicator (Machine Learning)
In the realm of trading, the Neural Network Indicator, located at the bottom of the chart, plays a pivotal role in predicting future short-term market strength or weakness. When the indicator is green, it signals market strength. Conversely, when it’s red, it forecasts short-term market weakness.
A neural network, in essence, is a computational system modeled after the human brain. It consists of input nodes, output nodes, and hidden nodes. The input nodes receive information from the external world, while the output nodes relay information to it. The hidden nodes, neither input nor output, process information internally. These networks learn by adjusting the weights of the connections between nodes, with stronger connections having more influence. Neural networks are versatile, capable of tasks such as pattern recognition and data classification.
At its core, a Neural Net is a learning system that uses a network of functions to interpret and translate vast amounts of data into a desired output, continually self-monitoring and enhancing its performance. Trading neural networks are used to identify patterns in large data sets, which can then be used to predict future market movements. They perform complex statistical and probability analysis on historical data, as well as multi-variable analysis on current market conditions, generating trading signals with high accuracy. Neural networks have proven to be an invaluable tool for traders seeking to gain an edge in the markets.
When Power Traders are on the hunt for statistically valid trading setups, they look for a DOUBLE confirmation signal. This signal arises when both the blue predictive line and the Neural Net suggest the same future expected outcome.
We recommend Power Traders to cross-reference the chart with the predictive blue line and the neural network indicator to pinpoint optimal entry and exit points. Traders seek confirmation on the Neural Net to position themselves for LONG or SHORT market opportunities. In other words, when both the A.I. forecast and the Neural Net are green, it signals a buying opportunity. Conversely, when both are red, it indicates a selling opportunity. The arrows on the chart below highlight the trading zones wherePower Traders could have used this double-confirmation strategy to identify a buying opportunity.
Power Traders are consistently seeking ways to apply both the Neural Network and A.I. to the markets to uncover trading opportunities that are statistically robust. This approach, when used effectively, can provide a significant edge in navigating the complexities of the market.
VantagePoint Software Daily Price Range Prediction
One of the powerful features in the VantagePoint Software which Power Traders use daily is the Price Range prediction forecast.
This forecast is what permits Power Traders to truly fine tune their entries and exits into the market.
Every day traders are faced with the anxiety and frustration of wondering where they should be looking for opportunities to buy and sell the market. VantagePoint’s A.I. makes this decision super easy with the Daily Price Range Forecast. This is where the rubber meets the road.
Many factors can affect the daily price range of stocks, from global political events to the weather. As a result, forecasting the daily price range is a complex task that requires careful analysis. There are a number of methods that can be used to forecast daily price ranges, including technical analysis, fundamental analysis, and news-based analysis. Technical analysis involves studying past price movements to identify patterns that may provide clues about future price behavior. Fundamental analysis focuses on economic indicators such as company earnings and interest rates. News-based analysis involves tracking breaking news stories that could have an impact on the stock market. Vantagepoint A.I. uses a proprietary algorithm that combines the power of a.i., neural networks and machine learning to provide a daily price range forecast. By using a combination of these methods, it is possible to develop a more accurate forecast of the daily stock market price range.
Now, the genius of VantagePoint A.I. lies in its proprietary algorithm that merges the might of artificial intelligence, neural networks, and machine learning. It weaves together these forces to craft a daily price range forecast like no other—a forecast that stands head and shoulders above the rest in terms of accuracy.
In the quest for steady gains, investors of every stripe, whether individual or institutional, must diligently analyze stock prices each day. This is where VantagePoint’s meticulous tracking of patterns over time comes into play, enabling informed and statistically sound investment decisions.
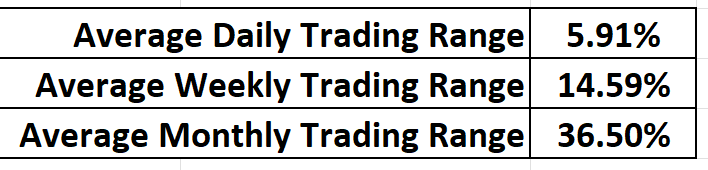
Historically speaking this is what last year’s average trading ranges on the daily, weekly, and monthly time frames look like.
Here is the price chart of $PLCE during the most recent four months. The software very clearly delineates the daily forecast by providing an exact lower and upper boundary and specifies the short-term trend.
This chart helps traders decide where stop placement should occur. Observe how placing protective sell stops below the dark line on the chart was a powerful way to minimize risk on this trade.
See how the upper and lower bands of the price range forecast for a clear channel of trading activity as well. Swing traders are always looking for opportunities to buy towards the bottom of the predicted channel and selling opportunities above the top band.
Intermarket Analysis
Power lies in the way we respond to the truth we understand.
That is a powerful fact that traders use effectively in their decision-making process.
One of the supremely important questions in trading is what is driving the price? Headlines often create interesting narratives. But these “stories” only capture the imagination. Traders want and need to understand the cause and effect of price movement.
The only way to get an answer to this important question is through Intermarket analysis which looks at statistical price correlations of assets.
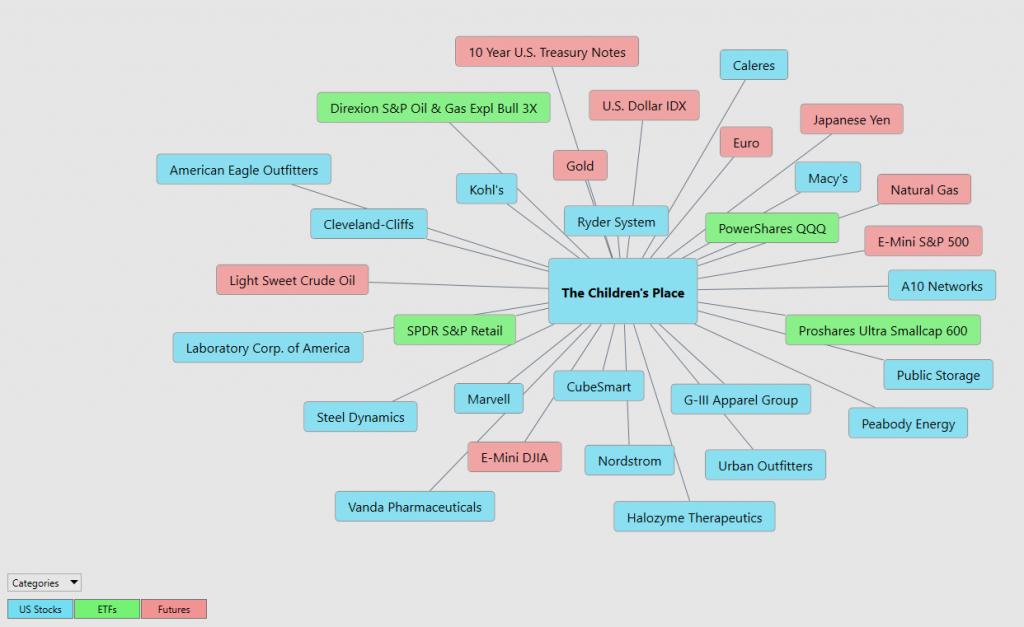
The following graphic shows you the top 31 drivers of $PLCE’s price action.
So, a study of the relationship(s) will prove to be beneficial to a trader.
Intermarket analysis is a crucial discipline for traders that involves studying the relationships and correlations between various financial markets, including stocks, bonds, commodities, and currencies. By understanding how changes in one market can impact others, traders gain valuable insights into potential trends and market movements. Studying intermarket analysis equips traders with a broader perspective, allowing them to identify hidden opportunities and anticipate potential risks. By integrating this comprehensive approach into their decision-making processes, traders can make more informed and strategic choices, leading to improved results and ultimately enhancing their overall trading performance.
We live in a global marketplace.
Everything is interconnected.
Interest rates, Crude Oil Prices, and the volatility of the Dollar amongst thousands of other variables affect the decisions companies must make to flourish and prosper in these challenging times. Trying to determine what these factors are is one of the huge problems facing investors and traders.
You always have a choice. You can tune in to the talking heads in the media who spin talking points which promote fear. Or you can rely on facts to base your decision-making on.
Our Suggestion
In spite of its recent strength, it is difficult for me to get excited about $PLCE over the long term. Keep in mind over the last 5 years $PLCE is down 79%. Since this is also a small-cap stock with a market capitalization of only $375 million it does not take a great amount of volume to drastically move price.
Based upon these two facts, if you choose to trade $PLCE my suggestion is that you do it with less than 1% of your portfolio. Also, simply look at $PLCE as a short-term, hit and run candidate.
The volatility in $PLCE allows for great short term swing trading opportunities as long as you look for confirmation from the a.i. and the neural index.
The company is trying to rebuild. You will see a lot of clever positioning at future earnings calls as it looks like the company will be producing more with less staff and stores. But the bottom line is the bottom line and I expect that $PLCE will have a tough battle getting profitable and staying there.
PUT $PLCE on your radar and allow the a.i. to guide your trading decisions.
Practice solid money management on all your trades.
We will re-evaluate based upon:
- New Wall Street Analysts’ Estimates
- New 52-week high and low boundaries
- Vantagepoint A.I. Forecast (Predictive Blue Line)
- Neural Network Forecast
- Daily Range Forecast
Let’s Be Careful Out There!
It’s Not Magic.
It’s Machine Learning.
Disclaimer: THERE IS A HIGH DEGREE OF RISK INVOLVED IN TRADING. IT IS NOT PRUDENT OR ADVISABLE TO MAKE TRADING DECISIONS THAT ARE BEYOND YOUR FINANCIAL MEANS OR INVOLVE TRADING CAPITAL THAT YOU ARE NOT WILLING AND CAPABLE OF LOSING.
VANTAGEPOINT’S MARKETING CAMPAIGNS, OF ANY KIND, DO NOT CONSTITUTE TRADING ADVICE OR AN ENDORSEMENT OR RECOMMENDATION BY VANTAGEPOINT AI OR ANY ASSOCIATED AFFILIATES OF ANY TRADING METHODS, PROGRAMS, SYSTEMS OR ROUTINES. VANTAGEPOINT’S PERSONNEL ARE NOT LICENSED BROKERS OR ADVISORS AND DO NOT OFFER TRADING ADVICE.