| This week’s stock analysis is ENOVIX – ($ENVX) |
ENOVIX Corporation ($ENVX) is a leading technology company specializing in advanced lithium-ion batteries for various applications. They generate their revenue primarily through the production and sale of their innovative battery solutions. ENOVIX was founded in 2007 by CEO and Chairman Dr. Harrold Rust and Dr. Robert Hwang, who is the company’s Chief Technical Officer. ENOVIX is headquartered in Fremont, California, USA.
Enovix (ENVX) made a notable move in the specialized battery space recently, drawing the attention of tech hardware investors. The company unveiled its latest product, a standard-sized Internet of Things (IoT) and wearables cell, which caused a nearly 4% surge in its stock price. In comparison, the broader S&P 500 index experienced a modest 0.7% lift on the same day.
What sets Enovix apart is its claim of having a capacity advantage that can potentially double that of its competitors’ offerings. The company emphasized the unique features of its cells, highlighting their custom-made nature with accurately aligned, laser-cut electrodes. This precision process allows for exceptional volumetric and active material packing efficiencies, along with the incorporation of a 100% active silicon anode.
According to Enovix, these batteries can be cycled more than 500 times while retaining 80% capacity. Although the company did not provide specific production, sales, or profitability estimates for the new cells, the higher capacity claim is worth noting. However, it remains to be seen whether this will translate into sustained business success for Enovix.
Overall, Enovix’s foray into the specialized battery market showcases its commitment to innovation and staying competitive in the industry. As with any new product, time will tell how well it is received and whether it can generate long-term growth for the company.
In terms of competition, ENOVIX faces competition from other established battery manufacturers and technology companies operating in the energy storage sector. Some notable competitors include Tesla (TSLA), LG Chem, Panasonic, Samsung SDI, and Contemporary Amperex Technology (CATL).
The biggest opportunity for ENOVIX lies in the growing demand for advanced battery technologies across various industries, including consumer electronics, electric vehicles, and renewable energy storage. As the market continues to evolve, there is a significant need for batteries with higher energy density, improved safety, and longer lifespans. ENOVIX’s unique three-dimensional stacking architecture, which enables higher energy density and performance, positions them well to capture this opportunity.
However, there are inherent risks associated with ENOVIX’s business model. The battery industry is highly competitive and rapidly evolving, with technological advancements and changing customer demands driving innovation. ENOVIX must continue to invest in research and development to stay ahead of the competition. Additionally, scaling up production and maintaining cost competitiveness can be challenging, as the manufacturing process for advanced battery technologies can be complex and capital-intensive.
ENOVIX’s main product is their advanced lithium-ion battery, which features a three-dimensional stacking architecture. This design allows for increased energy density, improved performance, and enhanced safety compared to traditional lithium-ion batteries. ENOVIX’s revenue generation is primarily dependent on the sales of these batteries.
As for Wall Street analysts’ perception of ENOVIX, it’s important to note that individual opinions may vary. However, traditionally, analysts have recognized ENOVIX as a company with strong technological capabilities and innovative battery solutions. Their unique three-dimensional stacking architecture has been regarded as a differentiating factor that could potentially disrupt the battery industry.
Regarding their position in their niche, ENOVIX has strived to establish itself as a leader in advanced lithium-ion battery technology. By developing their unique stacking architecture and focusing on delivering higher energy density and improved performance, they aim to differentiate themselves from traditional battery manufacturers. However, the competitive landscape is dynamic, and the relative positioning of companies can change as new technologies and market dynamics emerge.
Important Sidenotes: Revenue is forecasted by analysts to grow 57.8% per year.
Analysts for the most part have decreased revenue estimates on $ENVX by 24% in the past few months but agree that it will grow quickly.
The company is still currently unprofitable and is not forecasted to become profitable over the next three years.
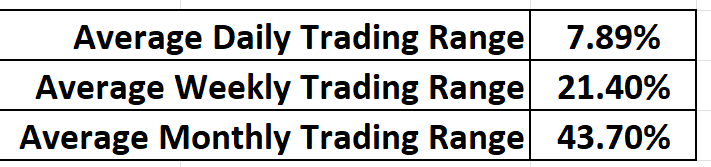
The share price has been more volatile than normal over the past three months. The average weekly trading range for $ENVX is 21.4% per week.
$ENVX has a market cap of $3.51 billion and trades an average of 8.55 million shares per day.
In this weekly stock study, we will look at and analyze the following indicators and metrics as are our guidelines which dictate our behavior in deciding whether to buy, sell, or stand aside on a particular stock.
- Wall Street Analysts’ Estimates
- 52-week high and low boundaries
- Best Case – Worst Case Analysis
- Vantagepoint A.I. Forecast (Triple Cross Indicator)
- Neural Network Forecast
- Daily Range Forecast
- Intermarket Analysis
- Our Suggestion
We don’t base our decisions on things like earnings or fundamental cash flow valuations. However, we do look at them to better understand the financial landscape that a company is operating under.
Analysts Ratings
Based on analysts offering 12-month price targets for ENVX in the last 3 months. The average price target is $41 with a high estimate of $100 and a low estimate of $18. The last closing price on $ENVX was 22.17.
This wide divergence in analyst’s opinion on a widely held stock is what is responsible for volatility in the price of the stock.
What is always intriguing to us when we look at the analysts’ estimates is to quantify the numerous perspectives by simply subtracting the lowest forecast from the highest forecast. That variance is $82 which is quite substantial particularly when the stock is trading at $22.17.
This is the RECIPE for volatility.
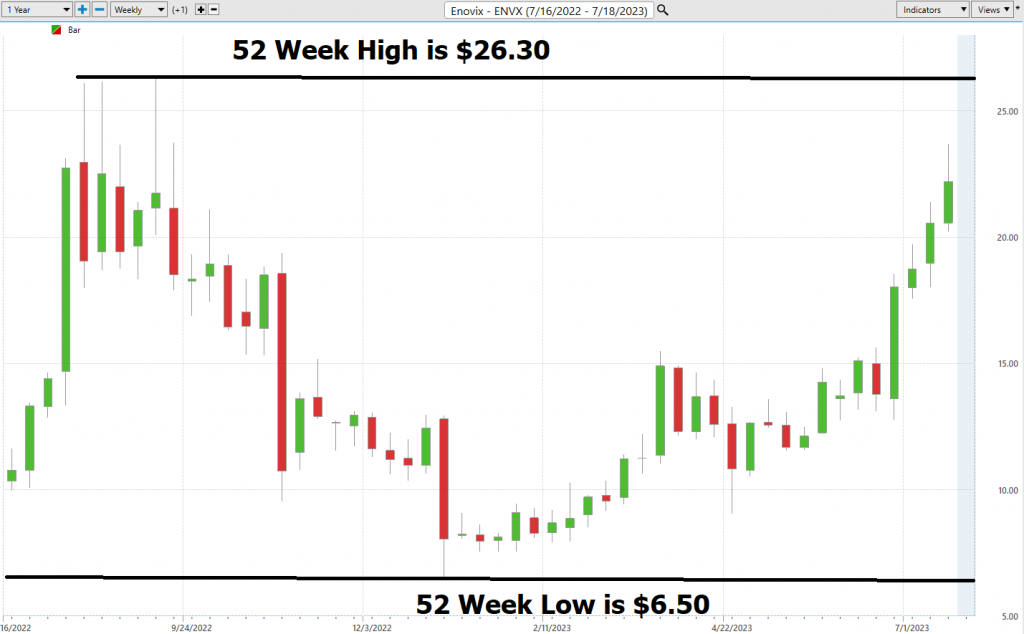
52-week High-Low Chart
When conducting a thorough analysis of an asset, one crucial factor to consider is its position relative to its 52-week highs. Great stocks tend to consistently reach new 52-week highs, even though it may initially seem counterintuitive. Evaluating long-term monthly and weekly charts can provide valuable insights into the overall trend of a stock, a technique often employed by successful traders.
The 52-week high level often acts as a significant resistance point, impeding further upward movement. However, once this level is breached, it is common to witness a rapid surge in the stock price over a short period. As the price rebounds from this level, it becomes crucial to focus on the signals provided by artificial intelligence forecasts.
Over the past 52 weeks, the trading range of $ENVX has varied from a high of $26.30 to a low of $6.50, resulting in an annual trading range of $19.80. By dividing this annual trading range of $19.80 by the current price of $22.21, we can calculate a broad-based measure of volatility, which stands at 89.1%. This indicates that it would be normal to observe $ENVX stock trading up to 89.1% higher or lower than its current price over the next 12 months.
Currently, $ENVX is trading at the 79th percentile based on its 52-week range, implying a relatively elevated position within that range.
A comprehensive examination of the 10-year chart provides traders and investors with a perspective on the growth trajectory of $ENVX over the past decade. The highest point reached during this period was $39.48, while the lowest point was $6.50.
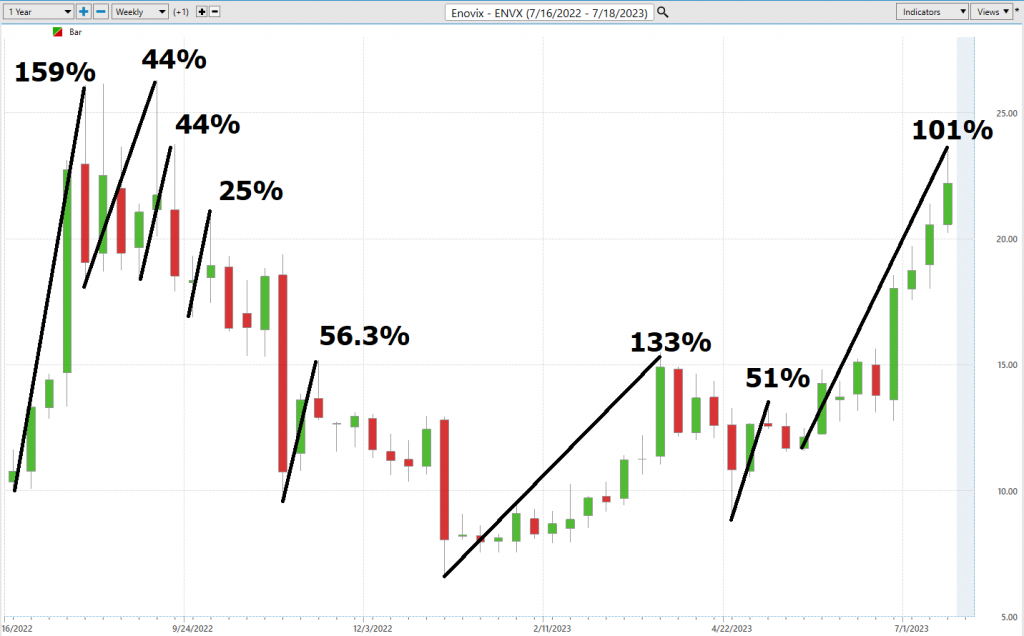
Best Case – Worst Case Analysis
When examining a price chart in the stock market, the comparison between market rallies and declines offers a realistic perspective on volatility. It vividly illustrates how prices can rapidly and dramatically fluctuate in response to various market events, investor sentiment, and other influential factors. The price chart provides a visual representation of the market’s movement over time, presenting the difficulties in a readily understandable manner.
During a market rally, the price chart portrays a steady upward trajectory in prices, occasionally punctuated by minor dips or corrections. This signifies a period of optimism and confidence in the market, as investors eagerly purchase stocks in anticipation of future gains. On the other hand, during a market decline, the price chart exhibits a sharp decline in prices, intermittently interspersed with brief rallies. This reflects a period of fear and uncertainty, with investors selling off stocks in anticipation of further losses.
Moreover, before diving into trading activities , it is crucial to compare the magnitudes of rallies and declines to establish a real-world understanding of expectations. This simple yet practical exercise fosters comprehension of the asset’s volatility in advance. A proficient trader always grasps volatility to formulate risk expectations and determine their preferred trading horizon.
By carefully observing these rallies and declines, traders can witness the rapid shifts in market sentiment and the inherent volatility of the market. This real-world perspective empowers investors to make informed decisions regarding the optimal timing for buying and selling stocks. Furthermore, it helps them prepare for potential losses during periods of heightened market volatility. Understanding volatility becomes a vital tool for navigating the market with greater confidence and prudence.
Here is the best-case analysis for $ENVX:
Next, we look at the worst-case performance:
What is obvious after doing this exercise is that $ENVX is incredibly volatile. Rallies and declines are sharp and sudden. Trading this stock is not for the timid. Because the volatility is so high great traders will often trade a stock like this with less than 1% of their portfolio.
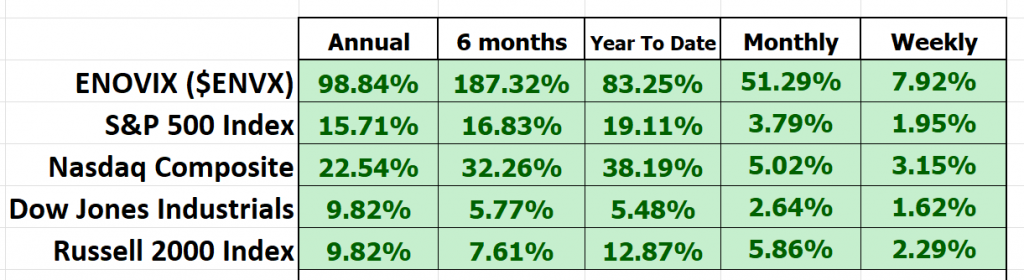
Lastly, we compare $ENVX to the broader stock market indexes.
When evaluating the performance of an individual stock in relation to the broader stock market indexes, it is essential to examine multiple time frames to obtain a comprehensive perspective. Merely considering short-term performance is inadequate; it is necessary to assess how the stock fares against the overall market trend over an extended period to determine its true market leadership. By comparing the performance of an individual stock on various time frames to the broader stock market indexes, traders can gain a deeper understanding of its relative strength. This analysis helps identify whether the stock is leading the market or simply
following along. Such information is crucial for making informed trading decisions, enabling traders to identify potential opportunities or avoid potential pitfalls.
Remember, it’s not just about the short-term gains or losses. A broader perspective that encompasses multiple time frames allows traders to assess the stock’s overall market standing and its ability to stand out from the crowd.
We can easily conclude that while $ENVX has outperformed all of the broader stock indexes it has done so with significantly more volatility.
The VantagePoint Triple Cross Indicator
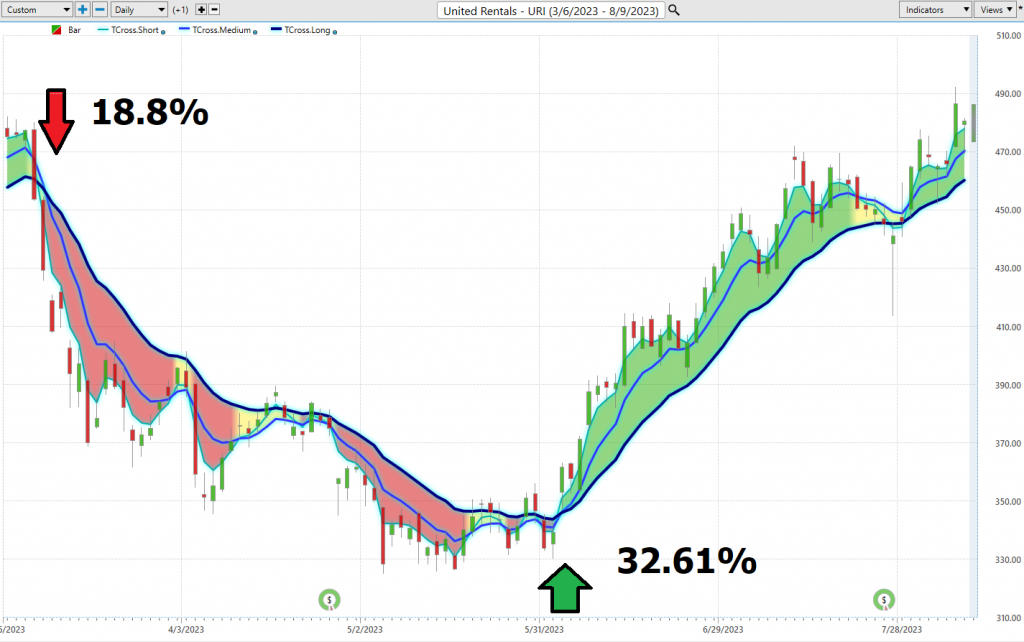
The Vantagepoint A.I. Triple Cross indicator utilizes three predictive moving averages. This indicator incorporates a 3-day predictive moving average, an 8-day predictive moving average, and an 18-day predictive moving average. Each of these time frames corresponds to short-term, medium-term, and long-term analysis, respectively, enabling the indicator to deliver timely alerts and validate trend signals.
The Triple Crossover strategy is designed to reduce the number of trades by patiently awaiting confirmation from all three predictive moving averages: short-term, medium-term, and long-term. When the short-term average crosses the medium-term average, it signals a potential shift in the trend. Subsequently, when the medium-term average crosses the long-term average, it serves as confirmation of the trend change. The alignment of all three averages indicates the initiation of a new trend.
By utilizing predictive data, this indicator aims to minimize time lag and protect against premature entries and false signals caused by volatile or choppy market conditions.
Here is the chart of $ENVX with the Vantagepoint Triple Cross Indicator. You can clearly see that the Triple Cross Indicator provided a positive forecast on May 31, 2023, at a price of $13.21.
To summarize, the Triple Crossover indicator offers an early indication of a potential trend change, which is then confirmed by subsequent crossovers of additional predictive moving averages. This approach helps filter out premature signals, potentially leading to fewer but higher-quality trades.
Fine Tuning Entries with The Neural Net Indicator
The chart features the Neural Network Indicator positioned at the bottom, which offers insights into the market’s future short-term strength or weakness. When this indicator displays a green color, it signifies strength, while red indicates an expectation of short-term weakness. Meanwhile, a yellow color suggests anticipated sideways prices.
The Neural Network Indicator is based on a computational learning system modeled after the brain. It consists of input nodes, output nodes, and hidden nodes. Input nodes receive external information, output nodes communicate with the outside world, and hidden nodes process information internally. The network learns by adjusting the weights of the connections between these nodes, with stronger connections exerting greater influence. Neural networks are widely used for tasks like pattern recognition and data classification. At its core, a Neural Network is a powerful computational tool that leverages networks of functions to analyze vast amounts of data and deliver desired outcomes. It continuously monitors and improves its performance. In the trading context, neural networks enable traders to identify patterns in large datasets,
providing predictions about future market movements. Traders rely on neural networks due to their ability to perform complex statistical and probability analyses on historical data, as well as multi-variable analyses on present market conditions. This empowers them to generate highly accurate trading signals, offering an edge in the markets.
When Power Traders seek statistically valid trading setups, they look for a DOUBLE confirmation signal. This occurs when both the blue predictive line and the Neural Network Indicator align, indicating the same future expected outcome.
The popularity of neural networks in trading rose during the late 1980s and 1990s, driven by advancements in computer technology and algorithm sophistication. By identifying intricate patterns and relationships within extensive datasets that include historical price data, economic indicators, and other market factors, neural networks help traders uncover profitable trading opportunities. They can be trained to predict future asset prices or market movements, incorporating risk assessment and potential reward evaluation to provide high-probability forecasts based on historical information.
For serious traders, we recommend combining the neural index chart with the triple cross indicator to identify optimal entry and exit points. Neural networks serve as innovative tools for discovering subtle non-linear interdependencies and patterns that traditional technical analysis methods may overlook.
In the chart below, you can observe how the Neural Network Indicator presents numerous instances of double confirmation for Power Traders. These occasions occur when the neural index and the triple cross are both forecasting the same thing. The instances offer extremely high-probability trading opportunities to capitalize on the trend.
VantagePoint Software Daily Price Range Prediction
Here are the trading metrics for $ENVX stock over the past year on a daily, weekly, and monthly basis. These percentages are calculated as a percentage of the closing price.
One of the invaluable tools within the VantagePoint Software, frequently utilized by Power Traders, is the Vantagepoint Daily Price Range forecast.
This forecast serves as the key to fine-tuning market entries and exits, granting Power Traders the ability to make precise decisions.
Every day, traders face the anxiety and frustration of determining where they should seek opportunities to buy or sell in the market. VantagePoint’s A.I. simplifies this process with the Daily Price Range Forecast, where the real action takes place. In trading, statistics play a vital role by providing insights into past market trends. However, traders must transform this knowledge into actionable decisions to achieve
success. Among the pivotal concepts influencing trading decisions are volatility, opportunity, and risk. Volatility measures the extent of price fluctuations within a specific period and reflects the uncertainty surrounding an asset’s value. While volatility can generate significant profits, it also entails greater risks, as price fluctuations can result in losses. Hence, traders must establish a robust risk management strategy to balance the benefits of volatility with its inherent risks. This strategy may include implementing stop-loss orders, diversifying portfolios, and regularly assessing risk tolerance. With VantagePoint A.I.’s daily range forecast, traders can optimize their market entries and exits as it provides a clear indication of trading activity and assists in determining appropriate stop placements. By identifying buying opportunities near the bottom of the predicted range and selling opportunities near the upper band, traders can maximize returns while minimizing risks.
Multiple factors can influence the daily price range of stocks, ranging from global political events to weather conditions. Consequently, forecasting the daily price range is a complex task that demands meticulous analysis. identify patterns that may provide insights into future price behavior. VantagePoint A.I. utilizes a proprietary algorithm that combines the power of A.I., neural networks, and machine learning to deliver a daily price range forecast.
Displayed here is the price chart of $ENVX during its most recent runup and drawdown, featuring the Daily Price Range forecast and the Neural Net Indicator. Power Traders were presented with numerous opportunities for short-term swing trades by simply aiming to purchase near the bottom of the predicted range and sell towards the top of the predictive range.
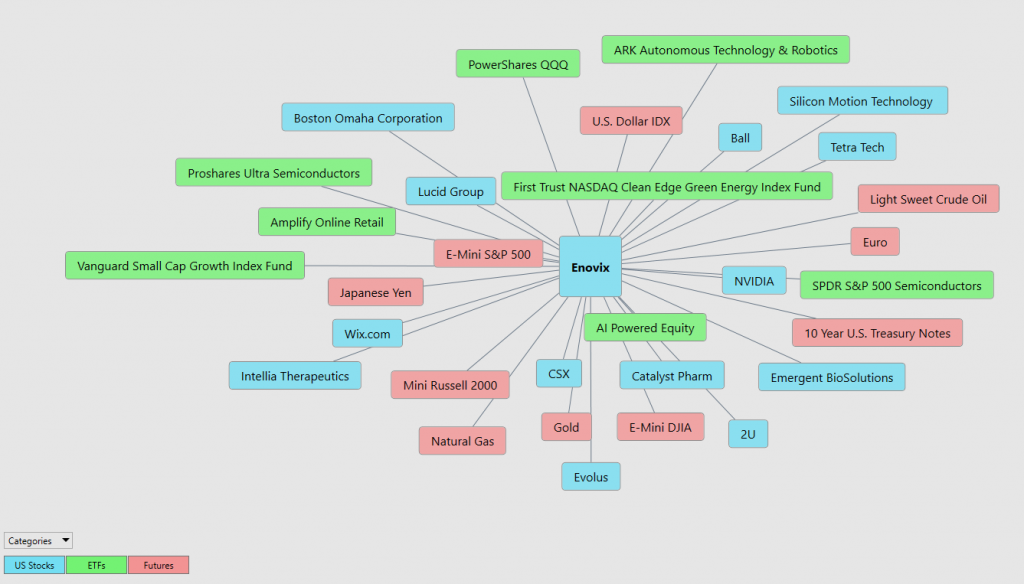
Intermarket Analysis
The Vantagepoint Software sets itself apart with its unique capability to conduct Intermarket analysis, which involves identifying assets that have strong statistical connections and drive price movements.
Intermarket analysis is like playing a game of chess. In chess, you have different pieces with unique abilities and strengths. Intermarket analysis is about studying how these different pieces, like stocks, currencies, and interest rates, move and interact with each other. By understanding these moves and interactions, we can make smarter moves in our own trading game.
The Vantagepoint Software stands out by its exceptional ability to conduct Intermarket analysis, which involves examining how different financial markets are connected and influence each other’s prices. Think of it this way: while studying charts can help us find important levels where prices might go up or down, the global marketplace is like a big web of connections, with many factors influencing how companies make decisions to survive and thrive.
Intermarket analysis helps us understand these connections and relationships between different markets. By studying how these markets interact, we can spot new trends, identify opportunities, and assess risks. In the Intermarket Analysis graphic, you can see the 31 markets that are the key drivers of $ENVX’s price. Understanding these relationships gives us valuable insights as traders. This information is incredibly valuable because it allows us to discover other opportunities and see which exchange-traded funds (ETFs) are also buying $ENVX. It’s like finding new
trading opportunities in their early stages. By relying on facts and data, traders can make better-informed decisions and improve their overall trading performance.
Suggestion
$ENVX’s next earnings call is July 26, 2023. Consensus estimates are that they will lose .29 cents per share. Should they beat these estimates we think the stock will next challenge its 52-week highs.
As we mentioned early on in this study $ENVX has never been profitable. Against that backdrop you have the most optimistic Wall Street Analysts thinking that it can more than quadruple from current levels. Meanwhile, the most bearish analysts think it can fall $4 from current levels. This is a high-risk speculative play, but the risk-reward ratio on $ENVX could be attractive.

We will be looking at positions on the long side with small amounts, less than 1% of the portfolio.
The volatility is massive in $ENVX so if you do decide to trade, be careful.
Our suggestion: Follow the A.I. trend analysis and practice good money management on all your trades .
We will re-evaluate this analysis based upon:
- Wall Street Analysts’ Estimates
- 52-week high and low boundaries
- Vantagepoint A.I. Triple Cross Indicator
- Neural Network Forecast
- Daily Range Forecast
- Intermarket Analysis
Let’s Be Careful Out There!
Remember, It’s Not Magic.
It’s Machine Learning.
Disclaimer: THERE IS A HIGH DEGREE OF RISK INVOLVED IN TRADING. IT IS NOT PRUDENT OR ADVISABLE TO MAKE TRADING DECISIONS THAT ARE BEYOND YOUR FINANCIAL MEANS OR INVOLVE TRADING CAPITAL THAT YOU ARE NOT WILLING AND CAPABLE OF LOSING.
VANTAGEPOINT’S MARKETING CAMPAIGNS, OF ANY KIND, DO NOT CONSTITUTE TRADING ADVICE OR AN ENDORSEMENT OR RECOMMENDATION BY VANTAGEPOINT AI OR ANY ASSOCIATED AFFILIATES OF ANY TRADING METHODS, PROGRAMS, SYSTEMS OR ROUTINES. VANTAGEPOINT’S PERSONNEL ARE NOT LICENSED BROKERS OR ADVISORS AND DO NOT OFFER TRADING ADVICE.