This week’s stock analysis Bitcoin – ($BTC/USD)

In October 2008, during the Great Recession, an anonymous technologist named Satoshi Nakamoto announced the creation of a new peer-to-peer digital currency called Bitcoin. This white paper, downloaded by millions, has sparked a revolution in our understanding of money and its role in the digital age.
Bitcoin maximalists argue that this cryptocurrency holds the answer to the financial problems associated with fiat currencies. They believe Bitcoin’s decentralized nature allows for secure, borderless transactions without the need for trusted intermediaries. Critics, however, claim that only governments have the authority to issue currencies and predict Bitcoin’s failure due to its departure from this historical norm.
The battle lines have been drawn, and the debate over Bitcoin’s value rages on.
The history of Bitcoin is filled with intrigue and mystery. It emerged in the aftermath of a major financial crisis, with political idealists hailing it as a tool for societal liberation, while establishment figures dismiss it with contempt. Technologists, on the other hand, are captivated by its potential to reshape the world.
To understand Bitcoin, we can compare it to traditional payment networks. In a typical transaction with a bank card, the vendor requests verification from the bank, which checks the account balance and approves the transaction. Bitcoin’s revolutionary aspect lies in eliminating the need for a centralized bank and replacing it with a decentralized ledger called the blockchain. Miners, individuals who verify transactions, ensure the integrity of the network, and are rewarded with bitcoin. This decentralized consensus mechanism makes Bitcoin counterfeit-proof and enables financial interactions without a central authority.
Bitcoin can be described as decentralized, borderless, trustless, value transfer network, and a currency. These characteristics highlight its implications for the current monetary system and expose the limitations of existing digital payment networks.
Bitcoin’s breakthrough lies in its ability to establish trust and verification between unrelated parties over the internet. It allows for the safe transfer of digital assets between individuals, with transactions that can be observed and validated by anyone. Moreover, Bitcoin achieves this at a significantly lower cost than traditional intermediaries such as banks.
In a digital society, most payments rely on centralized intermediaries, such as credit card companies or digital payment providers. However, this reliance raises concerns about the concentration of power and potential oppression. Bitcoin’s design makes it difficult to ban, as long as users have an internet connection and a Bitcoin wallet.
Bitcoin has become a source of tremendous innovation. It enables easy, low-cost transactions and opens possibilities for monetizing content and media with microtransactions. This is particularly beneficial for businesses operating on slim margins, as they can save on transaction fees and reinvest the funds.
Bitcoin’s efficiency and productivity in value transfer surpass traditional payment networks. Its advantages become evident when attempting to transfer funds internationally, where traditional methods involve high fees, long delays, and unfavorable exchange rates.
Bitcoin’s disruptive nature and potential implications for commerce, politics, and monetary systems worldwide make it a remarkable innovation. It challenges the status quo and offers a new vision for the future of money and digital transactions.
Bitcoin, in just 14 short years, this digital currency has grown into a staggering $600 billion asset. Its rise can be attributed to a combination of unique properties and an attractive promise of stability amidst a volatile economic landscape. As we explore Bitcoin’s journey, it becomes evident that its appeal lies in the growing awareness of the U.S. Dollar’s declining purchasing power and the potential for Bitcoin to rectify this inherent flaw.
Unlike traditional currencies, which are subject to the control of central banks and governments, Bitcoin operates on a peer-to-peer network. This decentralized structure ensures that no single entity has absolute control over the currency, mitigating the risk of manipulation and inflation. By design, Bitcoin offers transparency and immutability, making it an attractive alternative for those disillusioned with traditional financial systems.
Additionally, Bitcoin is built on blockchain technology, a distributed ledger that records all transactions in a transparent and secure manner. This innovative technology enhances the security and efficiency of transactions, reducing the need for intermediaries and the associated costs. Moreover, the scarcity of Bitcoin, with a maximum supply of 21 million coins, reinforces its value and shields it from the inflationary pressures faced by fiat currencies.
The U.S. Dollar’s loss of 98% of its purchasing power over the last 110 years is a concerning reality. This erosion of value erodes savings, eradicating the hard-earned wealth of individuals. Bitcoin’s promise to rectify this issue is undeniably attractive to those who understand its network and purpose. As the global financial system grapples with the consequences of unbridled inflation and excessive money printing, Bitcoin emerges as a viable solution. Bitcoin’s meteoric rise in value is a testament to its increasing global adoption. With each passing day, more individuals, institutions, and even governments recognize its potential as a reliable financial instrument. From small businesses to multinational corporations, entities
are embracing Bitcoin as a means of diversifying their portfolios and hedging against inflationary risks.
Furthermore, the recent acceptance of Bitcoin as legal tender in certain countries, such as El Salvador, showcases a growing recognition of its importance. Such milestones fuel Bitcoin’s momentum and foster a broader acceptance of cryptocurrencies as a viable alternative to traditional financial systems.
Bitcoin’s journey from an abstract concept to a $600 billion asset in just 14 years is a testament to its unique properties and the disillusionment with traditional financial systems. Its decentralized nature, transparent transactions, and limited supply address the flaws inherent in fiat currencies, especially the declining purchasing power of the U.S. Dollar. As individuals and institutions seek refuge from inflationary pressures, Bitcoin emerges as a beacon of stability and a revolutionary force in the fragile financial ecosystem.
While Bitcoin’s path may face obstacles and skeptics along the way, its rapid growth and global adoption demonstrate a growing understanding of its potential as a hedge against inflation. As we navigate an increasingly uncertain economic landscape, Bitcoin offers an enticing promise of financial sovereignty, independence, and wealth preservation. The rise of Bitcoin signals a paradigm shift, where individuals reclaim control over their financial future, and traditional currencies face scrutiny like never before.
In this weekly asset study, we will look at and analyze the following indicators and metrics which are our guidelines that dictate our behavior regarding a particular asset.
- 52-week high and low boundaries
- Vantagepoint Triple Cross A.I. forecast
- The Best Case – Worst Case Scenarios
- Neural Network Forecast
- Daily Range Forecast
- Intermarket Analysis
- Our trading suggestion
52-Week High and Low Boundaries
Over the past year, we have seen $BTC/USD trade as low as $15613 and as high as $31392. This tells us that the annual trading range is $15779.
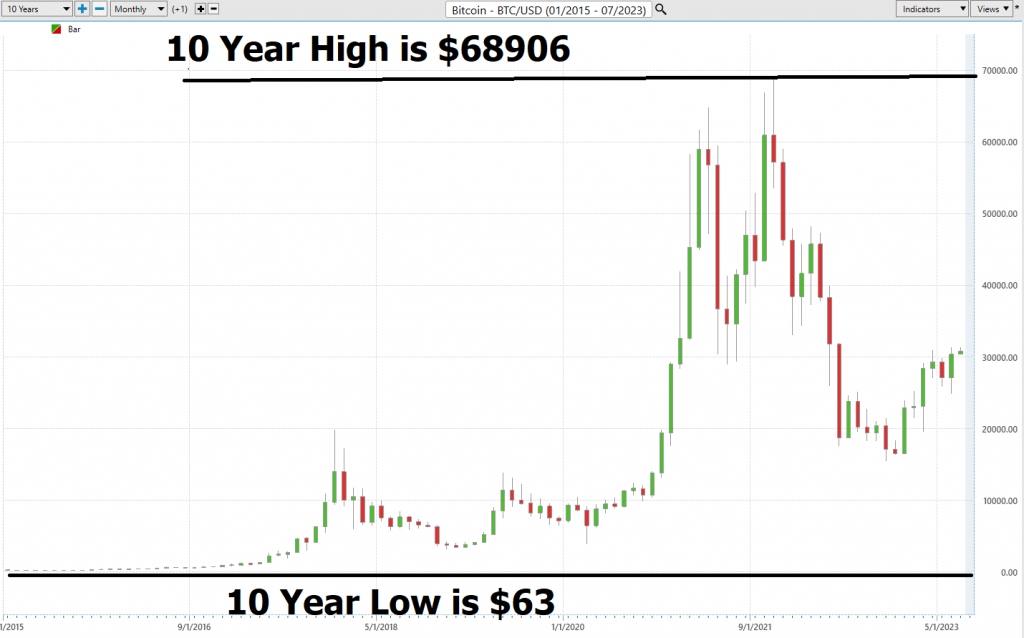
We also like to divide the annual trading range of $15779 by the current price of $30,769 to get a broad-based estimate of trading volatility. This tells us that the volatility of $BTC/USD over the past year has been 51.3%. This value also provides us a basic estimate in letting us know that if the future is like the recent past, it would be normal for $BTC/USD to trade in a range that is 51.3% higher and lower from the current price over the next year.
What always attracts us to any asset is a trend that starts making new 52-week highs. Bitcoin is currently at that threshold. The 52-week high point is a boundary that astute traders pay attention to and measure an assets strength.
One of the most powerful trend indicators is simply a stock that continues to make new highs repeatedly.
So, in $BTC/USD we see an asset with incredible volatility and unparalleled growth potential as the asset vies to become the reserve currency of the world.
Now we compare $BTC/USD to other opportunities in the broader market indexes and blue chip tech stocks.
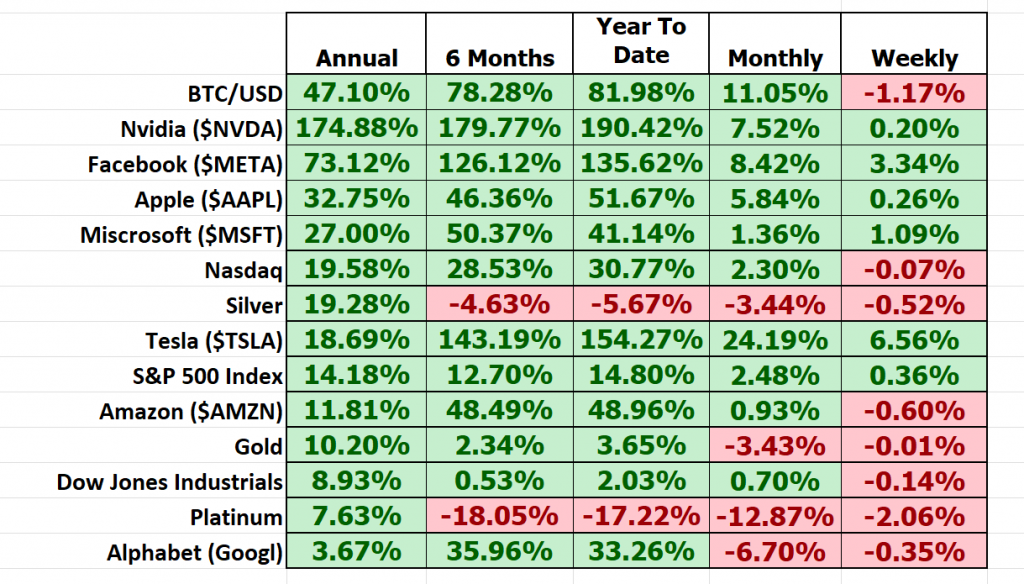
When you study these comparison metrics you see that Bitcoin has outperformed the majority of stock indexes and metals, while lagging behind standout annual performances from companies like $NVDA and $META over the past year.
We like to do this detailed analysis against a pool of different assets to see how comparative assets performed over multiple time frames. By doing so, you can quickly make your own conclusions of which assets have done well and which have not.
Best Case – Worst Case Scenario
Whenever we look at a trade or long-term investment opportunity to really understand what we are dealing with we need to compare the performance of the asset we are considering with the returns of the major market indexes.
But we also want to get an idea of the best-case and worst-case scenarios that have been in that asset.
First the best-case scenario:
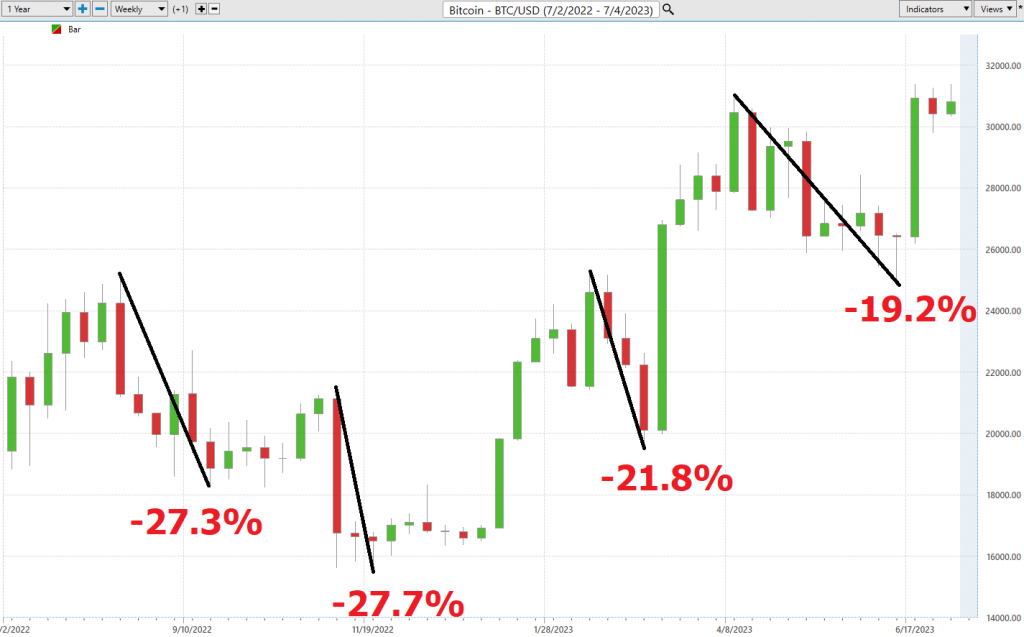
Followed by the worst-case analysis:
So, we can see that in $BTC/USD we have a volatile asset where it is customary to see 20% to 25% declines, peak to trough, followed by sharp impulsive rallies of even larger magnitude.
Vantagepoint A.I. Triple Cross Indicator
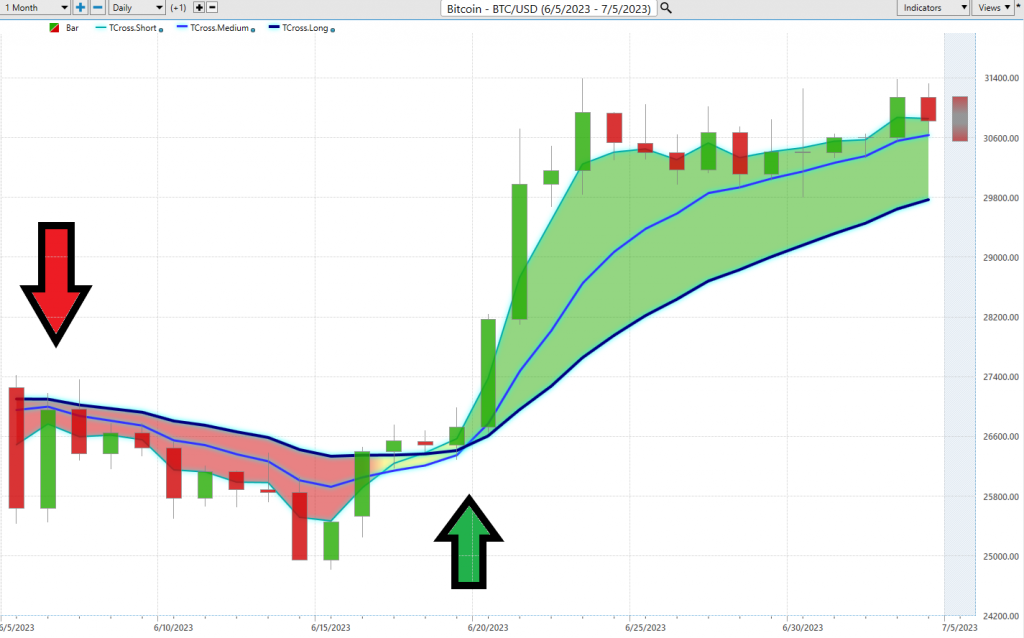
The Vantagepoint A.I. Triple Cross indicator employs an innovative approach to technical analysis, utilizing three predictive moving averages. Diverging from the conventional practice, this innovative indicator integrates a 3-day predictive moving average, an 8-day predictive moving average, and an 18-day predictive moving average. These distinct time frames cater to short-term, medium-term, and long-term analysis, endowing traders with invaluable early alerts and ensuring validation of reliable trend signals.
By utilizing three moving averages, the Triple Cross indicator strategically diminishes the number of trades executed. It adopts a patient stance, awaiting confirmation from all three predictive moving averages: short-term, medium-term, and long-term. When the short-term average intersects with the medium-term average, it unveils a potential shift in the prevailing trend. However, it is only when the medium-term average successfully surpasses the long-term average that the trend change is conclusively confirmed. Thus, the harmonious alignment of all three moving averages heralds the commencement of a new trend.
The utilization of predictive data confers upon traders the advantage of reduced time lag, while simultaneously shielding them against untimely entries and deceptive signals that may arise from erratic or volatile market conditions.
In essence, the Triple Cross Indicator emerges as a reliable tool for early identification of trend changes, fortified by secondary and tertiary predictive moving average crossovers. By sieving out premature signals, it offers the potential for fewer but superior trades, enhancing the overall quality of trading decisions.
This is the power and effectiveness of the Vantagepoint A.I. forecast in assisting traders to stay on the right side of the trend at the right time.
Neural Network Indicator (Machine Learning)
At the bottom of the chart is the Neural Network Indicator which predicts future short-term strength and/or weakness in the market. When the Neural Net Indicator is green it communicates strength. When the Neural Net is red it is forecasting short term weakness in the market.
A neural network is a computing system that is modeled after the brain. neural networks are composed of input nodes, output nodes, and hidden nodes. Input nodes receive information from the outside world, while output nodes send information to the outside world. Hidden nodes are neither input nor output nodes; rather, they process information internally. neural networks learn by adjusting the weights of the connections between the nodes. The stronger the connection between two nodes, the more influential that connection is. neural networks can be used for a variety of tasks, including pattern recognition and data classification.
At its essence, a Neural Net is a computational learning system that uses a network of functions to understand and translate massive amounts of data into a desired output, consistently monitoring itself and improving its performance.
When it comes to seasoned Power Traders seeking statistically reliable trading setups, their attention gravitates towards the occurrence of a DOUBLE confirmation signal. This notable signal materializes when both the blue predictive line and the Neural Net indicator at the base of the chart align, substantiating a congruent expectation for future market outcomes.
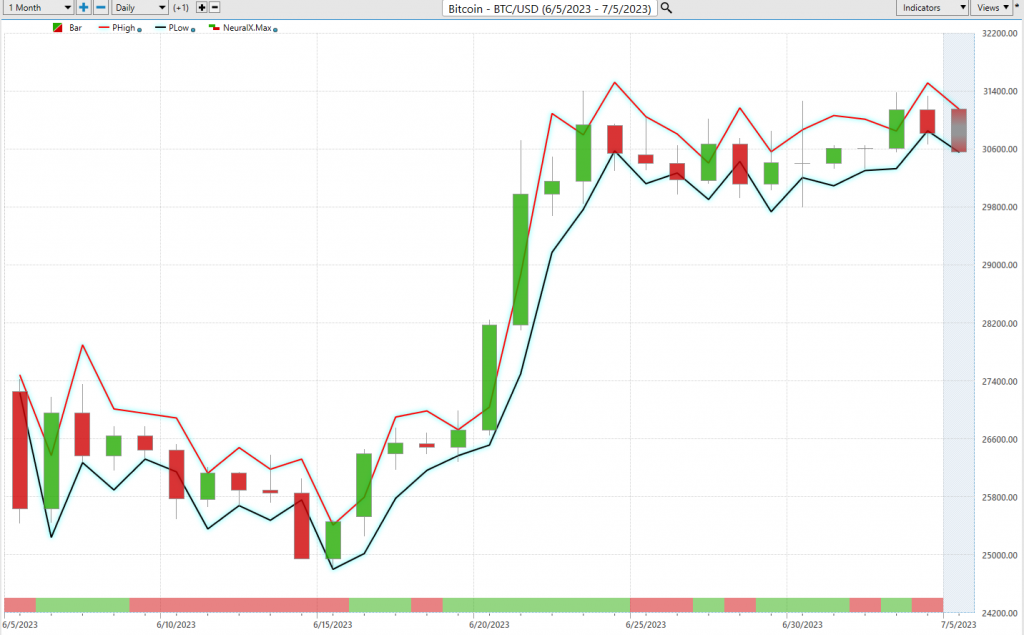
We advocate that Power Traders cross reference the chart with the predictive blue line and neural network indicator to create optimal entry and exit points.
Traders look for confirmation on the Neural Net to position themselves for LONG or SHORT opportunities in the market. In other words, when the Triple Cross forecast is green, and The Neural Net is green, that presents a buying opportunity.
The inverse is also true, when the Triple Cross forecast is red and the Neural Net is red, that is a selling opportunity. The arrows on the chart highlight the trading zones where Power Traders would’ve been using double confirmation to find a buying opportunity in cross referencing the A.I. forecast with the Neural Net.
Power Traders are always looking to apply both the Neural Network and A.I. to the markets to find statistically sound trading opportunities.
VantagePoint Software Daily Price Range Prediction
One of the powerful features in the VantagePoint Software which Power Traders use daily is the Price Range prediction forecast.
This forecast is what permits Power Traders to truly fine tune their entries and exits into the market.
Every day traders are faced with the anxiety and frustration of wondering where they should be looking for opportunities to buy and sell the market. VantagePoint’s A.I. makes this decision super easy with the Daily Price Range Forecast. This is where the rubber meets the road.
Many factors can affect the daily price range of stocks, from global political events to the weather. As a result, forecasting the daily price range is a complex task that requires careful analysis. There are a number of methods that can be used to forecast daily price ranges, including technical analysis, fundamental analysis, and news-based analysis. Technical analysis involves studying past price movements to identify patterns that may provide clues about future price behavior. Fundamental analysis focuses on economic indicators such as company earnings and interest rates. News-based analysis involves tracking breaking news stories that could have an impact on the stock market. Vantagepoint A.I. uses a proprietary algorithm that combines the power of a.i., neural networks and machine learning to provide a daily price range forecast. By using a combination of these methods, it is possible to develop a more accurate forecast of the daily stock market price range.
Here are the average trading ranges for Bitcoin over the past year on a daily, weekly, and monthly basis.
These values provide a basis from which we get to define normal market price action. However, the Vantagepoint A.I. daily range forecast provides exacting guidance to traders by forecasting the following days high and low prices.
This chart helps traders decide where stop placement should occur. Observe how placing protective sell stops below the dark line on the chart was a powerful way to minimize risk on this trade.
See how the upper and lower bands of the price range forecast for a clear channel of trading activity as well. Swing traders are always looking for opportunities to buy towards the bottom of the predicted channel and selling opportunities above the top band.
Intermarket Analysis
Power lies in the way we respond to the truth we understand.
One of the supremely important questions in trading is what is driving the price? Headlines often create interesting narratives. But these “stories” only capture the imagination. Traders want and need to understand the cause and effect of price movement.
The only way to get an answer to this important question is through intermarket analysis which looks at statistical price correlations of assets. Intermarket analysis is the study of relationships between different financial markets. It looks at how these markets affect each other, and how they can be used to predict future market movements. By understanding these relationships, traders can make informed decisions about where to allocate their capital. Intermarket analysis can be used to trade a variety of asset classes, including stocks, bonds, commodities, and currencies. There are a number of Intermarket indicators that can be used to identify opportunities, such
as price correlations and momentum indicators. By taking the time to understand Intermarket dynamics, traders can give themselves a significant edge in the market.
We live in a global marketplace.
Everything is interconnected.
Imagine you have a bunch of different puzzles, and each puzzle represents a different part of the world. Now, let’s say you want to solve a big puzzle that shows how all these parts fit together. That’s where intermarket analysis comes in.
Intermarket analysis is like looking at all the different puzzles and trying to understand how they connect and affect each other. You see, in the world of finance and investing, different markets, like stocks, bonds, commodities, and currencies, are like these separate puzzles.
When traders use intermarket analysis, they study how changes in one market can have an impact on other markets. They look for patterns and connections between these different puzzles. For example, they might notice that when the price of oil goes up, it can affect the prices of other things, like airline tickets or the cost of making products.
By understanding these connections, traders can make better decisions about how things might change in the future. It’s like solving a big puzzle by studying all the smaller puzzles and figuring out how they fit together.
So, just like you would look at all the pieces of different puzzles to understand how they connect, intermarket analysis helps people in finance understand how different markets are related and how changes in one market can affect others.
You always have a choice. You can tune in to the talking heads in the media who spin talking points which promote fear. Or you can rely on facts to base your decision making on.
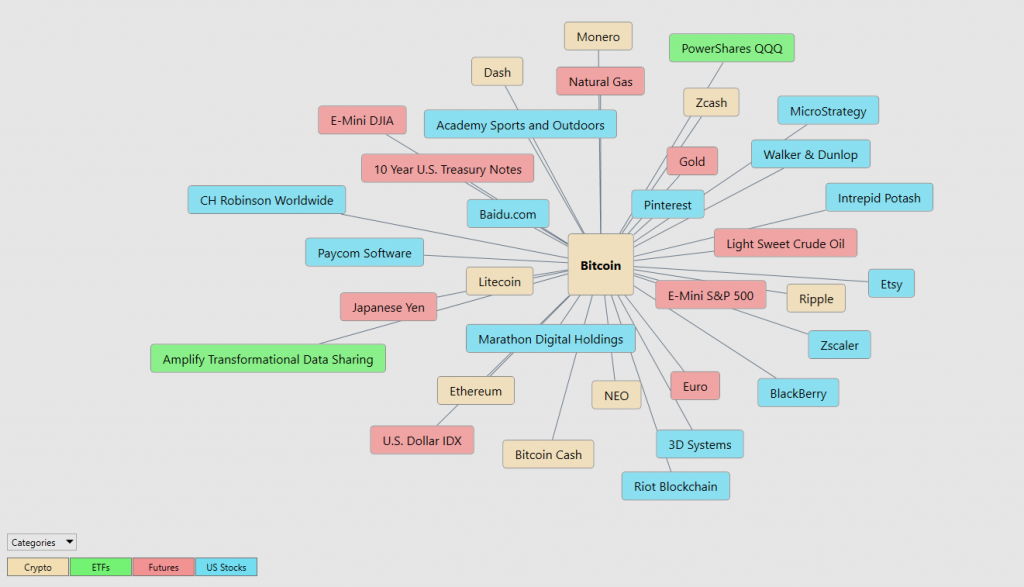
Within the following Intermarket Analysis graphic, you will see the 31 markets that are the key drivers of Bitcoin’s price.
Our Suggestion
Bitcoin’s potential advantage is that it not controlled by any government or bank and is a response of the free market to the horrific loss of purchasing power of currency.
There will only ever be 21 million Bitcoin. It is a scarce and pristine asset, which is why it is considered so valuable.
When you study bitcoin, you are forced to look at economic history over hundreds and thousands of years. Upon doing so, students quickly discover the solutions posed by economic authorities always result in the loss of purchasing power.
What makes people begin to believe the Bitcoin promise is comparing Bitcoin’s performance to other asset classes over extended periods of time. Whenever you do this, you will quickly discover that it is extremely hard to find any asset, anywhere in the world that has outperformed bitcoin over a time frame of 5 years or longer.
Now, the Bitcoin halving is an event that happens about every four years. It’s a bit like a birthday party for Bitcoin, but instead of getting presents, something else happens. You see, Bitcoin has a rule built into its code that says the number of new Bitcoin created every day gets cut in half every four years. It’s like someone saying, “Okay, we’re going to make less and less Bitcoin from now on.”
Why is this a big deal? Well, scarcity is what defines value in economics.
That’s exactly what happens with the Bitcoin halving. When the halving occurs, the number of new Bitcoins that are created gets reduced by half. So, why do people care about this? It’s because this reduction affects how many Bitcoins are available in the world. And when something becomes scarcer, its value tends to go up.
Think about it this way: if you have a rare baseball card that only a few people own, it would be more valuable than a baseball card that everyone has, right? Well, the same goes for Bitcoin. When fewer Bitcoins are being created, it means they become more valuable because there aren’t as many of them around. People who already own Bitcoins get excited because the value of their Bitcoin might go up.
Bitcoin halving events occur approximately every 210,000 blocks, which roughly translates to once every four years. The next bitcoin halving occurs on April 27, 2024.
The Bitcoin halving is an event where the number of new Bitcoins created each day gets cut in half. This reduction in supply makes existing Bitcoins more valuable, just like when something rare becomes more precious. It’s a fascinating part of the world of Bitcoin and something that has people buzzing with anticipation.
Our suggestion is that you study the bitcoin ecosystem and familiarize yourself as much as possible with its blockchain which is the biggest financial disruptor in the financial world today. Currently, the biggest financial money managers are all awaiting approval on a bitcoin ETF. Many believe that the approval of a Bitcoin ETF will increase adoption and make Bitcoin transactions more common and easier to facilitate.
Be forewarned that bitcoin is a very volatile asset but its historical performance is truly a wonder to behold.
The Weekly and monthly trends are UP.
Momentum is UP.
It appears to have found resistance at its recent 52-week highs. Once that is breached, we think bitcoin will be off and running again.
Put $BTC/USD on your radar and allow the a.i. to guide your trading decisions.
Practice solid money management on all your trades.
We will re-evaluate based upon:
1) New 52-week high and low boundaries
2) Vantagepoint A.I. Forecast (Predictive Blue Line)
3) Neural Network Forecast
4) Daily Range Forecast
Let’s Be Careful Out There!
It’s Not Magic.
It’s Machine Learning.
Disclaimer: THERE IS A HIGH DEGREE OF RISK INVOLVED IN TRADING. IT IS NOT PRUDENT OR ADVISABLE TO MAKE TRADING DECISIONS THAT ARE BEYOND YOUR FINANCIAL MEANS OR INVOLVE TRADING CAPITAL THAT YOU ARE NOT WILLING AND CAPABLE OF LOSING.
VANTAGEPOINT’S MARKETING CAMPAIGNS, OF ANY KIND, DO NOT CONSTITUTE TRADING ADVICE OR AN ENDORSEMENT OR RECOMMENDATION BY VANTAGEPOINT AI OR ANY ASSOCIATED AFFILIATES OF ANY TRADING METHODS, PROGRAMS, SYSTEMS OR ROUTINES. VANTAGEPOINT’S PERSONNEL ARE NOT LICENSED BROKERS OR ADVISORS AND DO NOT OFFER TRADING ADVICE.