This week’s stock analysis is Netflix – ($NFLX)
iRobot Corporation (ticker symbol: IRBT) is a leading global consumer robotics company that specializes in designing and manufacturing autonomous robots. The company primarily generates revenue through the sale of its robotic products and related accessories. iRobot’s products are designed to perform various tasks, primarily focused on home cleaning and maintenance, including vacuuming, mopping, and pool cleaning. iRobot’s best-selling product appears to be from their Roomba line of robot vacuums. The specific model that is most popular can vary, but models such as the Roomba i7+, Roomba j7+, and Roomba S9 are frequently mentioned as top performers.
iRobot was started by Rodney Brooks, Colin Angle, and Helen Greiner back in 1990. They have about 1,200 people working for them in their main office in Bedford, Massachusetts.
Now, the world of robots is getting bigger and bigger. More and more people want robots to help them with their chores at home. iRobot is in a great position to make the most of this because they’ve been making robots since 1990 and people know their brand.
But there are some challenges too. There are other companies that also want to make robots, and this could make it harder for iRobot to sell their robots. Plus, they need to keep coming up with new and better robots to stay ahead. Some of these other companies are LG Electronics, FANUC, Dyson, Xiaomi, and ECOVACS.
Last year, Amazon said they wanted to buy iRobot. They offered $61 for each share of iRobot. But people weren’t sure if this would happen, and the price of iRobot’s shares went down to $31.80. But recently, the regulators in the UK said it was okay for Amazon to buy iRobot. So now, it looks like Amazon might really buy iRobot.
Let’s talk about how iRobot did in the first three months of 2023. It’s like getting a report card in school, but instead of grades, they get earnings and revenues.
iRobot didn’t do so well. They lost $2.95 for each share they have, which is worse than the $1.12 they lost during the same time last year. They also made $160.3 million, which is 45% less than what they made last year. They also lost $81.1 million, which is 167% more than what they lost last year.
Some analysts thought iRobot would make more money. But iRobot made 33% less money and lost 73% more per share than the analysts thought. But people think that iRobot’s money will grow by 8.2% each year for the next three years.That’s faster than the 2.3% growth that’s expected for other companies that make stuff people use every day.
The Roomba robotic vacuum cleaners is one of iRobot’s best products and make a lot of money for the company. The Roomba has gotten better over the years, with new features like maps, smart home integration, and voice control.
Wall Street analysts think iRobot has a lot of potential. They think iRobot is a leader in making robots for people to use at home. They watch iRobot’s new products, how they sell, and who else is making similar products to guess how iRobot will do in the future.
In the world of robots that help us at home, iRobot is a leader. They’ve helped make robot cleaners popular and are a well-known brand. With their great products, knowledge of technology, and share of the market, iRobot is a leader in the industry.
In this weekly stock study, we will look at and analyze the following indicators and metrics which are our guidelines to dictate our behavior regarding any stock analysis.
- Wall Street Analysts’ Estimates
- 52-week high and low boundaries
- Vantagepoint A.I. Predictive Blue Line
- The Best Case – Worst Case Scenarios
- Neural Network Forecast
- Daily Range Forecast
- Intermarket Analysis
- Our trading suggestion
We don’t base our trading decisions on things like earnings or fundamental cash flow valuations. However, we do look at them to better understand the financial landscape that a company is operating under.
Wall Street Analysts’ Estimates
Since iRobot ($IRBT) is a small cap stock it does not receive a lot of coverage from Wall Street analysts. According to 2 analysts, the average rating for IRBT stock is “Hold.” The 12-month stock price forecast is $53.0, which is an increase of 6.02% from the latest price. With the Amazon deal being approved at $61 per share, short term traders have been looking to buy weakness in the markets.
52-Week High and Low Boundaries
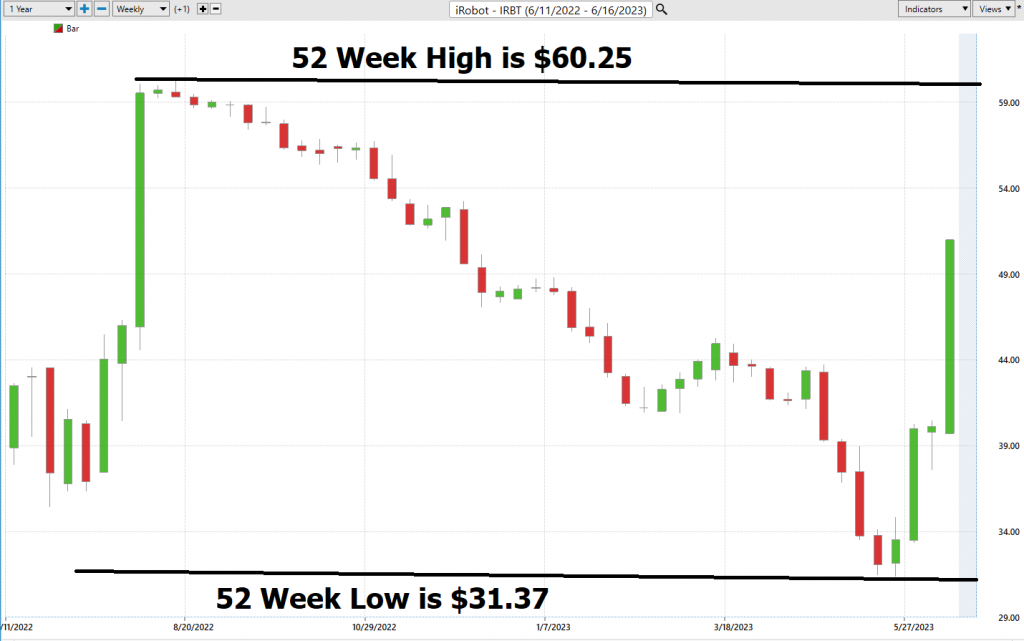
Over the past year we have seen $$IRBT trade as low as $31.37 and as high as $60.25. This tells us that the annual trading range is $28.88.
We also like to divide the annual trading range of $28.88 into the current price of $50 to get a broad-based estimate of trading volatility. This tells us that the volatility of $$IRBT over the past year has been 57.8%. This value also provides us with a basic estimate in letting us know that if the future is like the recent past, it would be normal for $$IRBT to trade in a range that is 57.8% higher and/or lower than the current price over the next year.
Here is the annual 52-week chart of $IRBT so that you can see the powerful price journey it has taken over the last few months.
The 52-week low price level is a critical benchmark that seasoned traders closely monitor for several reasons. Firstly, it assists them in determining the “fair value” of a particular security. Secondly, it can help identify when a security is “cheap” – that is, when it is trading significantly below analyst estimates, it could present an enticing buying opportunity. Lastly, experienced traders often seek signs of a price bottoming out near the 52-week low level, which can be a useful indicator that the security is about to embark on a new upward trend. Therefore, the 52-week low level is a crucial metric that professional traders incorporate into their analysis.
Typically, when a stock reaches a 52-week low, it is generally perceived as a negative sign. If the downward momentum persists and the stock hits a new 52-week low, it is often seen as a further negative indicator. However, when the low-price level is tested multiple times and remains unbroken, it is crucial to take note, as significant price rallies often occur based on the bottoming price action alone. This is precisely what has transpired with $IRBT, which has seen a 63% rally off its 52-week lows in the last 19 trading sessions.
Here are the interesting benchmarks on $IRBT.
Average price for the year is $47.29.
Midpoint price for the year is $45.81.
Maximum and minimum price for the year represent a 31.5% variance from the midpoint.
Power Traders will compare the Wall Street Analysts estimates with these broad volatility estimates to get a broad sense of price action in $$IRBT.
What is also very constructive is to look and examine the longer term 10 year monthly chart for $IRBT.
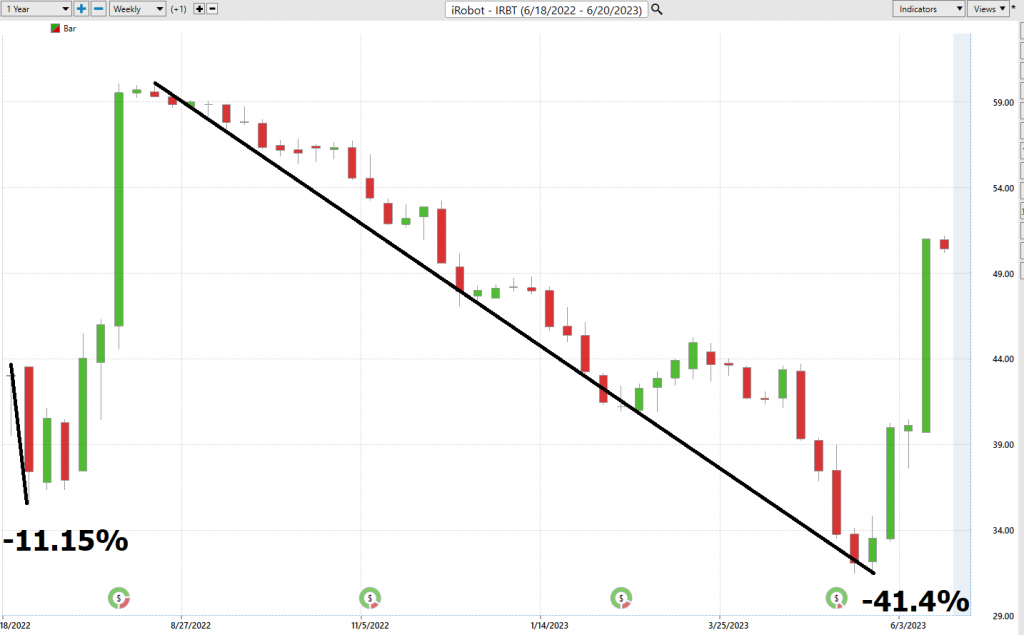
Best Case – Worst Case Scenario $IRBT
When evaluating a trade or long-term investment opportunity, it is essential to thoroughly comprehend the asset’s inherent characteristics. This understanding can be achieved by comparing the asset’s most significant rallies to its steepest declines, which provides insight into its real-time volatility. Furthermore, comparing the performance of the asset under consideration with the returns of the major market indexes can offer a broader market perspective.
Statistical annualized volatility is a metric that quantifies the degree of variation in a stock’s price over time. It reflects the estimated standard deviation observed in price movements during regular market trading. From a quantitative standpoint, the accuracy and predictive power of this average increase as the time used for its calculation lengthens. Rather than merely quantifying this as a number, we prefer to interpret it graphically through a best-case and worst-case analysis. This approach allows us to gain a genuine understanding of what this volatility implies for potential performance.
Effective trading hinges on a keen awareness of an asset’s potential volatility. As traders, we are in pursuit of MOTION. However, motion is a double-edged sword, and by initially examining rallies and declines, we can swiftly determine whether an asset is retaining its gains. It’s important to note that $IRBT has an annualized volatility of 40%. This implies that it is “NORMAL” for the stock to be 40% higher or lower over the forthcoming 12 months.
Here is the BEST-CASE analysis.
Followed by the WORST-CASE Analysis:
Next, we compare the performance of $IRBT to the broader major stock market indexes.
We can quickly see with this type of analysis that $IRBT has for the most part outperformed the broader market, but it has done so with significantly more volatility.
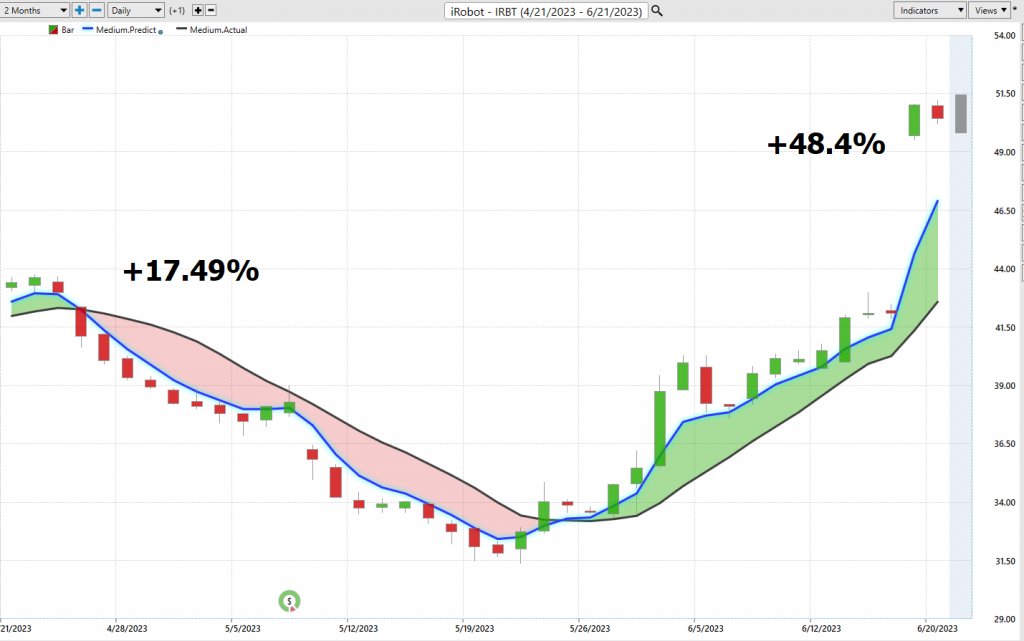
Vantagepoint A.I. Forecast (Predictive Blue Line)
Let’s do some basic trend forecasting analysis based upon looking at the VantagePoint predictive blue line over the last year. On the following chart, you will see the power of the VantagePoint Predictive blue line which determines the medium-term trend price forecast.
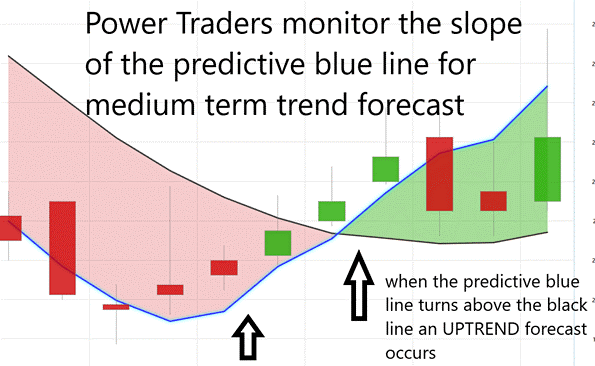
The guidelines we abide by are as follows:
- The slope of the predictive blue line determines the trend and general direction of $IRBT
- When the blue line turns above the black line an UP opportunity occurs
- When the blue line turns below the black line a DOWN opportunity occurs
- Ideally, the VALUE ZONE is determined to try and buy the asset at or below the predictive blue line.
Over the last 2 months, there have been 2 trading opportunities, both have been winners.
Trade #1 generated 17.49% in 21 days on the short side.
Trade #2 generated 48.4% in 17 days on the long side.
This is the power and effectiveness of the Vantagepoint A.I. forecast in assisting traders to stay on the right side of the trend at the right time.
The predictive blue line is the initial indicator which Power Traders use to monitor and navigate the trend.
Next traders cross-reference this signal with the historical pattern recognition available with machine learning and the Neural Index.
Neural Network Indicator (Machine Learning)
Let’s talk about the Neural Network Indicator you see at the bottom of the chart. When the indicator turns green, it’s hinting at strength. But when it’s red, it’s forecasting a bit of a slump in the market.
Now, you might be wondering, what’s a neural network? Well, it’s a computer system designed to think like a human brain. It has input nodes that take in information, output nodes that send out information, and hidden nodes that process information internally. These nodes are all connected, and the strength of these connections can change as the network learns. The stronger the connection, the more influence it has.
In simpler terms, a Neural Net is like a super-smart computer system that learns to understand and translate loads of data into something useful. It’s always checking itself and getting better at what it does.
Traders use neural networks to spot patterns in big piles of data, which can help them predict what the market might do next. These networks can do some pretty complex math on historical data and analyze current market conditions from multiple angles. This helps traders make highly accurate predictions, giving them an edge in the market.
Neural networks are a type of artificial intelligence that can mimic the decision-making process, helping traders spot profitable trades. They can analyze and interpret complex data, spotting patterns that might otherwise be missed. They also add an extra layer of precision to trade forecasts, helping traders learn from past wins and losses. Using neural networks can give traders a leg up on their competition, helping them make smarter decisions, save time, and ultimately boost their profits.
When Power Traders are on the hunt for solid trading setups, they look for what’s called a DOUBLE confirmation signal. This signal pops up when the blue predictive line and the Neural Net at the bottom of the chart both point to the same expected outcome in the future. It’s like getting a double thumbs-up from the system!
We advocate that Power Traders cross-reference the chart with the predictive blue line and neural network indicator to create optimal entry and exit points.
Traders look for confirmation on the Neural Net to position themselves for LONG or SHORT opportunities in the market. In other words, when the A.I. forecast is green, and The Neural Net is green, that presents a buying opportunity.
The inverse is also true, when the A.I. forecast is red and the Neural Net is red, that is a selling opportunity. The arrows on the chart below highlight the trading zones where Power Traders would’ve been using double confirmation to find a buying opportunity in cross-referencing the A.I. forecast with the Neural Net.
Power Traders are always looking to apply both the Neural Network and A.I. to the markets to find statistically sound trading opportunities.
VantagePoint Software Daily Price Range Prediction
One of the powerful features in the VantagePoint Software which Power Traders use daily is the Price Range prediction forecast.
This forecast is what permits Power Traders to truly fine tune their entries and exits into the market.
Every day traders are faced with the anxiety and frustration of wondering where they should be looking for opportunities to buy and sell the market. VantagePoint’s A.I. makes this decision super easy with the Daily Price Range Forecast. This is where the rubber meets the road.
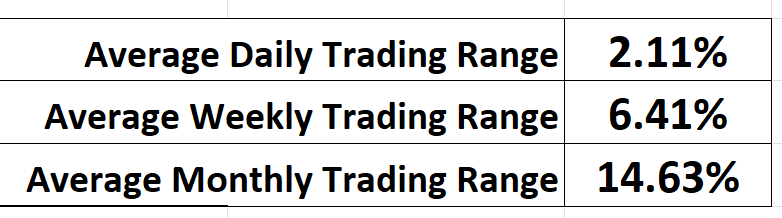
Here are the average trading ranges for iRobot ($IRBT) over the past day, week, and month.
Stock price ranges is subject to a multitude of influential factors, ranging from global political events, interest rates, money supply statistics etc… Consequently, the process of forecasting these price ranges entails a complex endeavor that necessitates meticulous analysis. Several methodologies exist for predicting daily stock price ranges, including technical analysis, fundamental analysis, and news-based analysis.
Technical analysis involves an examination of past price movements to identify discernible patterns that may offer insights into future price behavior. On the other hand, fundamental analysis concentrates on economic indicators such as company earnings and interest rates. Lastly, news-based analysis involves monitoring breaking news stories that hold the potential to impact the stock market.
Vantagepoint A.I., employing a proprietary algorithm, combines the capabilities of artificial intelligence, neural networks, and machine learning to generate a daily price range forecast. By incorporating a blend of these methodologies, a more precise forecast of the daily stock market price range can be developed.
For investors of all types, the analysis of stock prices on a daily basis assumes a crucial role in their pursuit of consistent gains. Whether as individuals or larger institutions, understanding the factors that contribute to daily fluctuations is paramount for accurately predicting future trends. VantagePoint’s approach specifically revolves around the systematic observation and tracking of patterns over time. By diligently monitoring these elements and anticipating potential influences, investors can make well-informed decisions grounded in statistical analysis when participating in the stock market.
Here is the price chart of $IRBT during the most recent uptrend. The software very clearly delineates the daily forecast by providing an exact lower and upper boundary and specifies the short-term trend.
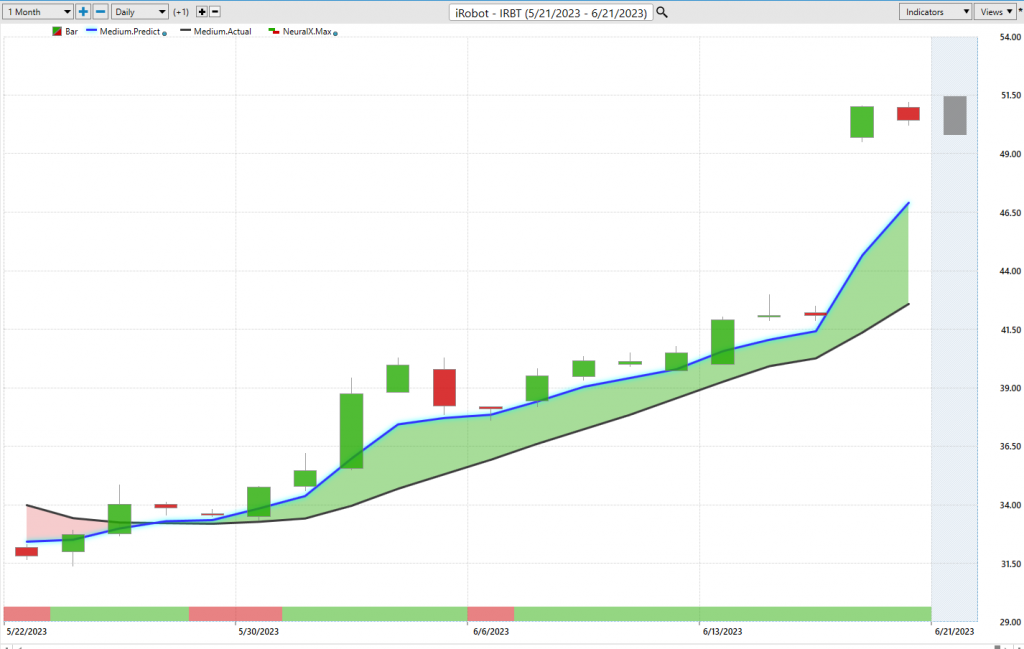
This chart helps traders decide where stop placement should occur. Observe how placing protective sell stops below the dark line on the chart was a powerful way to minimize risk on this trade.
See how the upper and lower bands of the price range forecast for a clear channel of trading activity as well. Swing traders are always looking for opportunities to buy towards the bottom of the predicted channel and selling opportunities above the top band.
Intermarket Analysis
Power lies in the way we respond to the truth we understand.
That is a powerful fact that traders use effectively in their decision-making process.
One of the supremely important questions in trading is what is driving the price? Headlines often create interesting narratives. But these “stories” only capture the imagination. Traders want and need to understand the cause and effect of price movement.
The only way to get an answer to this important question is through Intermarket analysis which looks at statistical price correlations of assets.
The following graphic shows you the top 31 drivers of $IRBT’s price action.
So, a study of the relationship(s) will prove to be beneficial to a trader.
Intermarket analysis is a trading approach that examines the relationships between different financial markets, such as stocks, bonds, commodities, and currencies. It focuses on the interdependencies and correlations between these markets, recognizing that movements in one market can impact others. Traders utilize intermarket analysis to gain insights into the broader market dynamics and make more informed trading decisions.
Understanding intermarket analysis is important for traders because it provides a comprehensive view of the financial markets. By considering the interrelationships between different asset classes, traders can uncover hidden patterns and trends that may not be evident by analyzing a single market in isolation. It allows traders to assess the overall market sentiment, identify potential opportunities, and manage risk more effectively.
Traders should care about intermarket analysis because it offers a broader perspective on price movements. By analyzing multiple markets, traders can uncover leading or lagging relationships that provide valuable signals for predicting future price movements. For example, strong positive correlations between stocks and commodities may suggest a bullish trend, while divergences between bond yields and equity prices might indicate a potential market reversal.
John J. Murphy is considered one of the chief proponents of intermarket analysis. His book, “Intermarket Technical Analysis,” introduced the concept and popularized its application in trading. Murphy emphasizes the significance of intermarket relationships in understanding market trends and provides practical techniques for incorporating intermarket analysis into trading strategies. Lou Mendelsohn is the founder of Vantagepoint Software and the pioneer in delivering a powerful means to quantify and qualify Intermarket relationships for traders.
Intermarket analysis helps traders understand price movement by identifying intermarket relationships that influence market behavior. For instance, a rise in oil prices may lead to higher production costs for companies, impacting their stock prices and potentially weakening the broader stock market. Similarly, changes in bond yields can affect the attractiveness of different asset classes, triggering shifts in investment flows and impacting currency exchange rates.
By analyzing these intermarket relationships, traders can anticipate potential shifts in market conditions, identify trends across related markets, and make more accurate predictions about price movements. This understanding enables traders to adjust their trading strategies accordingly, exploit opportunities arising from intermarket correlations, and minimize potential risks associated with interconnected markets.
We live in a global marketplace.
Everything is interconnected.
Interest rates, Crude Oil Prices, and the volatility of the Dollar amongst thousands of other variables affect the decisions companies must make to flourish and prosper in these challenging times. Trying to determine what these factors are is one of the huge problems facing investors and traders.
Our Suggestion
The narrative which has driven $IRBT over the past week is that AMAZON is seeking to acquire the company at $61.00 per share. That has been responsible for the sudden price increase based upon the announcement that regulators in the United Kingdom gave the deal a stamp of approval.
From a pure valuation perspective, $IRBT offers a very confusing perspective. They had a horrible 2022 and have only had 1 quarter of positive growth over the past year. Revenue fell by 45% over the most recent quarter and the company posted an operating loss of $81 million.
For traders who think the Amazon acquisition will occur there could still be a 20% upside. However, should the deal fall through for any reason the risk is greater than 20%. There is a huge GAP on the chart which highlights this reality. The predictive blue line shows that the trend is clearly up. The momentum is clearly up, the value of the predictive blue line is only $46.90. Since the market is trading at $50, power traders would be looking to acquire small positions on pullbacks to the predictive blue line.
Since there is not broad analyst coverage on the stock current and future price movements will be very much dictated on whether Amazon proceeds with the deal. The company’s next earnings date is August 4 th , 2023. $IRBT is currently trading at 1.3 times sales. Amazon may look at a better valuation since their initial offer was 10 months ago and the company has not done well financially since then.
Practice solid money management on all your trades.
We will re-evaluate based upon:
- New Wall Street Analysts’ Estimates
- New 52-week high and low boundaries
- Vantagepoint A.I. Forecast (Predictive Blue Line)
- Neural Network Forecast
- Daily Range Forecast
Let’s Be Careful Out There!
It’s Not Magic.
It’s Machine Learning.
Disclaimer: THERE IS A HIGH DEGREE OF RISK INVOLVED IN TRADING. IT IS NOT PRUDENT OR ADVISABLE TO MAKE TRADING DECISIONS THAT ARE BEYOND YOUR FINANCIAL MEANS OR INVOLVE TRADING CAPITAL THAT YOU ARE NOT WILLING AND CAPABLE OF LOSING.
VANTAGEPOINT’S MARKETING CAMPAIGNS, OF ANY KIND, DO NOT CONSTITUTE TRADING ADVICE OR AN ENDORSEMENT OR RECOMMENDATION BY VANTAGEPOINT AI OR ANY ASSOCIATED AFFILIATES OF ANY TRADING METHODS, PROGRAMS, SYSTEMS OR ROUTINES. VANTAGEPOINT’S PERSONNEL ARE NOT LICENSED BROKERS OR ADVISORS AND DO NOT OFFER TRADING ADVICE.