| This week’s stock analysis is Gold -$GC |
In an inflationary world, gold has long been considered a powerful hedge, providing investors with a sense of security and financial stability. This timeless asset is favored due to its unique characteristics, such as its intrinsic value, limited supply, and global liquidity. Unlike fiat currencies, which may lose their worth during periods of economic instability, gold is perceived as a true store of value, maintaining its purchasing power as inflation rises. Furthermore, since the production of gold is finite, its value tends to appreciate over time, offering investors not only wealth preservation but also potential capital gains. Additionally, gold’s universal appeal and easy convertibility into various currencies make it an attractive and liquid investment choice in times of uncertainty. Overall, amidst the ever-changing economic landscape, gold remains a trusted investment option, helping to protect one’s hard-earned wealth against the adverse effects of inflation.
However, many investment professionals consider Gold to be a relic from a bygone era and advise against putting gold in an investment portfolio. While many individuals may view gold as a safe haven for investment purposes, there are several factors that make it less desirable as an investment option. One of the primary reasons is that gold does not generate income or cash flow – this is unlike stocks, bonds, or real estate, which may produce dividends, interest, or rental income. Furthermore, gold has historically displayed a higher degree of price volatility compared to other assets, making it susceptible to sudden value fluctuations. Storage and security also pose challenges for gold investors, as they require extra effort and cost to ensure the physical safety of the precious metal. Additionally, the market for gold can be heavily influenced by speculative and reactive trading, potentially exposing investors to sudden dips in value. Lastly, though gold is often touted as a hedge against inflation, its performance in this regard can be inconsistent, making it a less reliable option to protect one’s investment during times of economic uncertainty.
- In 2022, Central banks bought 1,136 tons of gold which represents the largest buying they have ever done.
Top 10 Countries with the Largest Gold Reserves (in tons)
United States — 8,133
Germany — 3,359
Italy — 2,452
France — 2,436
Russia — 2,299
China — 1,948
Switzerland — 1,040
Japan — 846
India — 754
Netherlands — 612
The following graphic clearly shows the bullish buying spree by Central Banks you can easily see it is at an all-time high. What is fascinating about this reality is that Central Banks, who entrust the currency of a nation are also the main entities that malign gold.
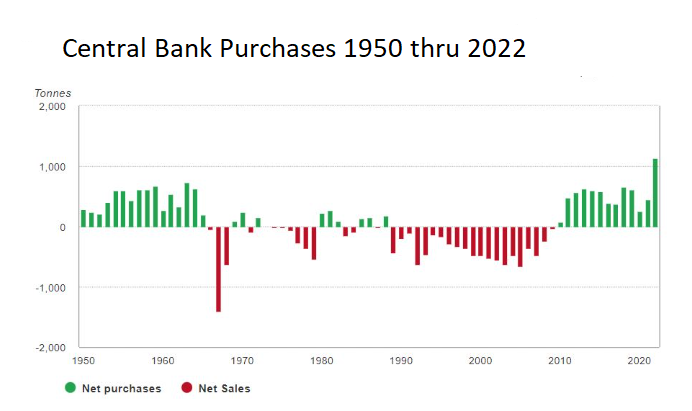
The conventional wisdom in the world of finance has long been that gold is a relic of a bygone era, a cumbersome and outdated store of value. But with central banks’ policies in question and the financial system showing huge volatility, it’s high time we challenge these traditional assumptions.
What’s striking about the precious metal’s performance is its ability to hold its value, even as economies and currencies falter. Gold’s durability and scarcity make it a reliable store of value, and its track record of outperforming paper assets during times of crisis speaks for itself.
In fact, the current banking turmoil has exposed the vulnerability of paper currencies, which are backed by nothing more than faith in increasingly shaky institutions. The fiat money system, once hailed as a triumph of modern economics, is now facing its most significant test in decades.
As skepticism towards traditional economic reasoning mounts, gold’s allure as an alternative investment vehicle continues to grow. The precious metal’s intrinsic value, universal acceptance, and ability to hold its value even as economies falter make it a compelling choice for those looking to diversify their portfolios in the face of the current banking crisis.
Of course, there are critics who argue that gold is an impractical investment, citing storage costs and liquidity concerns. However, modern financial instruments, such as exchange-traded funds (ETFs), have made it easier than ever to invest in gold, addressing these issues.
In conclusion, the ongoing banking crisis has exposed the vulnerability of the traditional financial system, prompting even the most skeptical economic journalists to reconsider the resiliency of gold as an alternative investment vehicle. As faith in traditional institutions crumbles, gold stands as a symbol of stability and security in an increasingly uncertain world.
Gold is the anti-dollar. It cannot be printed out of thin air.
In this weekly asset study, we will look at and analyze the following indicators and metrics as are our guidelines which dictate our behavior in deciding whether to buy, sell, or stand aside on a particular stock.
- Gold Seasonal Tendency Analysis
- 52-week high and low boundaries
- 10 Year High and Low boundaries
- Best Case – Worst Case Analysis and Takeaways
- Vantagepoint A.I. Predictive Blue Line Analysis
- Neural Network Forecast
- Daily Range Forecast
- Intermarket Analysis
- Our trading suggestion
We don’t base any decisions on fundamental analysis. However, we do look at them to better understand the financial landscape that an asset is operating under.
Gold Seasonal Tendency Analysis
Seasonal analysis in commodity trading is a powerful tool that can greatly enhance a trader’s decision-making process.This technique involves examining historical price patterns and trends of commodities over a specified period, usually spanning months or years, to identify potential cyclical variations. By understanding these recurring fluctuations, traders can gain valuable insights into the forces driving commodity prices and make more informed decisions when entering or exiting positions. For instance, agricultural commodities often exhibit seasonal trends due to factors such as planting and harvesting cycles, weather conditions, and demand patterns. Similarly, energy commodities may experience seasonal shifts due to changes in consumption driven by factors like temperature variations and industrial demand. Armed with this knowledge, traders can capitalize on these predictable patterns to optimize their strategies, mitigate risks, and ultimately enhance their potential for profitable trades.
Over the last 20 years Gold tends to exhibit a strong upward tendency during the first 4 months of the year.
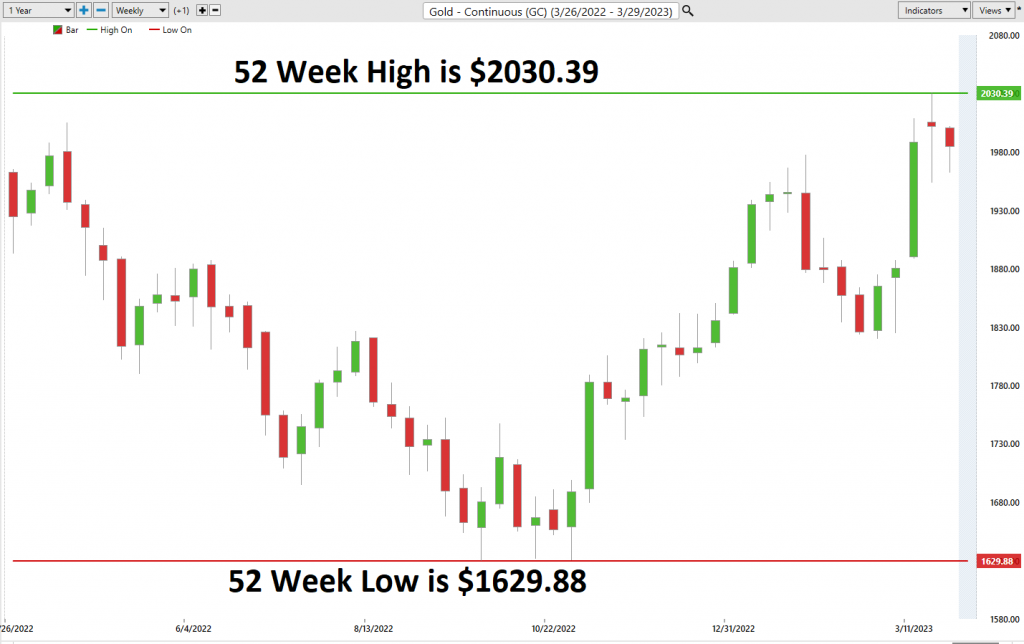
52-Week High and Low Boundaries
Looking at the Long-Term chart of GOLD provides us with the 52-week high and low boundaries.
Over the past year we have seen gold trade as low as $1629.88 and as high as $2010.39. The annual trading range was $400.51.
Currently, the stock has been trading at its 89th percentile of the last 52 weeks range.
What we would also like to do is to divide the current price by the annual trading range to get a measure of annualized volatility. This metric tells us what we can expect over the next 12 months should it be like the last 12 months. Currently, the annualized volatility in $Gold is 20.2%. What this metric tells us is that if the next 12 months are driven by similar factors as the last 12 months, it would be considered normal to see gold trade as much as 20.2% higher and lower than its current price level.
Equally as important is that being aware of the statistical volatility provides us with a benchmark value that usually hinders rallies and offers support during market declines.
Simply looking at the chart you can see the volatile journey it has been on.
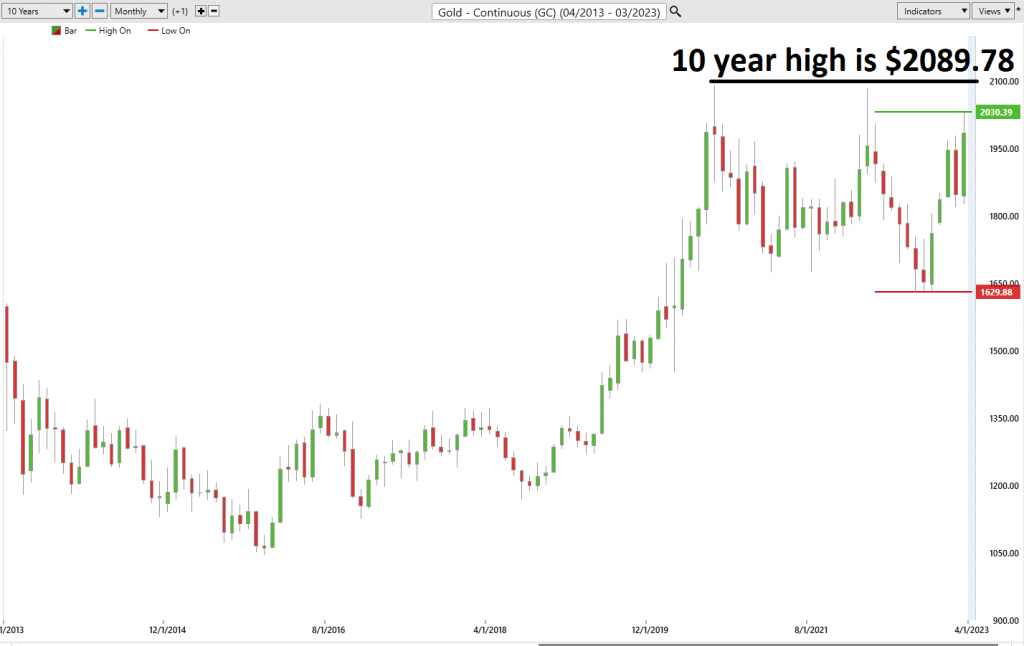
What I find most striking is the one powerful common-sense indicator that tells you massive change is underway. What I am referring to is whenever a market makes simultaneous 52 week and 10 years high it is an “exceptional multi-timeframe bull market.” This phenomenon is indicative of a strong and persistent uptrend in the market, which suggests that there is widespread positive sentiment, sustained demand, and confidence in the assets being traded.
In such a market scenario, investors and traders are likely to be optimistic about the future prospects of the underlying assets. This could be driven by factors such as economic growth, inflationary conditions, government policies, or other positive catalysts.
If we look at the longer-term 10-year chart we can see that at the present time the 10-year high is only marginally higher than the 52-week high. On the 10-year chart Gold is trading at the 90 th percentile of its 10-year range.
Best Case – Worst Case Scenario
When we study the long-term 52-week chart we can look at the best case and worst-case scenarios just to get an eyeball perspective of the risk and volatility of this asset. This is worth doing anytime you invest or trade to monetarily understand what the potential risks and rewards have been over the past year. All that we are looking to analyze is the distance and speed between highs and lows over a given year. It is worth doing this type of baseline analysis because it allows you to visually ascertain how quickly a stock drops in comparison to the speed with which it moves higher.
First, we do the Best-Case analysis:
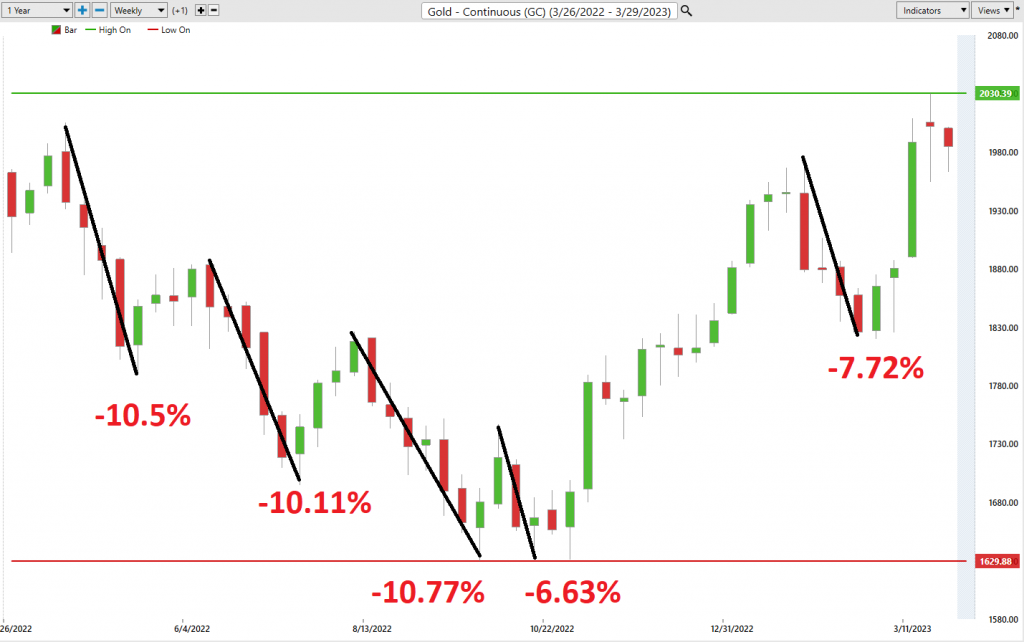
Followed by the WORST-CASE Analysis:
This initial analysis lets us see how quickly gold falls in comparison to its rallies.
Also note how the statistical volatility which we just reviewed in the previous section capped the rallies and declines over the last year.
Lastly, we compare GOLD to the broader stock market indexes over multiple time frames to determine the relative strength of GOLD compared to the stock market and compare volatility.
One conclusion that we can draw is that while Gold’s performance has by no means been stellar it has been consistently less volatile than the broader stock market indexes.
Vantagepoint A.I. Forecast (Predictive Blue Line)
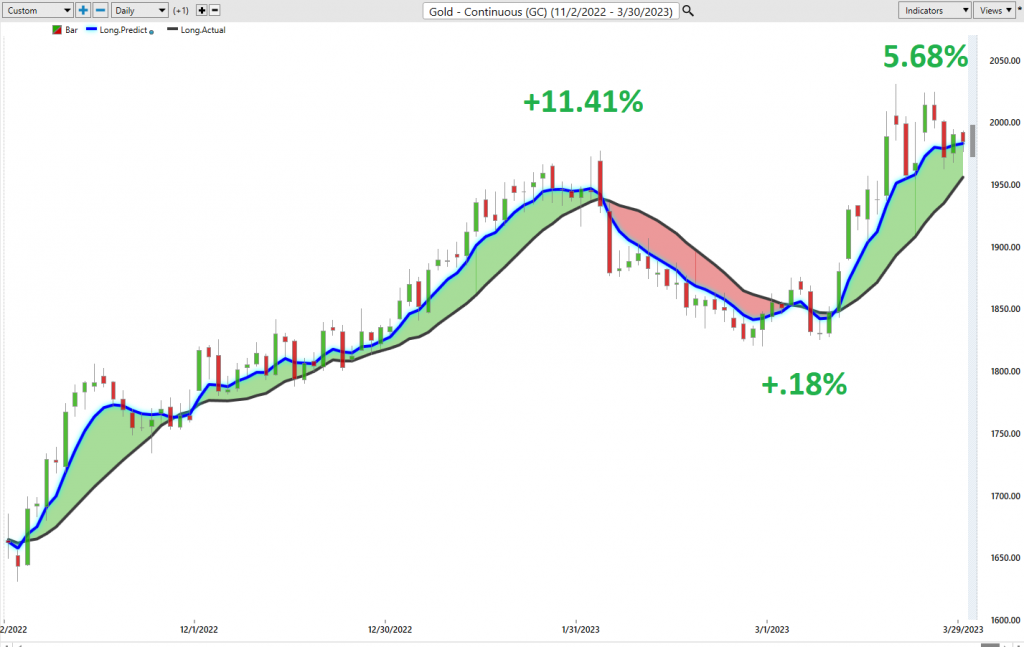
On the following chart you will see the power of the VantagePoint Predictive blue line which determines the medium term trend price forecast.
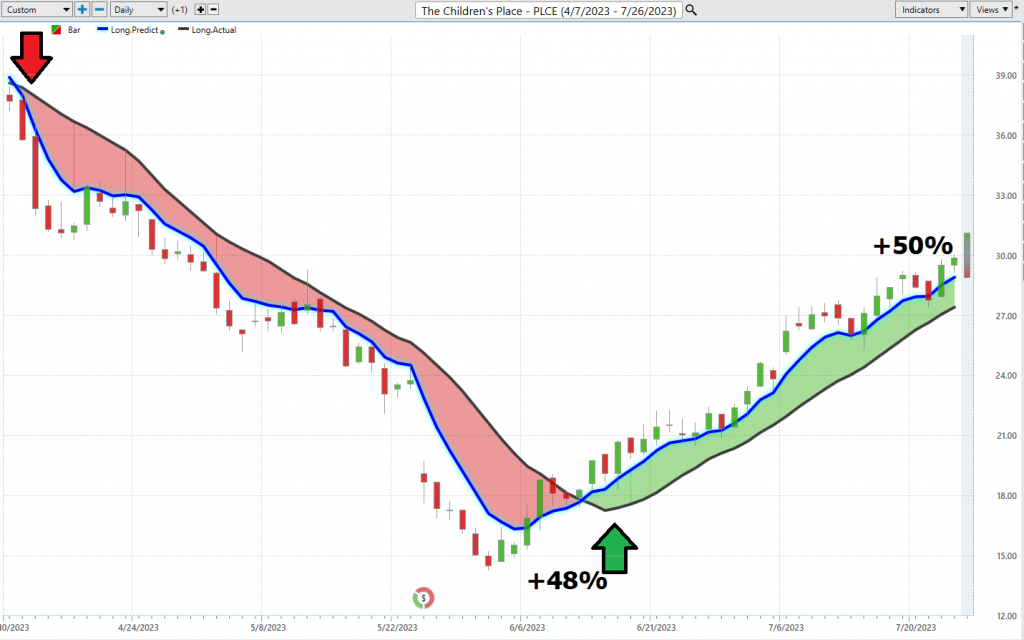
The guidelines we abide by are as follows:
- The slope of the predictive blue line determines the trend forecast and general direction of Gold
- Ideally, the VALUE ZONE is determined to try and find buy opportunities at or below the predictive blue line, or to sell opportunities above the predictive blue line during a downtrend.
Naturally when the predictive blue line slopes lower traders would be anticipating lower prices and either moving to the sidelines or hedging their positions.
Using VantagePoint Software and the artificial intelligence, traders are alerted to trend forecasts by monitoring the slope of the predictive blue line.
The predictive blue line, however, utilizes the VantagePoint-patented Neural Network and Intermarket Analysis to arrive at its value. It looks at the strongest price drivers of an asset through artificial intelligence and statistical correlations to determine its value.
You can quickly understand what the artificial intelligence is forecasting by simply looking at the chart. Also, observe the duration of each trend forecast was very brief.
There were three artificial intelligence trend forecasts over the last 5 months. All three were winning trades with cumulative gains of 17.27%.
Neural Network Indicator (Machine Learning)
At the bottom of the chart is the Neural Network Indicator which predicts future short-term strength and/or weakness in the market. When the Neural Net Indicator is green it communicates strength. When the Neural Net is Red it is forecasting short term weakness in the market. When it is yellow it is anticipating sideways prices.
A Neural Net is a computational learning system that uses a network of functions to understand and translate massive amounts of data into a desired output, consistently monitoring itself and improving its performance. A neural network in trading is a type of artificial intelligence system that uses algorithms to learn patterns in financial markets and make predictions about future market behavior.
The use of neural networks in trading gained popularity in the late 1980s and 1990s with advances in computer technology and the development of more sophisticated algorithms.
Neural networks help traders make better trades by identifying complex patterns and relationships within large datasets, such as historical price data, economic indicators, and other market factors. This enables traders to discover potentially profitable trading opportunities.
Prediction: Neural networks can be trained to predict future asset prices or market movements based on historical data and other inputs.
Neural Networks are essentially trainable algorithms that emulate aspects of the human brain. This means they can be trained based upon criteria for assessing risk and potential reward to determine the best move forward. This allows them to make high probability forecasts based on available historical information .
We advocate that Power Traders cross reference the chart with the predictive blue line and neural network indicator to create optimal entry and exit points.
For the serious trader, neural networks are a next-generation trading tool that can detect subtle non-linear interdependencies and patterns that traditional methods of technical analysis are unable to uncover.
Traders look for confirmation on Neural Net to position themselves LONG or SHORT in the market. In other words, when the A.I. forecast is green, and The Neural Net is green, that presents a buying opportunity.
The inverse is also true, when the A.I. forecast is red and the Neural Net is red, that is a selling opportunity. The arrows on the chart below highlight the trading zones where Power Traders could’ve been using double confirmation to BUY in cross referencing the A.I. forecast with the Neural Net.
The arrows on the chart are the moments when the a.i. and the neural index were both pointing in the same direction.
Power Traders are always looking to apply both the Neural Network and A.I. to the markets to find statistically sound trading opportunities.
VantagePoint Software Daily Price Range Prediction
Here are the broad range of trading metrics on Gold over the past year.
These metrics tell you statistically what has occurred. What traders must always do is determine how to put this knowledge into action. This data provides a snapshot of what is considered “NORMAL.”
Volatility, opportunity, and risk are three interrelated concepts that play a significant role in trading and investment decisions. Volatility refers to the fluctuation of an asset’s price over a certain period, signifying the degree of uncertainty or variability in its value. These price variations can lead to either gains or losses for traders, depending on the direction and magnitude of the movements.
Risk, in this context, refers to the probability of suffering financial losses due to the inherent uncertainty of the market. Volatility and risk are closely connected since the level of volatility often serves as an indicator of the potential risks involved in a trade. Higher volatility typically corresponds to greater risk, as the likelihood of substantial price fluctuations increases, making it harder for traders to accurately predict the asset’s performance.
In essence, while volatility can create lucrative opportunities for traders, it simultaneously exposes them to increased risks. The challenge lies in striking a balance between seizing these opportunities and effectively managing the accompanying risks. To navigate this delicate interplay, traders should employ a robust risk management strategy, which may include setting stop-loss orders, diversifying their portfolios, and regularly reassessing their risk tolerance in light of the prevailing market conditions. By understanding and actively managing the interplay between volatility, opportunity, and risk, traders can make more informed decisions and potentially enhance their overall returns.
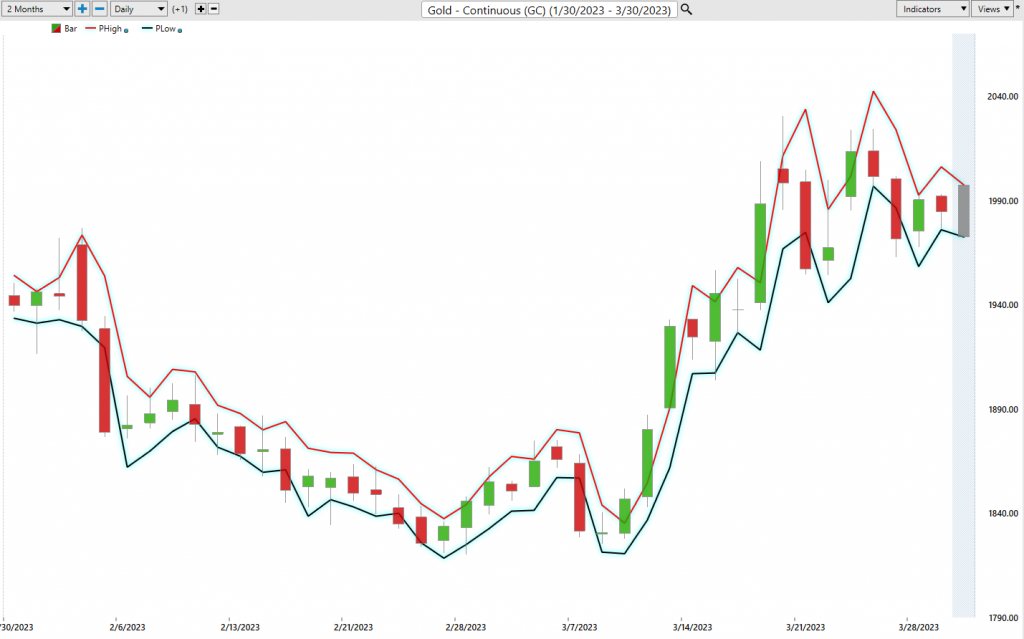
The Vantagepoint A.I. daily range forecast is what permits Power Traders to truly fine tune their entries and exits into the market.
Every day traders are faced with the anxiety and frustration of wondering where they should be looking to buy and sell the market. VantagePoint’s A.I. makes this decision super easy with the Daily Price Range Forecast.
This chart helps traders decide where stop placement should occur. Observing how placing protective sell stops below the dark line on the chart was a powerful way to minimize risk on this trade.
See how the upper and lower bands of the price range forecast for a clear channel of trading activity as well. Swing traders are always looking for buying opportunities towards the bottom of the predicted channel and try to find selling opportunities above the top band.
Intermarket Analysis
Power lies in the way we respond to the truth we understand.
One of the supremely important questions in trading is what is driving the price? Headlines often create interesting narratives. But these “stories” only capture the imagination. Traders want and need to understand the cause and effect of price movement.
The only way to get an answer to this important question is through intermarket analysis which looks at the key drivers of an asset and the statistical price correlations of assets.
We live in a global marketplace.
Everything is interconnected.
Analyzing intermarket relationships is a complex process that leaves no stone unturned.
Intermarket analysis is a concept used in trading where relationships between different financial markets are analyzed to detect opportunities. The objective of this analysis slants towards how one specific market affects another, providing an underlying understanding of how various instruments are impacted by shifts in supply and demand. Developed by esteemed economist John Murphy in the 1980s, as well as Vantagepoint A.I. founder, Lou Mendelsohn, intermarket analysis is used by traders to predict movement in markets by considering the correlation between different asset classes, such as bonds and stocks. Traders make decisions based on factors that relate to the overall direction of the market or economy – for example, when looking at commodities, traders include interest rates, currency trends and inflation. Due to its uniqueness and potential practical applications in trading strategies, intermarket analysis has thrived among investors for decades.
Intermarket analysis is a method of analyzing the financial markets by examining the correlations and relationships between different asset classes, such as stocks, bonds, commodities, and currencies. The primary objective of intermarket analysis is to identify emerging trends, potential opportunities, and market risks by observing how these asset classes interact with and influence one another.
Traders use intermarket analysis to make better trading decisions in several ways:
Identifying correlations.
Understanding the relationships between various asset classes can help traders create a diversified portfolio.
Identifying leading indicators and key price drivers.
In summary, intermarket analysis is a valuable tool for traders looking to make better-informed decisions by considering the complex relationships and correlations between different asset classes. By identifying emerging trends, and potential opportunities or risks, traders can enhance their decision-making process and improve their overall trading performance.
Interest rates, Gold Prices, and the volatility of the Dollar amongst thousands of other variables affect the decisions companies must make to flourish and prosper in these particularly challenging times. Trying to determine what these factors are is one of the huge problems facing investors and traders.
You always have a choice. You can tune in to the talking heads in the media who spin talking points which promote fear. Or you can rely on facts to base your decision making on.
Within the Intermarket Analysis graphic, you will see the 31 markets that are the key drivers of Gold’s price.
There is great value to be had in studying and understanding the key drivers of Gold’s price action.
Suggestion
For years, the prevailing belief in the financial world has been that gold is an outdated and cumbersome store of value, a remnant of times long past. However, with central banks’ policies coming under scrutiny and the financial system teetering on the edge, it’s time to reevaluate these long-standing assumptions.
As the banking crisis unfolds and trust in traditional institutions wanes, investors are increasingly looking for alternative investment vehicles to safeguard their wealth. Gold, long considered an unconventional choice, is now reemerging as a reliable and resilient option, even for the most skeptical economic journalists.
Three weeks ago, banks began failing, and many believe the problem to be systemic, stemming from the mandate for banks to own “risk-free” treasuries. Despite yet another “emergency” bailout from the Federal Reserve, the situation seems far from resolved. In fact, it seems our financial markets have become addicted to Fed interventions, which have become increasingly frequent over the last four decades.
Indeed, the ongoing banking chaos has revealed the fragility of paper currencies.
As skepticism towards traditional economic reasoning mounts, gold’s allure as an alternative investment vehicle continues to grow. The precious metal’s intrinsic value, universal acceptance, and ability to hold its value even as economies falter make it a compelling choice for those looking to diversify their portfolios in the face of the current banking crisis.
Of course, there are critics who argue that gold is an impractical investment, citing storage costs and liquidity concerns. However, modern financial instruments, such as exchange-traded funds (ETFs), have made it easier than ever to invest in gold, addressing these issues.
In conclusion, the ongoing banking crisis has exposed the vulnerability of the traditional financial system, prompting even the most skeptical economic journalists to reconsider the resiliency of gold as an alternative investment vehicle. As faith in traditional institutions crumbles, gold stands as a symbol of stability and security in an increasingly uncertain world.
Simply monitor the 52 week high at $2030.39 and the 10 year high at $2089.78. When these levels are successfully breached even the most skeptical of Gold critics will be forced to admit that the yellow metal is in a massive bull market phase.
Monitor the a.i. forecast.
Use solid risk management on all your trades.
It is going to get interesting out there.
The trend is UP.
Seasonal Tendency is positive.
Artificial Intelligence. forecast is positive.
The Neural Network forecast is positive.
Place Gold on your radar for numerous trading opportunities in 2023.
Our recommendation is to follow the A.I. trend analysis as outlined in this stock study and practice good money management on all trades.
We will re-evaluate daily based upon:
- New 52-week high and low boundaries
- Vantagepoint A.I. Forecast (Predictive Blue Line)
- Neural Network Forecast
- Daily Range Forecast
Let’s Be Careful Out There!
It’s Not Magic.
It’s Machine Learning.
Disclaimer: THERE IS A HIGH DEGREE OF RISK INVOLVED IN TRADING. IT IS NOT PRUDENT OR ADVISABLE TO MAKE TRADING DECISIONS THAT ARE BEYOND YOUR FINANCIAL MEANS OR INVOLVE TRADING CAPITAL THAT YOU ARE NOT WILLING AND CAPABLE OF LOSING.
VANTAGEPOINT’S MARKETING CAMPAIGNS, OF ANY KIND, DO NOT CONSTITUTE TRADING ADVICE OR AN ENDORSEMENT OR RECOMMENDATION BY VANTAGEPOINT AI OR ANY ASSOCIATED AFFILIATES OF ANY TRADING METHODS, PROGRAMS, SYSTEMS OR ROUTINES. VANTAGEPOINT’S PERSONNEL ARE NOT LICENSED BROKERS OR ADVISORS AND DO NOT OFFER TRADING ADVICE.