| This week’s stock analysis is Horizon Pharma – ($HZNP) |

Horizon Pharma is a biopharmaceutical company that was founded in 2005 by Timothy P. Walbert, Lesley Russell and Dr. Patrick O’Brien. The company focuses on developing and commercializing medicines to treat rare and orphan diseases, as well as pain therapies. Rare orphan diseases are those conditions that affect fewer than 200,000 people in the United States. These rare diseases are often collectively referred to as “orphan” since there is often little-to-no funding or research available for them. Examples of rare orphan diseases include Duchenne muscular dystrophy, spinal muscular atrophy, cystic fibrosis and Gaucher disease. Unfortunately, due to the limited financial resources available, diagnosis of these conditions can take years and treatments are typically very costly if they are even available at all. People living with rare orphan diseases can face major health issues throughout their lifetimes as medical professionals remain uncertain about the long-term effects of such illnesses in addition to the lack of treatment options. This makes awareness and advocacy efforts more important than ever in the fight against rare orphan diseases.
For decades, Horizon Pharma has been dedicated to creating life-changing medicines for people with uncommon conditions through their team of experienced drug developers, knowledgeable business operations and established commercialization initiatives. Competition for the specialty pharmaceutical industry is fierce – major players such as Pfizer and Selena Group Levena Pharmaceuticals provide stiff competition for Horizon Pharma in this domain. However, Horizon Pharma stands out from its competitors with cutting-edge technology and innovative methods which make them a leader in the field of rare and orphan diseases.
Shares of $HZNP have exploded in the past month as Amgen ($AMGN) plans to acquire Horizon is a deal that values $HZNP at a value of $27.8 billion. For the past few months $HZNP has been in talks with Amgen, Johnson and Johnson as well as Sanofi about potentially being acquired. The deal is expected to be completed in the first quarter of 2023 as Horizons shareholders must first approve the buyout.
Earnings are forecast to grow 29.17% per year.
Earnings have grown 57.2% per year over the past 5 years.
What is unusual about $HZNP is that INSIDERS have been selling the stock over the past 3 months. This is unusual because normally insiders do not sell their shares before a buyout occurs. AMGEN ($AMGN has a market cap of $141 billion and this acquisition positions them in the top ten biotech companies in the world. Biotechnology can be a confusing concept for many, yet its impact is felt worldwide. Companies in the biotechnology industry are responsible for researching and developing innovative treatments to address unmet medical needs. In this regard, some of the world’s largest biotech companies have been at the forefront of biotechnological innovation: from Amgen – developers of a revolutionary osteoporosis treatment – to Celgene, who focus on therapies targeting cancer and inflammatory diseases such as psoriasis. This ever-advancing field is being driven forward by investments from these large biotech companies, who are striving to find novel treatments for humanity’s most difficult conditions.
In this weekly stock study, we will look at and analyze the following indicators and metrics as are our guidelines which dictate our behavior in deciding whether to buy, sell, or stand aside on a particular stock.
- Wall Street Analysts’ Estimates
- 52-week high and low boundaries
- Best Case – Worst Case Analysis and Takeaways
- Vantagepoint A.I. Forecast (Predictive Blue Line)
- Neural Network Forecast
- Bollinger Band Analysis
- Intermarket Analysis
- Our trading suggestion
We don’t base our trading decisions on things like earnings or fundamental cash flow valuations. However, we do look at them to better understand the financial landscape that a company is operating under.
Wall Street Analysts’ Estimates
The 10 analysts offering 12-month price forecasts for Horizon Therapeutics PLC have a median target of 116.50, with a high estimate of 140.00 and a low estimate of 74.00. The median estimate represents a +3.08% increase from the last price of 113.02.
52-Week High and Low Boundaries
Looking at the Long-Term chart of $HZNP provides us with the 52-week high and low boundaries.
Over the past year we have seen $HZNP trade as low as $57.84 and as high as $117.89. The annual trading range has been $ 60.03
Currently, the stock is trading at its 93rd percentile of the last 52 weeks range.
What we also like to do is to divide the current price by the annual trading range to get a measure of annualized volatility. This metric tells us what we can expect over the next 12 months should it be like the last 12 months. Currently the annualized volatility in $HZNP is 52.8% which is rather high.
It is important for traders to understand the annualized statistical volatility of a stock, as this concept serves as an essential tool that helps measure and anticipate future market movements. The higher the annualized statistical volatility for a stock, the more volatile it will be, indicating more potential movement up or down. A trader should not solely rely on this number when assessing a stock’s performance as there are many factors to consider; however, understanding annualized statistical volatility can provide valuable insight into a stock’s performance trajectory, past and present.
Simply looking at the chart you can see the volatile journey it has been on. It clearly communicates what a difficult year it has been for companies. Even after the acquisition by AMGEN has started the company ($HZNP) is still trading below its 52-week highs.
This journey is further highlighted when we study the 10-year monthly chart. By doing so we can see and determine that the 10-year high is $120.54, and the 10-year low was $1.97. $HZNP sold off 52% from its 10-year highs before recently rebounding on the takeover rumors from Amgen.
Best Case – Worst Case Scenario
When we study the long term 52-week chart we can look at the best case and worst-case scenarios just to get an eyeball perspective of the risk and volatility of this asset. This is worth doing anytime you invest or trade to monetarily understand what the potential risks and rewards have been over the past year. All we are looking to analyze is the distance and speed between highs and lows over a given year.
It is worth doing this type of baseline analysis because it allows you to visually ascertain how quickly a stock drops in comparison to the speed with which it moves higher.
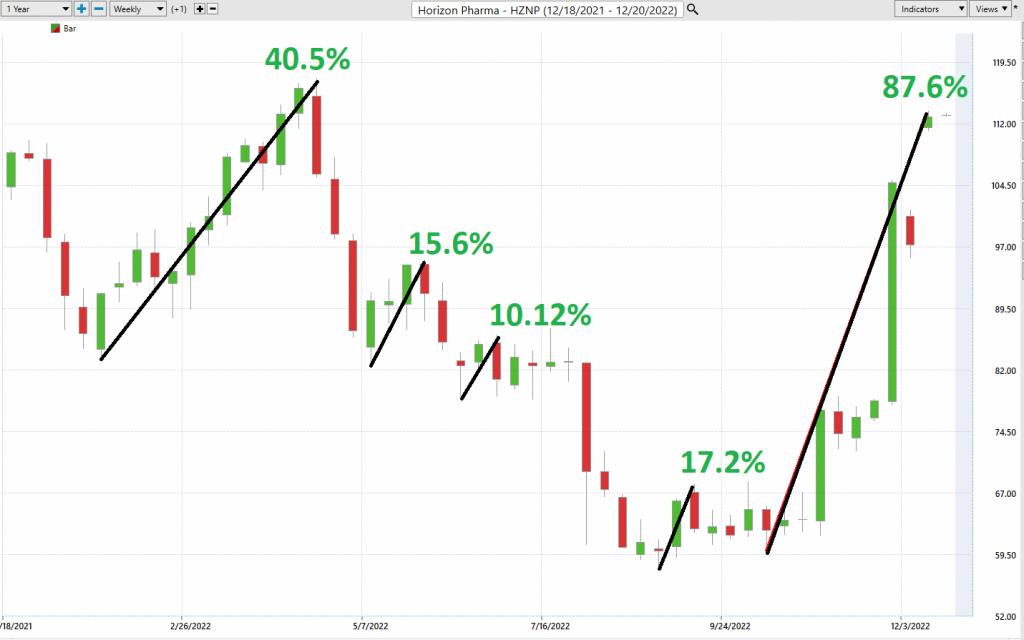
First, we do the Best-Case analysis:
Followed by the WORST-CASE Analysis:
This initial analysis lets us see how quickly $HZNP falls in comparison to its rallies. In this regard we can quickly see that the declines for the most part are larger than the rallies.
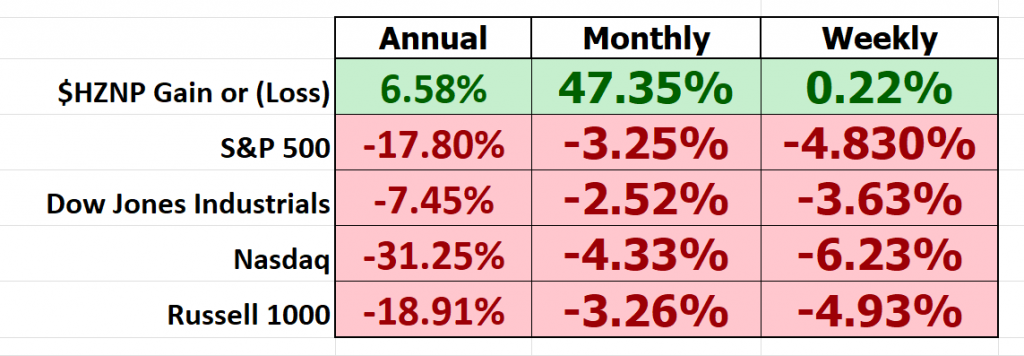
Next, we want to compare the performance of $HZNP to the major broad market indexes.
So, in $HZNP we have a volatile asset that has been all over the board and which is much more volatile than the broader market. To illustrate what a difficult year it has been in the markets, after the buyout bid began, $HZNP is basically keeping up with the pace of inflation.
Observe how the majority of the gains and retracements stay within the annualized statistical volatility range of 52.8%. The exception is the most recent rally which was spurred by the AMGEN buyout.
Earnings dates have also been a key driver in $HZNP price action. The next $HZNP earnings call is slated for Tuesday, March 7, 2023.
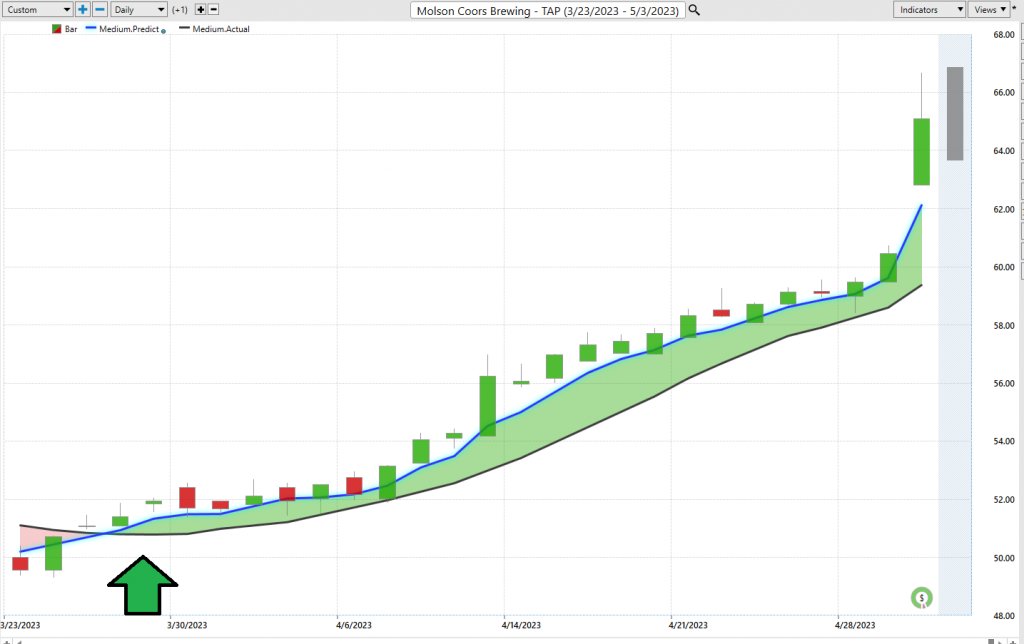
Vantagepoint A.I. Forecast (Predictive Blue Line)
The guidelines we abide by are as follows:
- The slope of the predictive blue line determines the trend forecast and general direction of $HZNP
- Ideally, the VALUE ZONE is determined to try and find buy opportunities at or below the predictive blue line, or to sell opportunities above the predictive blue line during a downtrend.
Naturally when the predictive blue line slopes lower traders would be anticipating lower prices and either moving to the sidelines or hedging their positions.
Using VantagePoint Software and the artificial intelligence, traders are alerted to trend forecasts by monitoring the slope of the predictive blue line.
The predictive blue line, however, utilizes the VantagePoint-patented Neural Network and Intermarket Analysis to arrive at its value. It looks at the strongest price drivers of an asset through artificial intelligence and statistical correlations to determine its value.
The blue line ALWAYS determines the forecast and the best move forward.
Neural Network Indicator (Machine Learning)
At the bottom of the chart is the Neural Network Indicator which predicts future short-term strength and/or weakness in the market. When the Neural Net Indicator is green it communicates strength. When the Neural Net is Red it is forecasting short term weakness in the market. When it is yellow it is anticipating sideways prices.
A Neural Net is a computational learning system that uses a network of functions to understand and translate massive amounts of data into a desired output, consistently monitoring itself and improving its performance.
A neural network in the world of trading is an artificial intelligence system based on models that simulate the human brain. Neural networks are constructed from nodes or neurons, which act as basic processing units to exchange and convert information, allowing for an exceptional level of accuracy when compared to standard algorithms. Traders use neural networks to improve trading results as they can be taught patterns found within market data in order to anticipate changes and trends. In this way, they can gain valuable insight into the markets that would normally go undetected using traditional trading strategies. Neural networks have become increasingly popular with financial traders, who are exploring the potential A.I. has to offer in the field of finance.
Neural networks can also consider external factors like technical variables such as volume and volatility to form more accurate predictions on trading direction. As neural networks become increasingly sophisticated, they can help traders make better decisions more quickly over time without having to manually analyze huge amounts of data. Therefore, they are well-suited for both manual and automated trading strategies across various asset classes. This allows them to make high probability forecasts based on available historical information .
We advocate that Power Traders cross reference the chart with the predictive blue line and neural network indicator to create optimal entry and exit points.
For the serious trader, neural networks are a next-generation trading tool that can detect subtle non-linear interdependencies and patterns that traditional methods of technical analysis are unable to uncover.
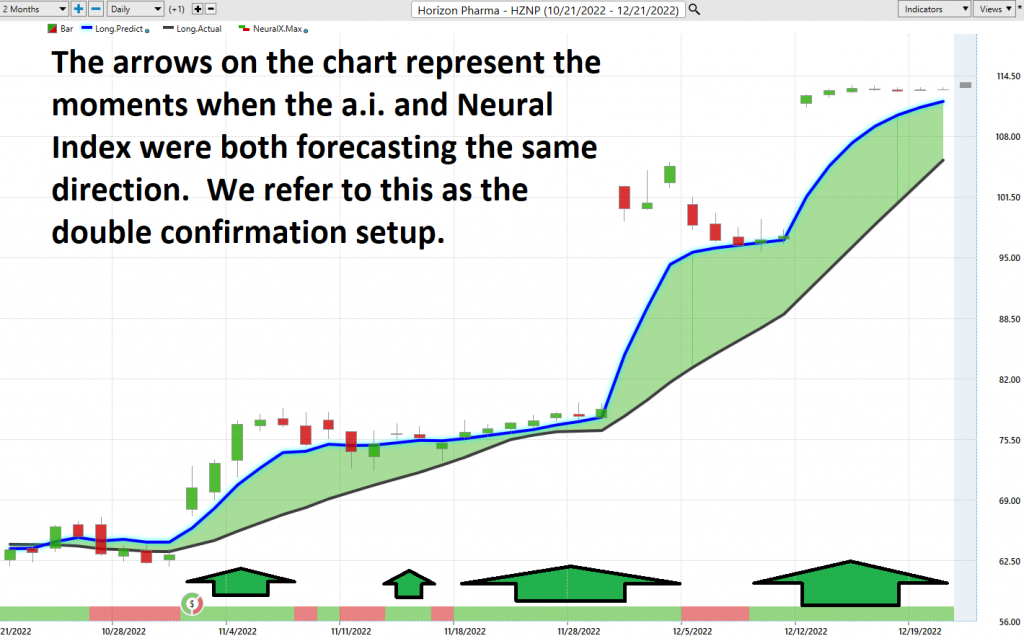
Traders look for confirmation on Neural Net to position themselves LONG or SHORT in the market. In other words, when the A.I. forecast is green, and the Neural Net is green, that presents a buying opportunity.
The inverse is also true, when the A.I. forecast is red and the Neural Net is red, that is a selling opportunity. The arrows on the chart below highlight the trading zones where Power Traders could have been using double confirmation to BUY in cross referencing the A.I. forecast with the NeuralNet.
Power Traders are always looking to apply both the Neural Network and A.I. to the markets to find statistically sound trading opportunities.
Bollinger Bands Volatility Analysis
Here are the broad range of trading metrics over the past year for HZNP.
These metrics tell you statistically what has occurred. What many traders always do is determine how to put this knowledge into action.
$HZNP offers plenty of opportunity, but this asset is risky for traders that are unaware of how to harness volatility.
Bollinger Bands are constructed using two standard deviations away from a simple moving average. This research tool, created by John Bollinger in the 1980s, is used to track the volatility and dynamics of stocks over time. When plotted, Bollinger Bands resemble envelope lines that expand outwards and inwards from a central line which sometimes signals price reversals. Each band is composed of data points that fit into a normal distribution pattern. These statistical techniques are used to create a more comprehensive understanding of price movements and trends so that investments can be made with confidence and accuracy.
By placing volatility lines above and below an asset’s historical average price, traders are able to anticipate breakouts and keep their fingers on the pulse of the markets by assessing volatility more accurately. While many traders use Bollinger Bands to spot trends, Bollinger himself advises them to not just look for band expansion or contraction but rather treat it as a proxy for volatility – which can often have more consistent effects on prices than simple trendlines. Traders can use these insights effectively to make informed decisions when entering or exiting a trade. For example, when the price hits or breaches an upper or lower band, it signals that extreme levels have been reached and it may be time to purchase or sell a position respectively.
Intermarket Analysis
Power lies in the way we respond to the truth we understand.
One of the supremely important questions in trading is what is driving the price? Headlines often create interesting narratives. But these “stories” only capture the imagination. Traders want and need to understand the cause and effect of price movement.
The only way to get an answer to this important question is through intermarket analysis which looks at statistical price correlations of assets.
We live in a global marketplace.
Everything is interconnected.
Intermarket analysis is an important tool in the financial markets, allowing traders to analyze data from different asset classes in order to identify correlations or trends that may indicate future market movements. Top traders, who are seeking to stay ahead of the curve and capitalize on markets, find intermarket analysis to be invaluable. By seeing where specific assets correlate with each other as well as economic news, top traders can gain insight into how trends may develop in the near future and easily adjust their trading strategies accordingly. Any trader looking for a reliable system for making better predictions and increasing profits should definitely consider becoming familiar with intermarket analysis; it could potentially transform their entire trading experience!
Intermarket analysis can be a great tool for investors and traders looking to determine the key price drivers of an asset. It involves considering the relationships between different markets, such as stocks, commodities, currencies, and bonds, to identify correlations that could affect the price of an asset. By understanding how changes in one market can impact on another market – and thus prices – this type of analysis allows traders to better anticipate where prices may go. It also helps them consider broader economic trends when predicting the performance of individual assets so they can make more informed decisions. Intermarket analysis is becoming increasingly important in today’s financial environment and helps investors stay one step ahead in their trading activities.
Interest rates, Crude Oil Prices, and the volatility of the Dollar amongst thousands of other variables affect the decisions companies must make to flourish and prosper in these particularly challenging times. Trying to determine what these factors are is one of the huge problems facing investors and traders.
You always have a choice. You can tune in to the talking heads in the media who spin talking points which promote fear. Or you can rely on facts to base your decision making on.
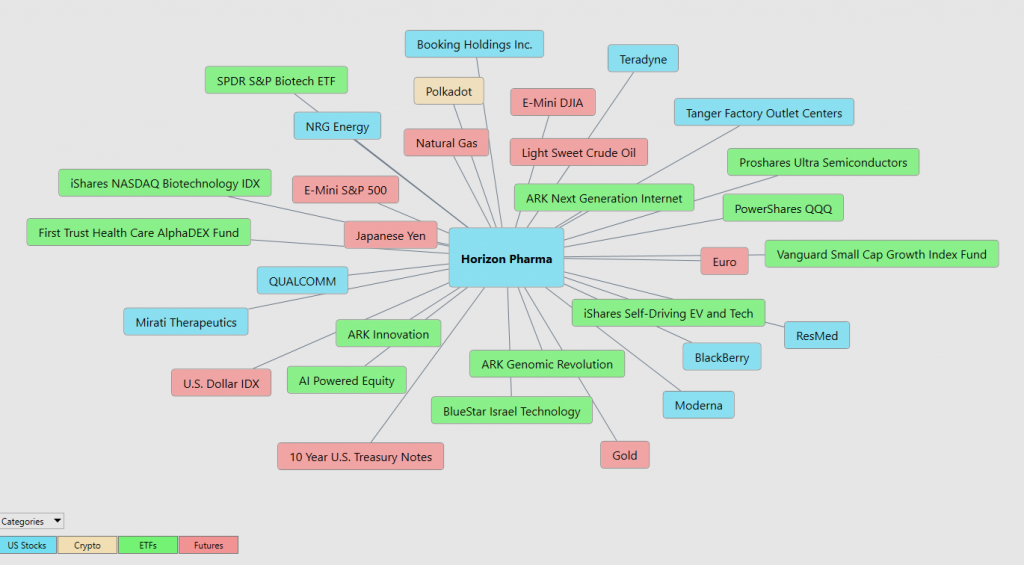
Within the following Intermarket Analysis graphic, you will see the 31 markets that are the key drivers to $HZNP’s price.
There is great value to be had in studying and understanding the key drivers of $HZNP’s price action. This graphic provides a microcosmic view of what factors have been driving $HZNP’s higher. You will find a handful of biotech and pharmaceutical ETF’s whose price action is very statistically correlated to $HZNP.
Trading Suggestion
Charts are the footprints of money flows.
When it comes to analyzing the stock market, professionals know that charts provide insight into the movement of money. This can prove valuable in giving traders a competitive advantage. What does it really mean when a trader says, “charts are the footprints of money flows”? It means that with careful analysis, artificial intelligence, machine learning and neural networks can track trends and look for clues about how money is flowing in and out of markets. By doing so, traders can often develop strategies based on specific levels of support and resistance or identify points where they may enter or exit trades. Charts tell us a lot more than just where prices have been – they capture information to allow us to make informed trading decisions.
AMGEN ($AMGN) is one of the largest biotech companies in the world. They are responsible for developing and manufacturing both biologic and small molecule drugs. AMGEN has a number of main competitors in their industry such as Regeneron, Sanofi, Pfizer, and GlaxoSmithKline. To make money, they focus on drug development with the goal of providing life-saving treatments to those that need it most. Their products span multiple therapeutic categories including cardiovascular disease, inflammation, bone health and neuroscience. Additionally, they have developed technology platforms that enable new discoveries which further power their ability to bring innovative therapies to market faster. Their acquisition of $HZNP is noteworthy.
While $HZNP has rallied 71% in the last two months, acquiring company $AMGN is only up 4.9% in the same time frame.
At present we do not feel there is much more upside potential in $HZNP. However, we do think that putting parent company $AMGN on your radar is worthy of your attention and effort. Biotech companies offer explosive opportunities and AMGEN will present some amazing swing trades in 2023.
Our recommendation is to follow the A.I. trend analysis as outlined in this stock study and practice good money management on all trades.
We will re-evaluate daily based upon:
- New Wall Street Analysts’ Estimates
- New 52-week high and low boundaries
- Vantagepoint A.I. Forecast (Predictive Blue Line)
- Neural Network Forecast
- Daily Range Forecast
The trend in $HZNP is UP. We will look to the bottom of the daily range forecast to position ourselves LONG with tight stops for short-term trades.
Let’s Be Careful Out There!
It’s Not Magic.
It’s Machine Learning.
Disclaimer: THERE IS A HIGH DEGREE OF RISK INVOLVED IN TRADING. IT IS NOT PRUDENT OR ADVISABLE TO MAKE TRADING DECISIONS THAT ARE BEYOND YOUR FINANCIAL MEANS OR INVOLVE TRADING CAPITAL THAT YOU ARE NOT WILLING AND CAPABLE OF LOSING.
VANTAGEPOINT’S MARKETING CAMPAIGNS, OF ANY KIND, DO NOT CONSTITUTE TRADING ADVICE OR AN ENDORSEMENT OR RECOMMENDATION BY VANTAGEPOINT AI OR ANY ASSOCIATED AFFILIATES OF ANY TRADING METHODS, PROGRAMS, SYSTEMS OR ROUTINES. VANTAGEPOINT’S PERSONNEL ARE NOT LICENSED BROKERS OR ADVISORS AND DO NOT OFFER TRADING ADVICE.