| This week’s stock analysis is Transocean ($RIG) |
Transocean is a company that specializes in oil and gas exploration. They have a fleet of over 140 rigs and over 13,000 employees. They were founded in 1953, and their main competitors are Schlumberger and Baker Hughes. Transocean is the world’s largest offshore drilling contractor and they have been involved in some of the deepest and most complex ocean drilling projects. The company is headquartered in Vernier, Switzerland but has offices in 20 countries including Canada, The United States, Norway, India, Brazil, Singapore, Indonesia, The United Kingdom, and Malaysia.
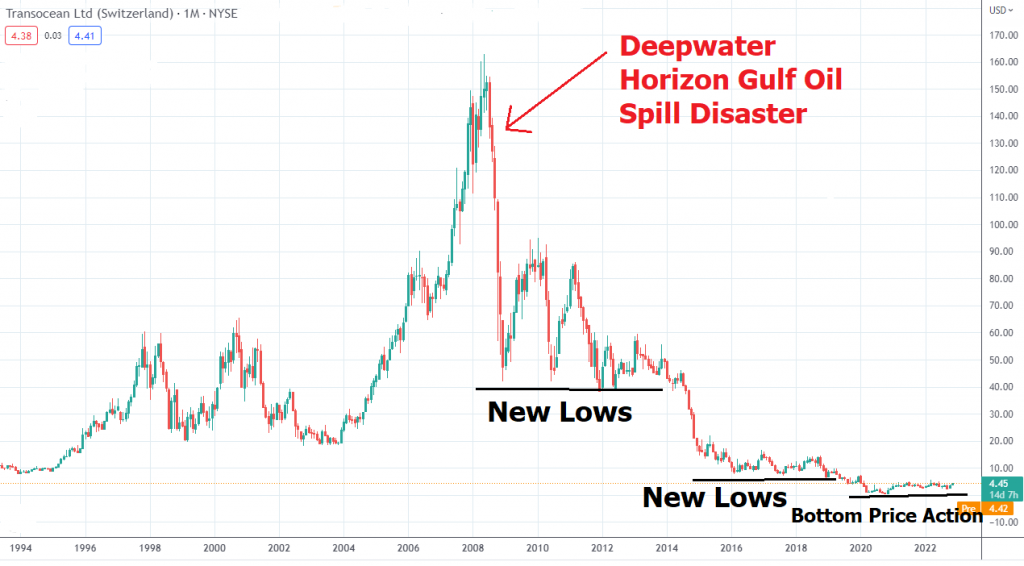
A scar which has deeply affected the company’s reputation is that the oil rig in 2010 which capsized and resulted in the Deepwater Horizon Disaster in the Gulf of Mexico belonged to Transocean. It is estimated that 377,514 metric tons of oil spilled into the Gulf of Mexico, causing a PR nightmare for the company, an ecological disaster and massive economic hardship for the coastal residents of Louisiana.
While they claim to have a strong focus on safety and environmental protection, and their rigs are continuously updated with the latest technology to ensure that they meet the highest standards, the Deepwater disaster has blemished their reputation and investors have steered clear of the stock primarily for this reason. However, it has been 12 years since this tragedy occurred. The company trades under the symbol $RIG. It has a market cap of $3.21 billion. Its chart looks like it has exhibited a very solid price bottoming pattern.
In this weekly stock study, we will look at and analyze the following indicators and metrics which are our guidelines to dictate our behavior regarding any stock analysis.
- Wall Street Analysts’ Estimates
- 52-week high and low boundaries
- Vantagepoint A.I. Predictive Blue Line
- The Best Case – Worst Case Scenarios
- Neural Network Forecast
- Daily Range Forecast
- Intermarket Analysis
- Our trading suggestion
We don’t base our trading decisions on things like earnings or fundamental cash flow valuations. However, we do look at them to better understand the financial landscape that a company is operating under.
Wall Street Analysts’ Estimates
Based on 6 Best Performing Wall Street analysts offering 12-month price targets for Transocean ($RIG) in the last 3 months. The average price target is $5.13 with a high forecast of $8.00 and a low forecast of $3.30 . The average price target represents a 13.25% change from the last price of $$4.50.
Whenever we see Wall Street estimates this divergent in their opinion it is a sign that we should expect increased volatility in the asset.
We love to see this heavily divergent opinion as it tells us that volatility is baked into the mix.
52-Week High and Low Boundaries
Over the past year we have seen $$RIG trade as low as $5.56 and as high as $2.32. This tells us that the annual trading range is $3.24.
We also like to divide the annual trading range of $3.24 by the current price of $4.50 to get a broad-based estimate of trading volatility. This tells us that the volatility of $$RIG over the past year has been 72%. This value also provides us with a basic estimate in letting us know that if the future is like the recent past, it would be normal for $$RIG to trade in a range that is 72% higher and lower from the current price over the next year.
Here is the annual 52-week chart of $$RIG so that you can see the powerful price journey it has taken over the last few months. As you study the attached chart, observe how the 52 week low price level held over a 13 week time frame.
The 52-week low price boundary is a significant level that professional traders pay close attention to for a few reasons. First, it helps them to defining what is “fair value” for a given security. Second, it can be useful in defining what is “cheap” – i.e. when a security is trading significantly below its analyst estimates, it may be an attractive buying opportunity. Finally, professional traders will often look for bottoming price action near the 52-week low boundary – this can be a helpful indication that the security is about to begin a new uptrend. As such, the 52-week low boundary is a key level that professional traders use in their analysis.
Usually, when a stock makes a 52 week low it is a very negative indication. When the negative momentum continues and the stocks makes a lower 52 week low it also is a negative bellweather. However, when the low price level is tested numerous times and holds, it is important to pay attention as you will often see tremendous price rallies based simply upon the bottoming price action. This is what has occurred in $RIG as it has rallied 95% in the last 37 trading sessions.
Power Traders will compare the Wall Street Analysts estimates with these broad volatility estimates to get a broad sense of price action in $RIG.
The price action can be explosive in a company like $RIG specifically because of how beaten up it has become over the long term. Keep in mind that $RIG is currently trading at $4.50 and before the Deepwater Horizon Gulf Oil spill it trading as high as $167.
In this particular instance the 52 week low is also a 30 year low and the stock was considered to be extremely oversold.
Best Case – Worst Case Scenario $RIG
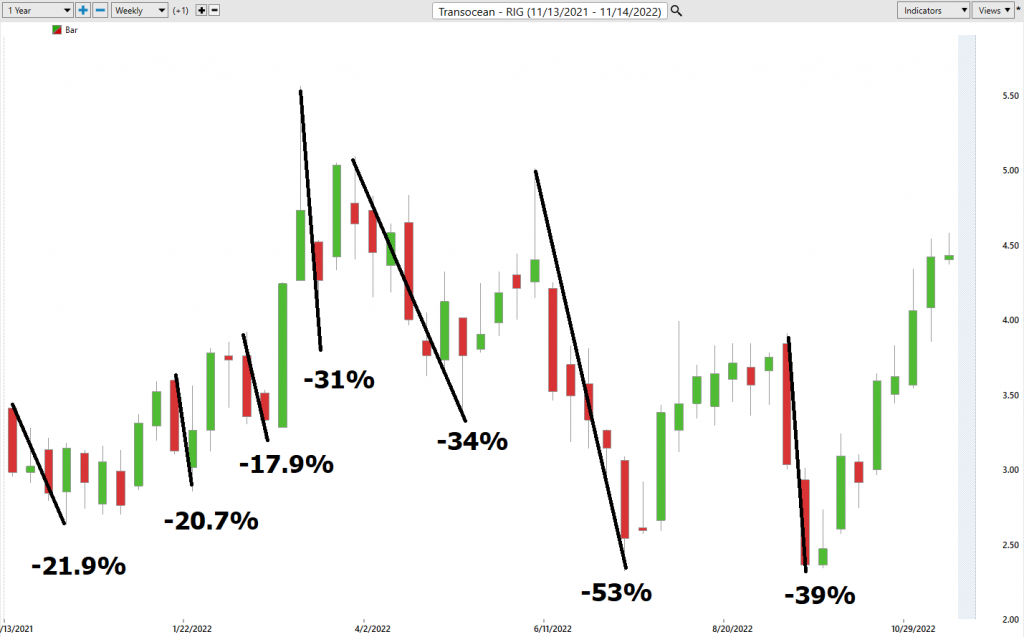
Whenever we look at a trade or long-term investment opportunity to really understand what we are dealing with we need to compare the best rallied to the worst declines to understand the assets real time volatility and then compare the performance of the asset we are considering with the returns of the major market indexes.
Great trading is always about being very aware of the potential volatility of an asset. As traders we look for MOTION. But motion is a two-edged sword and by initially looking at rallies and declines we can quickly determine whether an asset is holding on to gains or not. Keep in mind that $RIG has an annualized volatility of 72%. This means that “NORMAL” is defined that the stock could be 72% higher or lower over the coming 12 months.
Here is the BEST-CASE analysis.
Followed by the WORST-CASE Analysis:
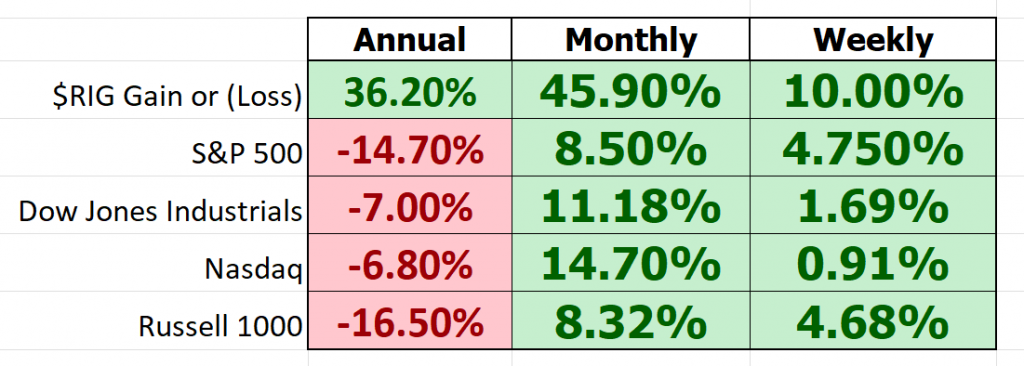
Next, we compare the performance of $RIG to the broader major stock market indexes.
$RIG has traded inverse to the broader stock market indexes.
So, we can see that in $$RIG we have a countercyclical asset.
More importantly, the drawdowns have been quite large as well. The largest drawdowns were 53% peak to trough. This tells us in $RIG we are dealing with what we refer to as a HIT and RUN trading opportunity.
Vantagepoint A.I. Forecast (Predictive Blue Line)
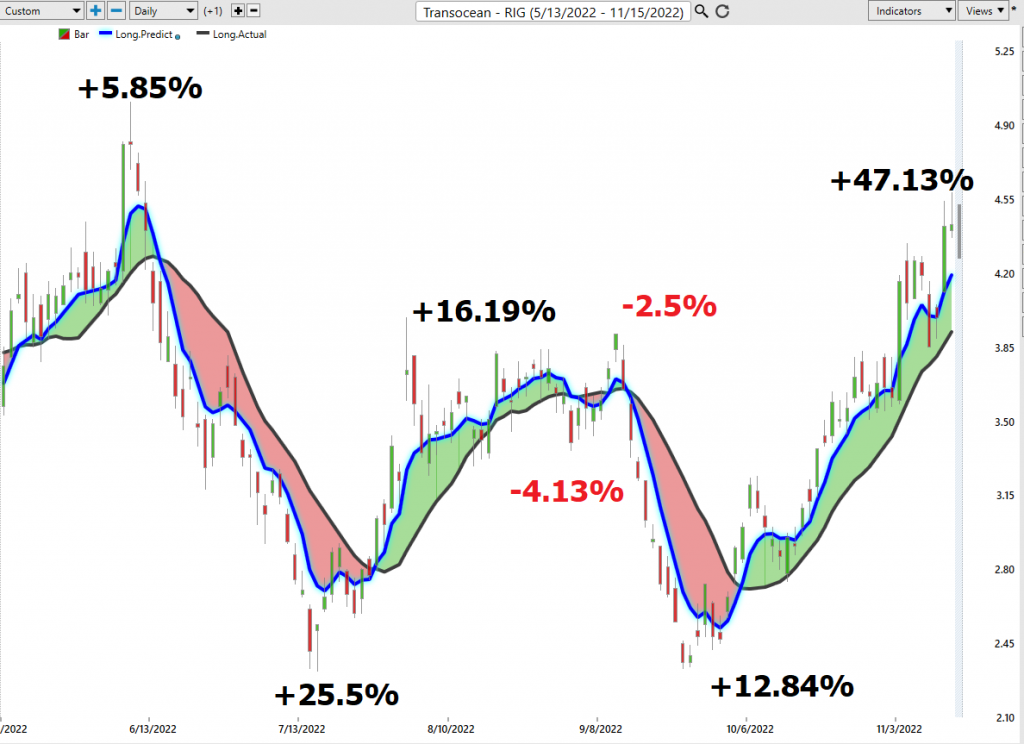
On the following chart you will see the power of the VantagePoint Predictive blue line which determines the medium term trend price forecast.
Let’s do some basic trend forecasting analysis based upon looking at the VantagePoint predictive blue line over the last year. On the following chart you will see the power of the VantagePoint Predictive blue line which determines the medium term trend price forecast.
The guidelines we abide by are as follows:
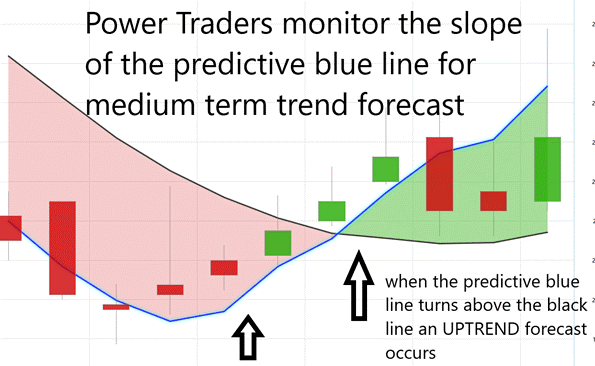
- The slope of the predictive blue line determines the trend and general direction of $RIG
- When the blue line turns above the black line an UP opportunity occurs
- When the blue line turns below the black line a DOWN opportunity occurs
- Ideally, the VALUE ZONE is determined to try and buy the asset at or below the predictive blue line
Over the last 6 months there have been 7 trading opportunities. 5 have been winners. 2 have been losers. The average winner was 21.5%. The average loser was -3.3%.
This is the power and effectiveness of the Vantagepoint A.I. forecast in assisting traders to stay on the right side of the trend at the right time.
The predictive blue line is the initial indicator which Power Traders use to monitor and navigate the trend.
Next traders cross-reference this signal with the historical pattern recognition available with machine learning and the Neural Index.
Fine Tuning Entries with The Neural Net Indicator
At the bottom of the chart is the Neural Network Indicator which predicts future short-term strength and/or weakness in the market. When the Neural Net Indicator is green it communicates strength. When the Neural Net is red it forecasts short-term weakness in the market.
A neural network is a computing system that is modeled after the brain. neural networks are composed of input nodes, output nodes, and hidden nodes. Input nodes receive information from the outside world, while output nodes send information to the outside world. Hidden nodes are neither input nor output nodes; rather, they process information internally. neural networks learn by adjusting the weights of the connections between the nodes. The stronger the connection between two nodes, the more influential that connection is. neural networks can be used for a variety of tasks, including pattern recognition and data classification.
At its essence, a Neural Net is a computational learning system that uses a network of functions to understand and translate massive amounts of data into a desired output, consistently monitoring itself and improving its performance. Neural networks are a type of artificial intelligence that is modeled after the brain. Trading neural networks are used to identify patterns in big data sets, which can then be used to make predictions about future market movements. Traders use neural networks because they can perform complex statistical and probability analysis on historical data, as well as multi-variable analysis on current market conditions. This allows them to generate trading signals with a high degree of accuracy. Neural networks have proven to be a valuable tool for traders who are looking to gain an edge in the markets.
Whenever Power Traders are looking for statistically valid trading setups, they look for a DOUBLE confirmation signal. This signal occurs whenever the blue predictive line and the Neural Net at the bottom of the chart suggest the same future expected outcome.
We advocate that Power Traders cross-reference the chart with the predictive blue line and neural network indicator to create optimal entry and exit points.
Traders look for confirmation on the Neural Net to position themselves for LONG or SHORT opportunities in the market. In other words, when the A.I. forecast is green, and The Neural Net is green, that presents a buying opportunity.
The inverse is also true, when the A.I. forecast is red and the Neural Net is red, that is a selling opportunity. The arrows on the chart below highlight the trading zones where Power Traders would’ve been using double confirmation to find a buying opportunity in cross-referencing the A.I. forecast with the Neural Net.
Power Traders are always looking to apply both the Neural Network and A.I. to the markets to find statistically sound trading opportunities.
VantagePoint Software Daily Price Range Prediction
One of the powerful features in the VantagePoint Software which Power Traders use daily is the Price Range prediction forecast.
This forecast is what permits Power Traders to truly fine tune their entries and exits into the market.
Every day traders are faced with the anxiety and frustration of wondering where they should be looking for opportunities to buy and sell the market. VantagePoint’s A.I. makes this decision super easy with the Daily Price Range Forecast. This is where the rubber meets the road.
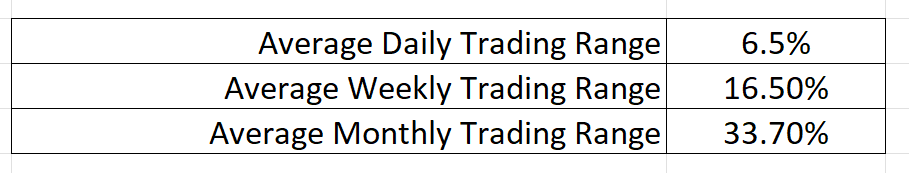
Many factors can affect the daily price range of stocks, from global political events to the weather. As a result, forecasting the daily price range is a complex task that requires careful analysis. There are a number of methods that can be used to forecast daily price ranges, including technical analysis, fundamental analysis, and news-based analysis. Technical analysis involves studying past price movements to identify patterns that may provide clues about future price behavior. Fundamental analysis focuses on economic indicators such as company earnings and interest rates. News-based analysis involves tracking breaking news stories that could have an impact on the stock market. Vantagepoint A.I. uses a proprietary algorithm that combines the power of a.i., neural networks and machine learning to provide a daily price range forecast. By using a combination of these methods, it is possible to develop a more accurate forecast of the daily stock market price range. Historically speaking this is what last year’s average trading ranges on the daily, weekly, and monthly time frames look like.
Here is the price chart of $RIG during the most recent uptrend. The software very clearly delineates the daily forecast by providing an exact lower and upper boundary and specifies the short-term trend.
This chart helps traders decide where stop placement should occur. Observe how placing protective sell stops below the dark line on the chart was a powerful way to minimize risk on this trade.
See how the upper and lower bands of the price range forecast for a clear channel of trading activity as well. Swing traders are always looking for opportunities to buy towards the bottom of the predicted channel and selling opportunities above the top band.
Intermarket Analysis
Power lies in the way we respond to the truth we understand.
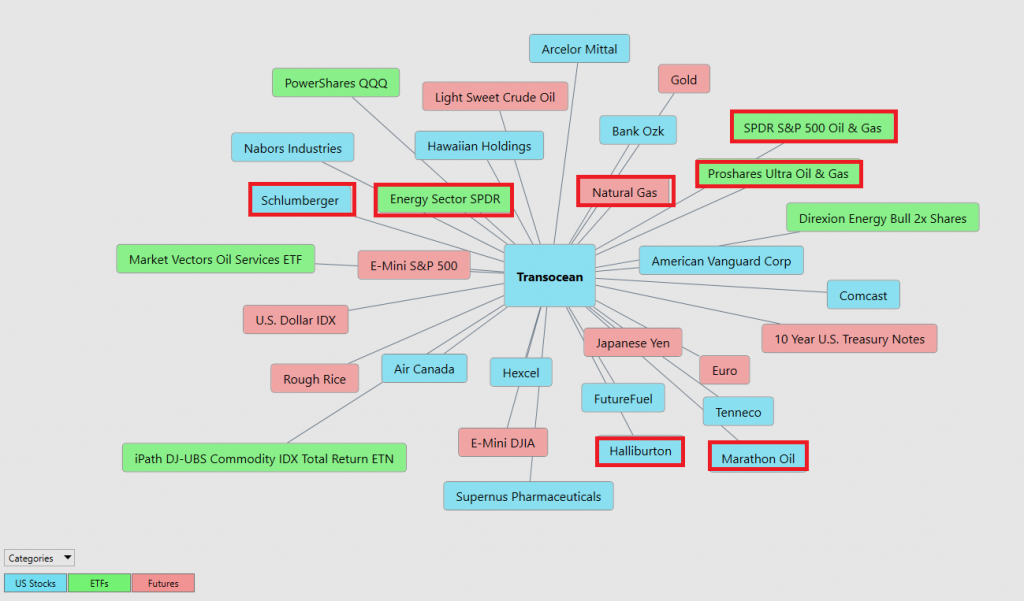
$RIG is 81.2% correlated to the Energy Sector SPDR $XLE over the last 6 months.
That is a powerful fact that traders use effectively in their decision-making process.
One of the supremely important questions in trading is what is driving the price? Headlines often create interesting narratives. But these “stories” only capture the imagination. Traders want and need to understand the cause and effect of price movement.
The only way to get an answer to this important question is through Intermarket analysis which looks at statistical price correlations of assets.
The following graphic shows you the top 31 drivers of $RIG’s price action.
Intermarket analysis is the study of relationships between different financial markets. It looks at how these markets affect each other, and how they can be used to predict future market movements. By understanding these relationships, traders can make informed decisions about where to allocate their capital. Intermarket analysis can be used to trade a variety of asset classes, including stocks, bonds, commodities, and currencies. There are a number of Intermarket indicators that can be used to identify opportunities, such as price correlations and momentum indicators. By taking the time to understand Intermarket dynamics, traders can give themselves a significant edge in the market.
So, a study of the relationship(s) will prove to be beneficial to a trader.
We live in a global marketplace.
Everything is interconnected.
Interest rates, Crude Oil Prices, and the volatility of the Dollar amongst thousands of other variables affect the decisions companies must make to flourish and prosper in these challenging times. Trying to determine what these factors are is one of the huge problems facing investors and traders.
You always have a choice. You can tune in to the talking heads in the media who spin talking points which promote fear. Or you can rely on facts to base your decision making on.
Suggestion for Traders
We have written about many oil sector stocks over the last several weeks. We are of the opinion that the Oil/Energy exploration sector is in a long-term secular bull market.
As this market approaches a more mature stage, traders and investors look for undervalued gems to position themselves in. This is what has occurred in $RIG. As we have discussed $RIG has lagged the rest of the sector because of its association with the Deepwater Horizon disaster 12 years ago.
We like the price action in $$RIG. Our expectation is that volatility will increase, and the stock will challenge its 52-week highs.
But we think that as long as the a.i. is signaling an uptrend in $$RIG that we should use these pullbacks to scale in small tradeable positions.
The Weekly, monthly, and yearly trends are UP. Since $RIG is a very volatile asset it can easily pull back towards the $4.08 area and still maintain its upward trajectory.
PUT $RIG on your radar and allow the a.i. to guide your trading decisions.
Practice solid money management on all your trades.
We will re-evaluate based upon:
- New Wall Street Analysts’ Estimates
- New 52-week high and low boundaries
- Vantagepoint A.I. Forecast (Predictive Blue Line)
- Neural Network Forecast
- Daily Range Forecast
Let’s Be Careful Out There!
Remember, It’s Not Magic.
It’s Machine Learning.
Disclaimer: THERE IS A HIGH DEGREE OF RISK INVOLVED IN TRADING. IT IS NOT PRUDENT OR ADVISABLE TO MAKE TRADING DECISIONS THAT ARE BEYOND YOUR FINANCIAL MEANS OR INVOLVE TRADING CAPITAL THAT YOU ARE NOT WILLING AND CAPABLE OF LOSING.
VANTAGEPOINT’S MARKETING CAMPAIGNS, OF ANY KIND, DO NOT CONSTITUTE TRADING ADVICE OR AN ENDORSEMENT OR RECOMMENDATION BY VANTAGEPOINT AI OR ANY ASSOCIATED AFFILIATES OF ANY TRADING METHODS, PROGRAMS, SYSTEMS OR ROUTINES. VANTAGEPOINT’S PERSONNEL ARE NOT LICENSED BROKERS OR ADVISORS AND DO NOT OFFER TRADING ADVICE.