| This Week’s a.i. Stock Spotlight is Qualcomm ($QCOM) |

Qualcomm, headquartered in San Diego, California, was founded by Irwin Jacobs and Andrew Viterbi in 1985. Employing around 51,000 people, Qualcomm is a titan in the semiconductor industry, focusing on designing and developing integrated circuits and system software for advanced wireless technology. Their Snapdragon processors power high-performance smartphones with superior connectivity, processing power, and energy efficiency. Qualcomm’s main revenue driver is its extensive patent portfolio, generating significant income through licensing and royalties on wireless products and services. At the forefront of the 5G revolution, Qualcomm is also advancing automotive technology with its Snapdragon Digital Chassis and expanding its reach in IoT, enabling smart devices to communicate seamlessly. However, the semiconductor industry is capital-intensive, requiring relentless investment in R&D. Geopolitical factors, trade tensions, and fierce competition from Nvidia, Intel, and AMD pose significant risks. Qualcomm carries approximately $15.37 billion in debt, but its market cap remains strong at around $140 billion. While Nvidia dominates the AI race, Qualcomm’s edge lies in delivering efficient A.I. processing to edge devices, positioning it for substantial growth as the AI landscape evolves.
Qualcomm’s business model focuses on driving innovation and enabling the connected world through its leadership in the semiconductor industry. The company designs, develops, and supplies integrated circuits and system software based on advanced wireless technology. Qualcomm’s core products include processors, modems, and system-on-chips (SoCs) that power mobile devices, automotive systems, networking equipment, and IoT applications. Additionally, Qualcomm generates significant revenue from licensing its extensive patent portfolio, which includes royalties on the use of its intellectual property in wireless products and services.
In addition to mobile technology, Qualcomm is at the forefront of the transition to 5G, developing solutions that drive this next-generation wireless standard. The company is expanding into new industries, including automotive, where its Snapdragon Digital Chassis platform enhances in-car experiences with connectivity, safety, and autonomous driving capabilities. In the IoT sector, Qualcomm’s technologies enable smart devices and infrastructure to communicate seamlessly, promoting the growth of smart cities and connected ecosystems. Through strategic investments in research and development and collaborations with global partners, Qualcomm remains committed to advancing the technology landscape and delivering value to its stakeholders.
With their Snapdragon X Elite chip, Qualcomm is set to revolutionize A.I. across multiple sectors. This isn’t just about adding bells and whistles; it’s about fundamentally transforming how devices operate. The rollout of 5G technology amplifies these opportunities, enabling faster, more efficient A.I. applications that can operate in real-time. Qualcomm’s expertise in creating low-power, high-performance chips positions it perfectly to dominate this space.
Qualcomm faces serious headwinds. The semiconductor industry is capital-intensive, requiring relentless innovation and investment. Geopolitical tensions and trade restrictions could disrupt their plans, and fierce competition from Nvidia, Intel, and AMD is always a threat. Nvidia is the current leader in cloud and data center A.I., while Intel and AMD are also making strategic moves in the A.I. market. Qualcomm’s strength lies in delivering efficient A.I. processing to edge devices, a segment poised for massive growth.
Qualcomm is in a prime position to seize new opportunities, but it must navigate significant risks and fierce competition. Over the last seven years, Qualcomm has grown revenue despite volatility, averaging a 10.1% annual growth rate. Despite a 19% revenue decline in 2023, Qualcomm’s ability to sustain growth in the competitive semiconductor niche is noteworthy. Keep an eye on this space because the A.I. revolution is just heating up!
In this stock study we will look at the following metrics and indicators.
- Wall Street Analysts’ Estimates
- 52-week high and low boundaries
- The Best Case – Worst Case Scenarios
- Vantagepoint A.I. Predictive Blue Line
- Neural Network Forecast
- Daily Range Forecast
- Intermarket Analysis
- Our trading suggestion
We don’t base decisions on things like earnings or fundamental cash flow valuations. However, we do look at them to better understand the financial landscape that a company is operating under.
Wall Street Analysts’ Estimates
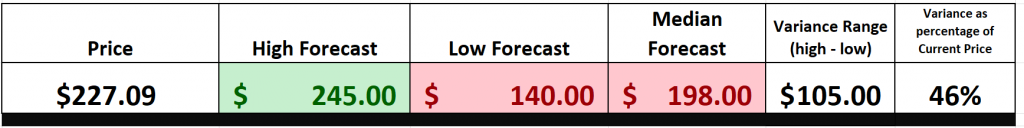
Over the past three months, 28 Wall Street analysts have provided 12-month price targets for Qualcomm. The average target stands at $198.00, with projections ranging from a high of $245.00 to a low of $140.00 . This average target indicates a potential decline of 12.81% from Qualcomm’s recent trading price of $227.09.
We pay attention to the variance between the most bullish and most bearish forecasts which currently stands at 46% of the current price or $105. This variance is a simple and practical way of measuring expected volatility moving forward.
This is a moderately high level of volatility and certainly tells us as traders to buckle up!
52-week high and low boundaries
Smart traders know that one of the most crucial checks in their arsenal is the 52-week high and low boundaries of a stock. This metric serves as a momentum barometer, giving a clear snapshot of the asset’s performance over the past year. Many traders consider this an essential filter, almost like a report card on the stock’s vitality. They avoid stocks languishing near their mid-range or lows, indicative of poor momentum, and instead zero in on those that show a solid, upward trend with pronounced momentum. It’s all about staying in the game with stocks that are on the move, riding the waves of growth rather than sinking with the laggards.
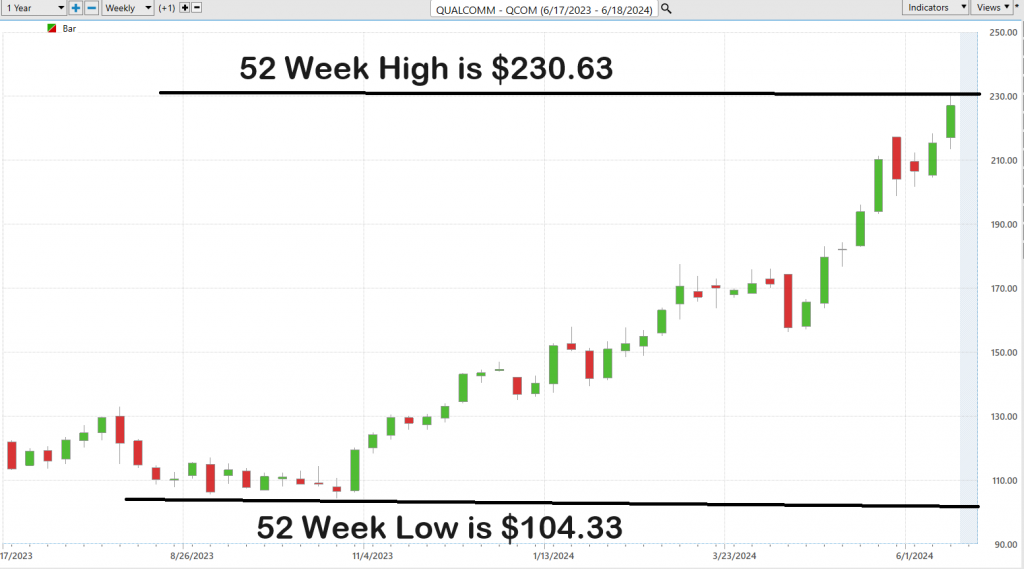
Let’s zero in on the rollercoaster ride that is Qualcomm’s stock ($QCOM) over the past year. This powerhouse has hit a high of $230.63 and trades as low as $104.33, folks—that’s a swing of $126.30. Cracking into these figures, we see Qualcomm has shown a historic annual volatility of 56%. Now, that’s much higher than the broader market indexes. What’s the takeaway here? It tells us loud and clear that swings of about 56% up or down are totally on the table for Qualcomm in the coming year.
But here’s where it gets spicy: Qualcomm is trading at the 97th percentile of its 52-week range. That’s right, at the top end of its game, signaling a bullish sentiment that’s got investors leaning in.
Now, why should you care about a stock’s 52-week highs and lows? These aren’t just numbers, my friends—they’re the grades on the report card of the stock’s annual performance. They give us a crystal-clear view of the stock’s trajectory and are pivotal for spotting trends. When you’ve got a stock like Qualcomm consistently making new 52-week highs and new 10-year highs simultaneously, it is communicating loud and clear that it is overcoming all obstacles related to its success. This kind of momentum often fuels itself, pushing the stock to even greater heights.
And remember, when a stock breaks above its 52-week high, it’s not just any signal—it’s a blazing green light that might just be pointing to a golden trading opportunity. Conversely, slipping below its 52-week low can flash a big red warning.
To all the traders out there, always keep an eye on those stocks hitting both new 52-week and 10-year highs—it’s a telltale sign that something significant is happening, something that’s overcoming historical barriers. Even if you’re not sure what’s driving the price, the market is clearly telling you this stock is one to watch closely. Buckle up, because in the volatile world of the stock market, staying alert to these signals can lead to some of the most lucrative trading moves!
Qualcomm stock has been making new 52-week highs and new 10-year highs simultaneously. For this reason alone, it deserves to be on your trading radar!
Best-Case/Worst-Case Analysis
Let’s talk risk and reward – a fundamental concept for any trader. It’s not about fancy algorithms, it’s about understanding the playing field. We’re talking about mapping out the upside and downside for trading opportunities while looking clearly at the possibilities. Think of it like sailing – you need to know the historical currents of the market to navigate effectively.
Let’s pull up that chart – it’s like a map of the past year’s rallies and dips, the market’s ocean waves in action. This isn’t just about jargon; it’s about getting a real feel for QCOM’s risk and reward profile. It’s a hands-on exercise that quickly highlights the potential gains and losses. It’s a roadmap of volatility over the last 52 weeks.
Now, here’s the key: we need to balance those bullish surges with the inevitable downturns. It’s about understanding the volatility, the rough seas you might encounter. This isn’t about flashy moves, it’s about strategic thinking. By analyzing the strength of the rallies and declines, we get a clear picture of the stock’s potential and the inherent risks involved.
Don’t just skim those charts – dive deep. This isn’t just about tactics; it’s about building a strategy that empowers you. We’re talking informed decisions; savvy moves that manage your exposure and build a resilient trading plan.
Why is this so crucial? Because it’s practical. If history is any guide, we might see similar volatility in the future. Instead of playing the guessing game, we get a real-world perspective on risk and reward.
Now, let’s get specific. Based on this historical analysis, we can size up the potential strength of the rallies and measure them against the weakness of the declines for $QCOM over the past year.
First, let’s consider the best-case scenario:
Next, let’s look at the worst-case scenario:
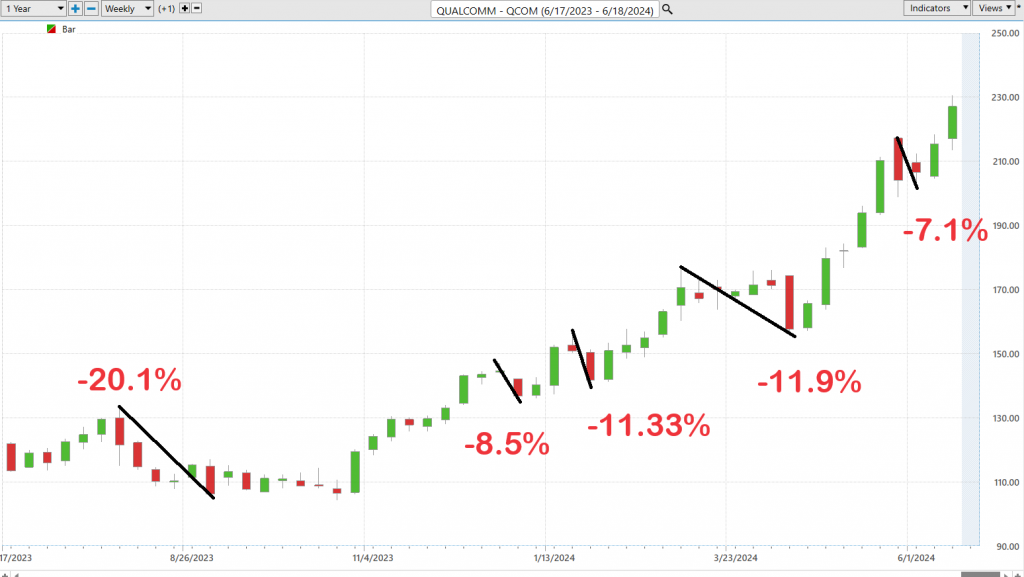
What can we learn from this simple exercise? When we compare the magnitude of the rallies to that of the declines, we can easily see that the bulls over the last 52 weeks have clearly been in control.
Earlier in this stock study we looked at the variance of the most bullish and most bearish wall street analysts’ forecasts. That level of variance is 46%. Notice how the magnitude of the rallies stayed in the proximity of those parameters.
What we can also conclude is that IF the next 52 weeks are like the last 52 weeks we should really pay attention whenever the $QCOM declines 11% or more from a recent peak. In the past these have been prime purchasing opportunities.
Next, let’s compare Qualcomm ($QCOM) to the broader stock market indexes. This analysis highlights the remarkable performance of $QCOM, showcasing its gains in stark contrast to those of other major market indexes. By juxtaposing Qualcomm’s impressive returns against these benchmarks, we can appreciate the significant outperformance and strength demonstrated by $QCOM within the market landscape.
$QCOM’s performance has been impressive to say the least.
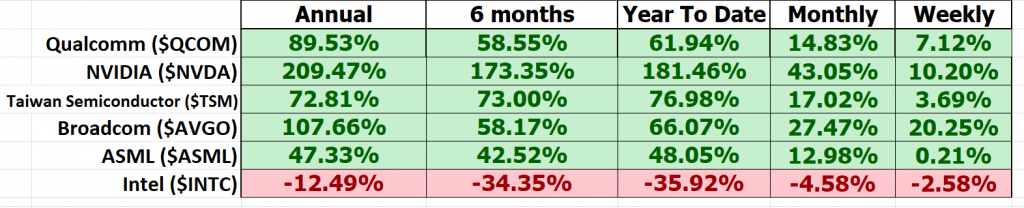
We can dig deeper by comparing $QCOM to its chief semiconductor rivals.
While $NVDA has been the clear winner in the semiconductor battle, $QCOM is clearly competitive with its rivals.
Lastly, we now look at volatility of $QCOM through an indicator called BETA which comparatively measures the VOLATILTY of $QCOM to the broader stock market. The 5-year beta for QUALCOMM ($QCOM) is approximately 1.30. This indicates that Qualcomm’s stock price is about 30% more volatile than the broader market. A beta higher than 1 suggests that Qualcomm’s stock tends to amplify the market’s movements, meaning it will likely rise more in bullish markets and fall more in bearish ones compared to the market average.
So, in $QCOM we have a stock that is 30% more volatile than the broader market but over the last 52 weeks has outperformed the S&P 500 by a factor of 1.9x. This is another reason $QCOM deserves to be on your trading radar.
Vantagepoint A.I. Predictive Blue Line
Let’s break down the core principles shaping the way traders are playing Qualcomm ($QCOM). This is all about understanding the flow—the trajectory of what we at VantagePoint like to call the ‘predictive blue line.’ This isn’t just some fancy chart mark; it’s your map to where the stock might head next, guiding us through the market’s twists and turns.
Let’s lay out the game plan for tackling Qualcomm stock with some cutting-edge tools at our disposal:
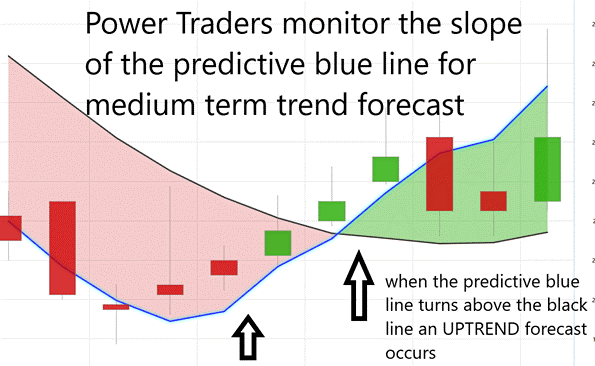
**Trend Analysis**: First up, we’ve got the predictive blue line. This isn’t just any line on a chart—it’s your insight into future market movements. A climbing blue line? That’s signaling a rally, a bullish push that suggests it’s time to consider getting in. On the flip side, if that line starts to dip, brace yourself for potential drops in Qualcomm’s stock price.
**Value Zone Identification**: Now, this is where the rubber meets the road. Around that predictive blue line lies what we call the ‘Value Zone.’ It’s all about timing here—buying right at or below this line when things are looking up, or selling when the stock peaks above it during a downswing. This is how traders aim to maximize gains and minimize risks.
**Market Positioning**: And let’s talk strategy when that blue line heads south. It’s a heads-up from the market, signaling possibly lower prices on the horizon. Savvy traders might take a step back, sitting out the turbulence, or they might hedge their positions to cushion any potential hits, keeping their portfolios safe while they navigate these choppy waters.
Thanks to advancements in artificial intelligence, like those powering the trend-forecasting capabilities we’re talking about, traders can now approach the market with a level of precision that was once unimaginable. This predictive blue line isn’t just a tool; it’s like a lighthouse guiding traders through the fog of daily stock fluctuations, pointing towards potentially profitable moves. Remember, in the high-stakes world of stock trading, being equipped with the right insights can mean the difference between sailing smoothly and getting lost at sea.
But here’s where it gets interesting: When that predictive blue line starts pointing down, it’s like a signal flare telling traders to brace for potentially lower prices. That’s your cue—either you sit this dance out or you hedge your bets.
Thanks to tools like VantagePoint Software, traders have got a secret weapon in their arsenal. This isn’t just another tool; it’s like having a financial GPS. Powered by artificial intelligence, it’s keeping an eye on that blue line for you, helping decipher whether you’re heading into a bull market or if it’s time to buckle up for a bear run.
As you study the chart below, observe how effective the predictive blue line has been in navigating the volatility of the recent uptrend.
Think of the predictive blue line from VantagePoint Software as your market compass; when it climbs, it signals a bullish market, and when it dips, it warns of potential downturns. In today’s fast-paced financial environment, this A.I.-powered tool provides real-time insights, giving traders a significant edge by forecasting market shifts before they become apparent to others.
Neural Network Forecast (Machine Learning)
In the high-octane world of trading, neural networks are like having a superpower. They’re not just good—they’re exceptional at spotting complex patterns and relationships in market data that might slip past human traders or old-school methods. This is crucial because, let’s face it, the financial markets wait for no one. They’re fast, they’re furious, and they’re always changing.
A neural network for trading is constructed using layers of interconnected nodes, or neurons, which process and analyze data. It begins with an input layer that receives market data, followed by one or more hidden layers where computations are performed, and finally, an output layer that provides predictions or signals. These networks are trained using historical market data, learning to identify patterns and relationships through a process called backpropagation, which adjusts the weights of the connections to minimize prediction errors.
The real game-changer here is how neural networks evolve. They learn from new data continuously, getting sharper and more effective. For traders, this means a toolkit supercharged with the ability to predict market trends, stepping up their decision-making game, tightening risk management, and potentially cranking up returns.
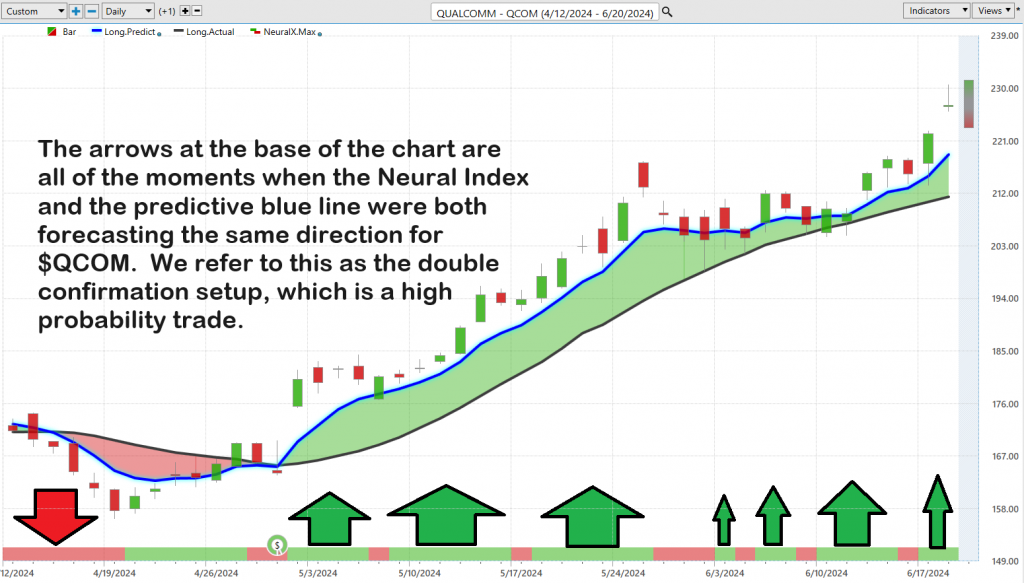
Take, for example, platforms like VantagePoint. Here, neural networks aren’t just another feature—they’re a strategic asset. They light up the charts, green when the market’s ripe for the picking, red when it’s time to back off. And when you pair these networks with traditional tools like the Predictive Blue Line? That’s when the magic happens. You get a ‘double confirmation’ signal—a two-punch combo of insights that not only points traders to goldmine opportunities but also helps slice through market complexity with unmatched precision.
Observe how you study the chart below, how strategic the predictive blue line boundary is in defining value and the general trend.
This isn’t just advancement; it’s a revolution, elevating trading strategies onto a whole new level. For traders aiming to harness the cutting-edge of technology to dominate the markets, neural networks are indispensable. They’re not just changing the game; they’re rewriting the rules.
VantagePoint A.I. Daily Range Forecast
Let’s tackle one of the toughest nuts to crack in trading—knowing when to jump in and when to bail out. Market volatility can be a wild ride, making those decisions even more challenging. For traders eyeing stocks like Qualcomm ($QCOM), nailing the timing means understanding the ebb and flow of daily, weekly, and monthly trading ranges—and then putting that knowledge into action.
This is what the volatility looked like on $QCOM over the past year on a daily, weekly, and monthly basis:
It’s not just about having the data; it’s about turning that data into winning strategies. That’s where the big guns like A.I., machine learning, and neural networks come into play. These technologies aren’t just fancy buzzwords—they’re your roadmap through the stormy seas of the financial markets. They give you clear, actionable insights into market trends and pinpoint trading ranges with remarkable accuracy, slashing the guesswork from your trading decisions.
Now, let’s dive into what the VantagePoint A.I. Daily Range Forecast looked like for QCOM over the past three months. This is the kind of intel that can give you the edge in your trading game.
In the current climate of market volatility, the VantagePoint A.I. Daily Range Forecast stands out as an essential tool for traders. With its unparalleled accuracy and comprehensive analysis, this technology provides short-term swing traders with a notable edge, enabling them to navigate the market with confidence. The tool offers detailed insights into expected daily market movements, clearly outlining market trends and anticipated trading ranges.
Such granularity allows traders to carefully plan their entry and exit strategies, significantly boosting their confidence. By harnessing advanced analytics, traders can convert complex market data into actionable strategies, paving the way for substantial growth even in unpredictable financial environments. The precision provided by predictive analytics is crucial for traders aiming to capitalize on market dynamics, highlighting the critical role of advanced technological tools in modern trading.
Remember, the money in trading is made by being confident in your entry and exit points. Short-term traders need tools to assist with better defining their ability to find the value zone and create better timing. With the right technology at your disposal, you can turn the market’s volatility into your biggest ally.
Intermarket Analysis
Intermarket analysis is like looking at different parts of a puzzle to understand the whole picture. Imagine you’re trying to predict if it’s going to rain. You don’t just look at the sky; you also check the weather forecast, the wind direction, and even the temperature. In the same way, intermarket analysis looks at different markets—like stocks, bonds, commodities, and currencies—to understand how they affect each other. By seeing how these markets move together, traders can make better decisions about where to invest their money.
Intermarket analysis is primarily used by traders who want to understand the bigger picture of how different financial markets interact with each other. This approach is popular among technical analysts and macro traders, who look at broad economic trends and their impact on markets. Hedge funds and investment banks also use intermarket analysis to develop comprehensive trading strategies.
One of the pioneers of intermarket analysis is John Murphy, a renowned technical analyst. His books, such as “Intermarket Technical Analysis” and “The Visual Investor,” laid the groundwork for understanding the relationships between different markets. Another significant contributor is Martin Pring, who has written extensively on the subject and developed various tools to aid in intermarket analysis. The founder of VantagePoint Software, Lou Mendelsohn pioneered the development of software tools to implement intermarket analysis effectively.
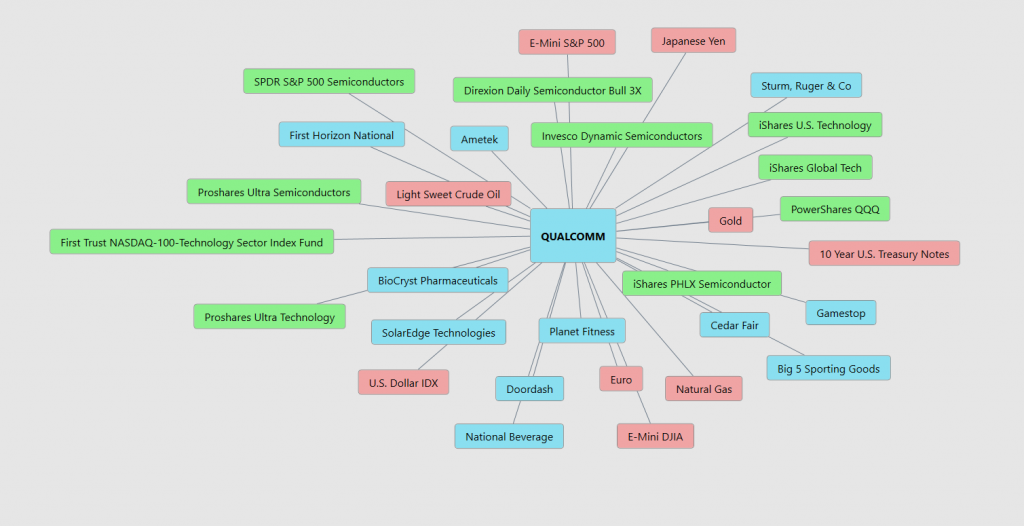
By integrating intermarket analysis into their strategies, traders can gain a competitive edge and improve their chances of success in the complex world of financial markets. The graphic above shows you the 31 key drivers of $QCOM price. Study it carefully and you will find some hidden gems.
Our Suggestion
Over the past month, Qualcomm ($QCOM) has made significant strides, particularly highlighted by their keynote at Computex 2024, where they unveiled new Snapdragon X Series and Copilot+ PCs, showcasing innovative advancements in A.I.-driven computing. Additionally, their Q2 2024 earnings surpassed expectations, with revenues and earnings both exceeding analyst projections. This positive momentum has kept $QCOM trading near the higher end of its 52-week range.
Given the robust performance and strong market sentiment, we recommend a bullish approach to trading $QCOM at this time. The stock’s recent developments and continued innovation position it well for potential gains. Utilizing tools like VantagePoint’s A.I. Predictive Blue Line and the Daily Range Forecast will further refine entry and exit points, enhancing precision and maximizing returns in the current favorable market conditions.
Qualcomm’s next earnings call is scheduled for Wednesday, July 31, 2024, after the market closes. Earnings will continue to be the key driver for all semiconductor stocks moving forward. As this analysis is published the price to earnings ratio is 30.5 which is at the top end of the scale over the last decade. This high ratio tells us that volatility is baked in. Should earnings increase it will provide fuel for further upside gains. However, if earnings fall, we would expect the stock to stumble.
Qualcomm ($QCOM) stock continues to surge after news that Samsung will exclusively use Qualcomm’s next-generation chipset in their upcoming Galaxy S25 phone. This is a major win for Qualcomm, boosting demand for their chips and potentially leading to higher prices.
Analysts also see growth potential from Qualcomm’s plans to double shipments of their chips for Windows laptops. This news creates a bullish picture for QCOM in the near future. The Samsung deal and potential price hikes suggest strong demand and potentially higher revenue.
Practice good money management on all your trades and follow the artificial intelligence guidance in your trading.
Let’s Be Careful Out There!
It’s Not Magic.
It’s Machine Learning.
Disclaimer: THERE IS A HIGH DEGREE OF RISK INVOLVED IN TRADING. IT IS NOT PRUDENT OR ADVISABLE TO MAKE TRADING DECISIONS THAT ARE BEYOND YOUR FINANCIAL MEANS OR INVOLVE TRADING CAPITAL THAT YOU ARE NOT WILLING AND CAPABLE OF LOSING.
VANTAGEPOINT’S MARKETING CAMPAIGNS, OF ANY KIND, DO NOT CONSTITUTE TRADING ADVICE OR AN ENDORSEMENT OR RECOMMENDATION BY VANTAGEPOINT AI OR ANY ASSOCIATED AFFILIATES OF ANY TRADING METHODS, PROGRAMS, SYSTEMS OR ROUTINES. VANTAGEPOINT’S PERSONNEL ARE NOT LICENSED BROKERS OR ADVISORS AND DO NOT OFFER TRADING ADVICE.