-
View Larger Image
| This Week’s a.i. Stock Spotlight is RTX ($RTX) |

Raytheon Technologies, formed from the merger of Raytheon Company and United Technologies Corporation in 2020, stands as one of the largest aerospace and defense companies in the world. Headquartered in Waltham, Massachusetts, the company employs over 180,000 people globally. Renowned for its advanced radar systems, Raytheon Technologies is also a leading developer of hypersonic weapons and has a significant presence in the space exploration sector. The company’s Pratt & Whitney division plays a major role in the commercial aerospace engine market, while the Collins Aerospace segment focuses on avionics and mission systems.
With a robust research and development budget often exceeding $5 billion annually, Raytheon Technologies continues to push the boundaries of innovation in its field. The merger has consolidated its position as a powerhouse in the industry, leveraging the strengths and expertise of both legacy companies to enhance its technological capabilities and market reach. This strategic move has enabled Raytheon Technologies to maintain its competitive edge and drive forward advancements in aerospace and defense technologies.
Raytheon Technologies ($RTX) has demonstrated remarkable resilience and strategic acumen amid a complex and fluctuating market landscape. As a formidable player in the aerospace and defense industry, Raytheon Technologies’ recent earnings calls provide insightful glimpses into the company’s current performance and future trajectory.
Raytheon Technologies faces several challenges, primarily centered around supply chain disruptions and inflationary pressures. These issues have affected production timelines and increased costs, posing a risk to the company’s operational efficiency. Additionally, the slower recovery of the commercial aerospace division remains a concern, as it continues to lag pre-pandemic performance levels.
Despite these challenges, Raytheon Technologies is well-positioned to capitalize on several significant opportunities. The defense segment is a robust performer, supported by substantial government contracts and increasing global defense spending. The company’s focus on innovation, particularly in hypersonic weapons and radar technologies, underscores its commitment to maintaining a competitive edge in the defense sector.
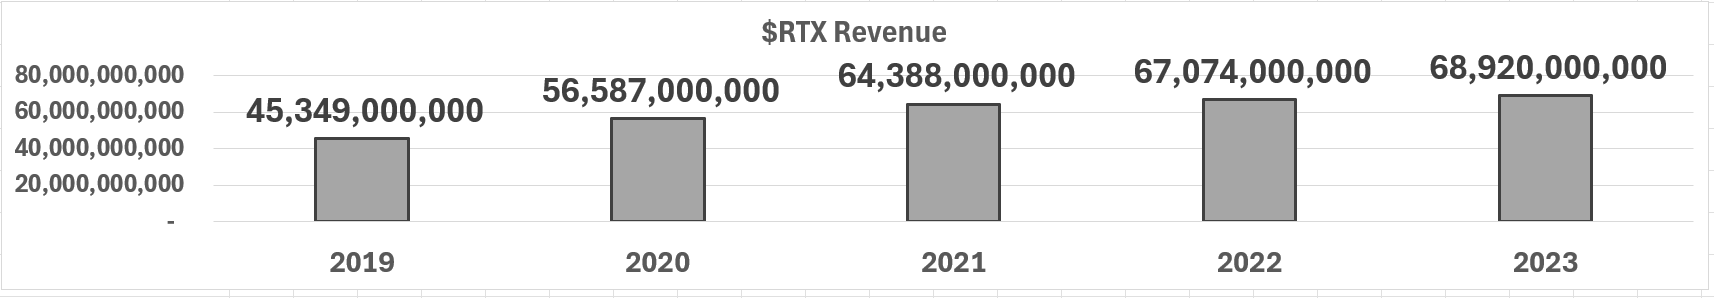
First off let’s look at $RTX revenue over the last 5 years. Revenue has consistently grown year over year and in the last 5 years revenue has grown 51%.
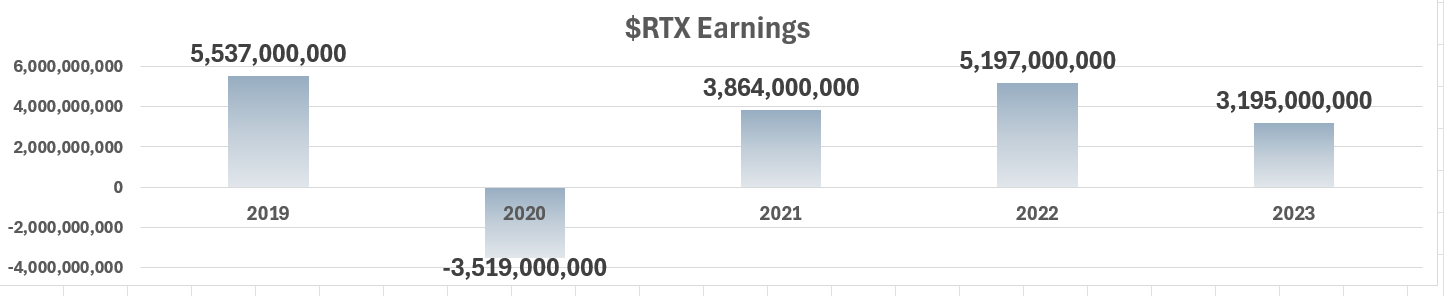
The earnings side has been much more volatile and are still down 43% from the highs of 2019.
Most recently, in the second quarter, RTX blew past Wall Street’s expectations, earning $1.41 per share on a hefty $19.7 billion in revenue. Compare that to the consensus estimate of $1.19 per share on $17.8 billion in sales, and you see the kind of performance that makes investors sit up and take notice.
$RTX Sales soared 10% year over year, and RTX generated a solid $2.2 billion in free cash flow.
Riding high on these results, the company has raised its full-year earnings guidance to a range of $5.35 to $5.45 per share, up from $5.25 to $5.40 per share. That’s significantly above the $4.95 consensus we had heading into earnings season. Revenue guidance also saw an uptick, now expected to hit $79.1 billion at the midpoint, up from $78.5 billion. CEO Chris Calio was bullish, stating, “The strength in our end markets and first half performance give us the confidence to increase our outlook for adjusted sales and adjusted EPS for the full year.”
Pratt & Whitney, RTX’s jet engine unit, spearheaded this success with strong aftermarket demand. This performance is a stark contrast to a year ago when RTX was grappling with a massive recall of its PW1100G-JM engine, a debacle that cost them over $5 billion. The stock took a 30% nosedive post-disclosure but has clawed back those losses, surging 16% higher as we head into this earnings season.
Military contractors typically benefit during election years due to increased government spending on defense and security initiatives. Candidates often prioritize national security, leading to heightened budgets for military projects and contracts. This surge in spending aims to address immediate defense needs and support economic growth through job creation in the defense sector. Consequently, companies in this industry, such as RTX, often see a boost in revenue and new contracts, as government officials seek to showcase their commitment to national security and economic stability.
Over the past year, Raytheon Technologies ($RTX) has been involved in several significant developments:
1. **Corporate Realignment and Financial Strategy**: In June 2023, Raytheon Technologies announced a strategic realignment into three main business segments: Collins Aerospace, Pratt & Whitney, and Raytheon. This move aims to streamline operations and enhance focus on their core areas. The company also reaffirmed its financial outlook for 2025 and committed to increasing capital returns to shareholders, emphasizing its strong backlog of defense and aerospace technologies valued at $180 billion.
2. **Landsat Next Contract**: In June 2024, Raytheon secured a $506 million contract from NASA to design and build the Landsat Next Instrument Suite. This suite includes next-generation space instruments intended for Earth observation, with enhanced capabilities to monitor environmental changes, water quality, crop production, and more. The new instruments will offer up to three times the spatial, temporal, and spectral resolution of their predecessors, supporting critical environmental and resource management.
3. **Patriot Missile Defense System Contract**: In March 2024, Raytheon was awarded a $1.2 billion contract to supply Germany with Patriot air and missile defense systems. This contract will enhance Germany’s air defense infrastructure and interoperability with NATO allies. The Patriot system is renowned for its combat-proven effectiveness against a range of advanced threats, including long-range cruise missiles and tactical ballistic missiles.
Over the past month the company has had a very impressive rally, as have many stocks in the DEFENSE AEROSPACE SECTOR. Analysts are concerned about the $44.25 billion in debt that $RTX is carrying and the reality that interest payments are not well covered by earnings. Despite that earnings are forecast to grow by 24% per year moving forward.
These developments highlight Raytheon’s ongoing advancements in defense technologies and strategic efforts to bolster its financial and operational capabilities.
Moreover, the gradual recovery of the commercial aerospace market presents a significant growth opportunity. As air travel demand rebounds, Raytheon Technologies is poised to benefit from increased aircraft deliveries and related services. The strategic acquisition of Blue Canyon Technologies also enhances the company’s capabilities in the burgeoning space sector, positioning it for future growth.
In this weekly stock study, we will look at an analysis of the following indicators and metrics which are our guidelines which dictate our behavior in deciding whether to buy, sell or stand aside on a particular stock.
- Wall Street Analysts Ratings and Forecasts
- 52 week high and low boundaries
- Vantagepoint A.I. Forecast (Predictive Blue Line)
- Neural Network Forecast (Machine Learning)
- VantagePoint A.I. Daily Range Forecast
- Intermarket Analysis
- Our Suggestion
While we make all our decisions based upon the artificial intelligence forecasts, we do look at the fundamentals briefly, just to understand the financial landscape that $RTX is operating in.
Wall Street Analysts Ratings and Forecasts
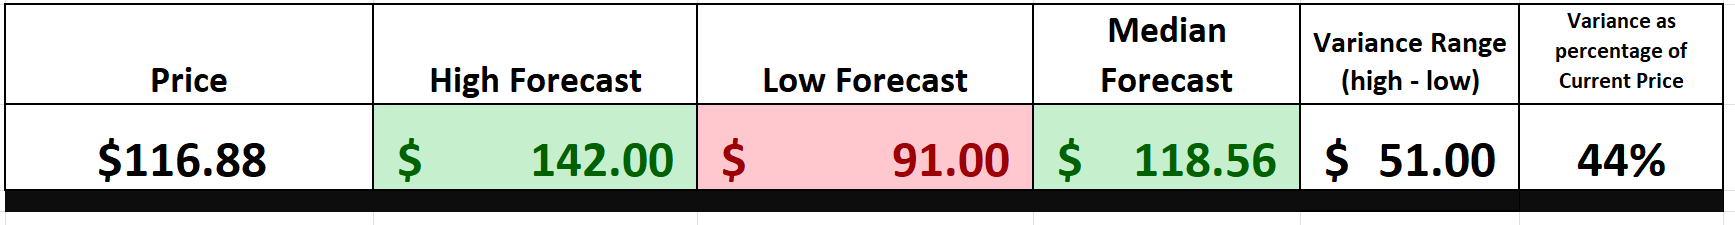
In the past three months, nine Wall Street analysts have provided 12-month price targets for Raytheon Technologies ($RTX). The average price target stands at $118.56, with projections ranging from a high of $142.00 to a low of $91.00. This spread highlights varying perspectives on RTX’s potential performance, reflecting both optimism about its growth prospects and caution about possible risks.
We always advise that traders pay very close attention to the variance between the most bullish and most bearish forecasts as this is the recipe for volatility. Right now, the variance is $51 or 44% of the current price.
52 Week High and Low Boundaries
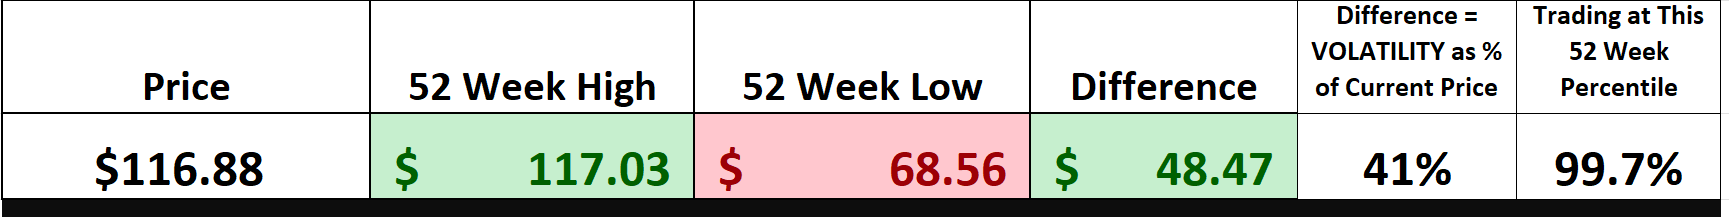
Over the last 52 weeks $RTX has traded as high as $117.03 and as low as $68.56. The difference between the high and the low price for the past year provides us with a level of statistical volatility that we always compare to the Wall Street analysts’ forecasts. Currently this value is $48.47 or 41% of the current $RTX price. This value tells us very clearly that if the current year is like the past year, it would be totally normal to see $RTX trade up to 41% higher and or lower than its current price.
Traders and investors closely monitor the 52-week high and low levels as key indicators of a stock’s performance over the past year. These boundaries serve as crucial metrics, reflecting the stock’s volatility and potential momentum. It’s advisable for traders to pay particular attention to stock behavior when it approaches or breaches these 52-week boundaries, as such movements can signal significant market sentiment and potential trading opportunities.
Why should you care about a stock’s 52-week highs and lows? These numbers aren’t just figures—they’re like grades on the stock’s report card for the year. They give a clear snapshot of the stock’s trajectory and are crucial for identifying trends. Additionally, they offer a quick comparison of the stock’s performance relative to the broader market. Paying attention to these boundaries helps investors and traders spot potential opportunities and risks.
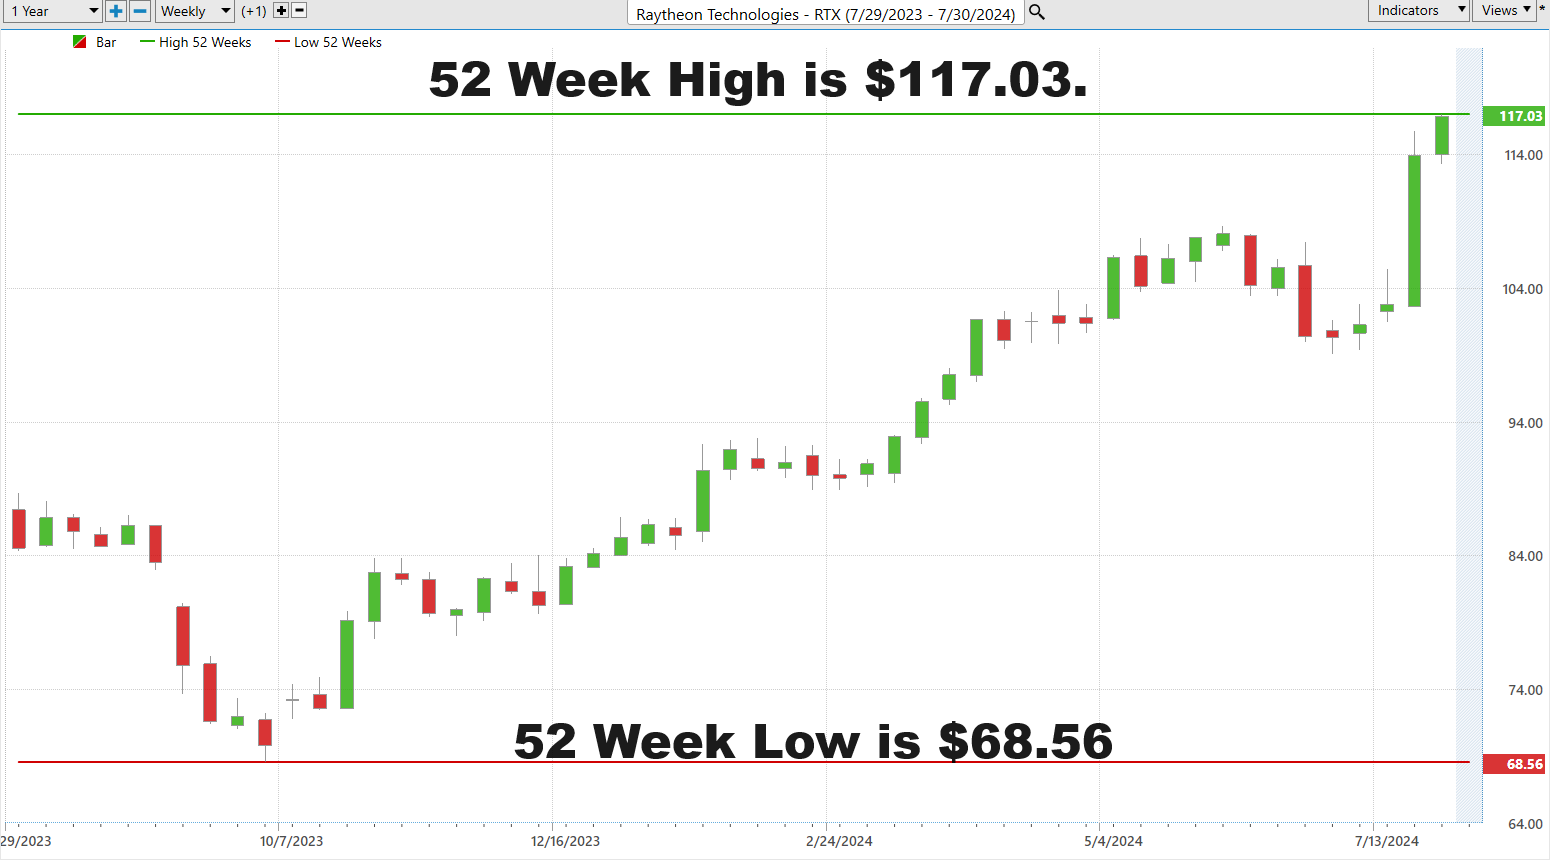
Here is the $52 week chart of $RTX where you can clearly see the value and significance of the 52-week boundaries in action.
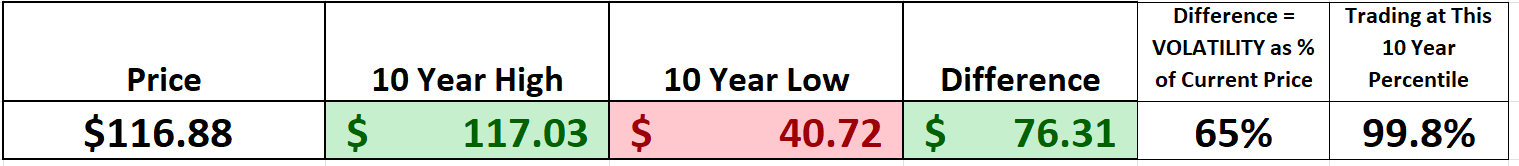
When we zoom out we see can see the longer term path and trajectory that $RTX has been on by simply studying the 10 year chart.
Best-Case/Worst-Case Analysis
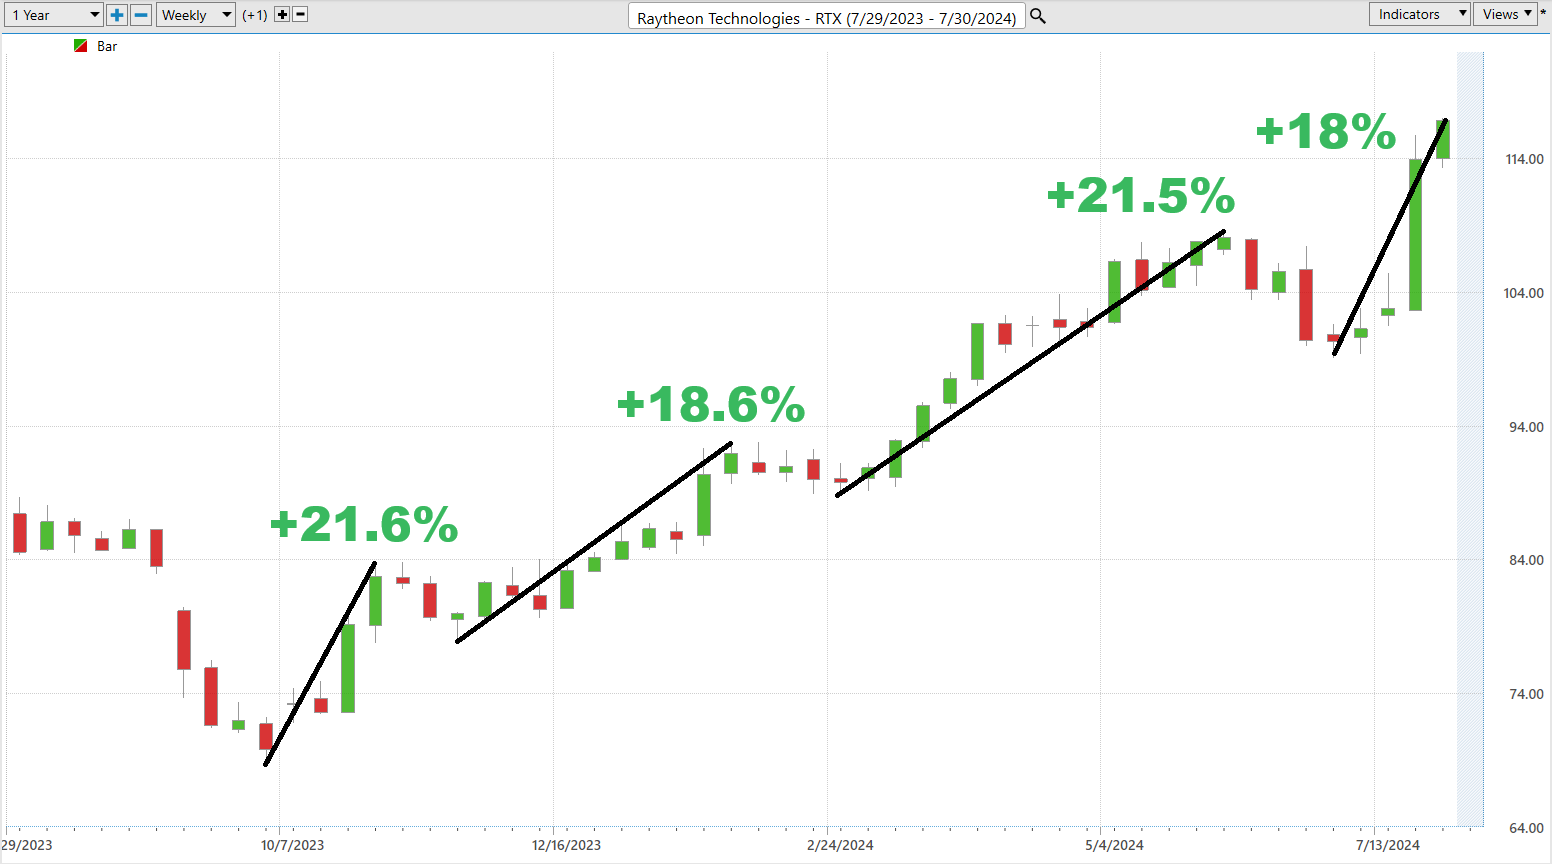
Folks let’s dive into the essence of trading—risk and reward. This isn’t about those flashy algorithms; it’s about mastering the landscape of the market. We’re talking about dissecting the potential upsides and downsides of trading opportunities with crystal-clear precision. Think of it like navigating the open seas—you’ve got to understand the historical currents to chart a successful course.
Trading is learning how to make the best decisions possible based upon the imperfect information that is available. Understanding the volatility of the last year is a great guide stone in identifying this reality.
Let’s pull up that chart—think of it as a navigational map showing the market’s rallies and dips over the past year. This isn’t about jargon; it’s about grasping the real essence of $RTX’s risk and reward profile. It’s a hands-on analysis that reveals potential gains and losses, offering a roadmap through the market’s volatility over the last 52 weeks.
Here’s the crucial part: balancing those bullish surges with the inevitable downturns. It’s about recognizing volatility and preparing for the rough waters ahead. This isn’t about making flashy moves; it’s about strategic, informed decision-making. By analyzing the strength of the rallies and the declines, we get a vivid picture of the stock’s potential and the inherent risks.
Don’t just skim those charts—dive deep. This is more than tactics; it’s about crafting an understanding that empowers you. We’re talking about making informed decisions, smart moves that manage your exposure and build a resilient trading plan.
Why is this so crucial? Because it’s practical. History has a way of repeating itself, and we might see similar volatility in the future. Instead of guessing, we gain a real-world perspective on risk and reward.
Now, let’s get specific. Based on this historical analysis, we can gauge the potential strength of the rallies and measure them against the weaknesses in the declines for $RTX over the past year.
First, let’s consider the best-case scenario:
Next, we evaluate the worst-case scenario:
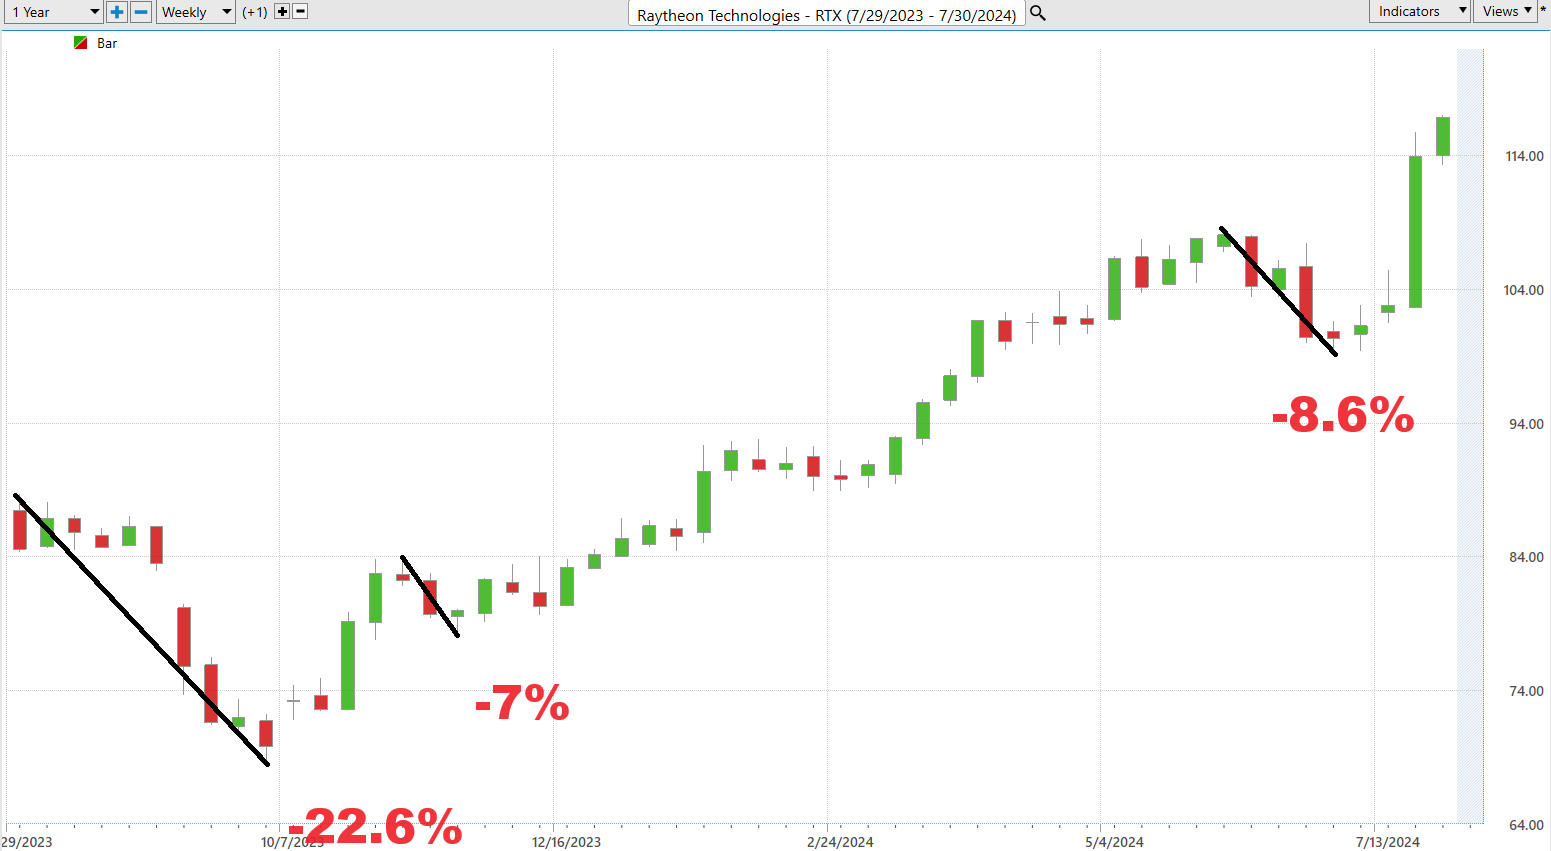
This simple exercise allows you to quickly see what has been considered normal over the past year. We also can get a very effective understanding of volatility over the past year.
What insights can we derive from this straightforward analysis? By comparing the magnitude of the rallies to that of the declines, it becomes evident that the bulls have maintained a strong grip over the past 52 weeks.
Furthermore, if the upcoming 52 weeks mirror the previous ones, it’s crucial to take note whenever $RTX experiences a decline of 7% or more from a recent peak. Historically, such dips have presented prime buying opportunities, especially when guided by artificial intelligence.
Lastly, let’s turn our attention to RTX ($RTX) and see how it stacks up against the broader stock market indexes. This analysis is going to highlight the remarkable performance of $RTX, putting its gains in clear contrast to those of other major market indexes. By setting RTX’s impressive returns side-by-side with these benchmarks, we can truly appreciate the significant outperformance and strength $RTX has demonstrated in the market landscape.
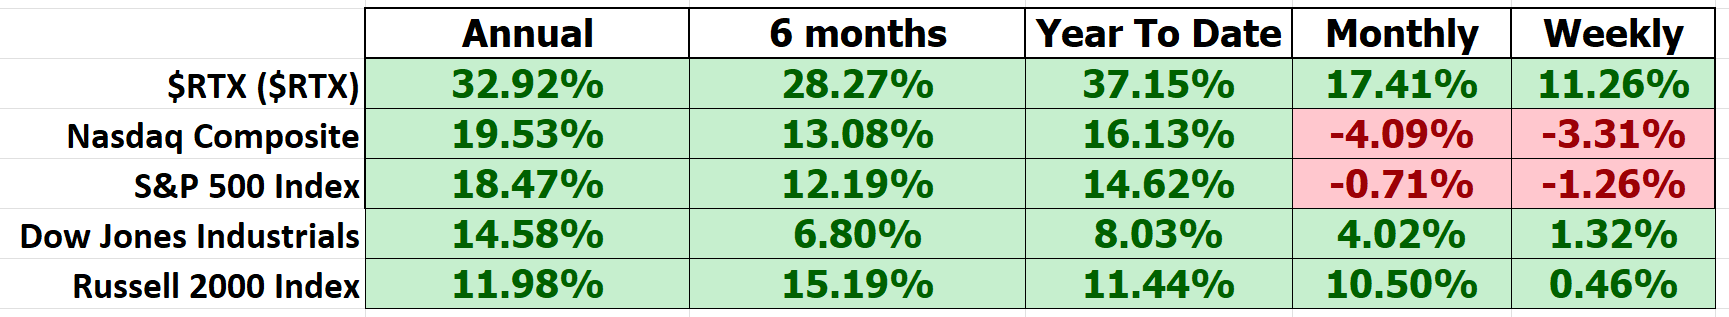
$RTX has outperformed the broader market across all time frames.
The beta of RTX Corp ($RTX) over the last five years is 0.55. This indicates that RTX has had lower volatility compared to the overall market, as a beta of 1.0 represents market-level volatility. With a beta of 0.55, RTX’s stock price has been less volatile, showing that it tends to move less dramatically in response to market changes. This lower beta can be appealing for investors seeking a more stable investment, especially in the aerospace and defense sector.
Finally, we often like to get more granular by looking at $RTX competitors and see how they have performed comparatively:
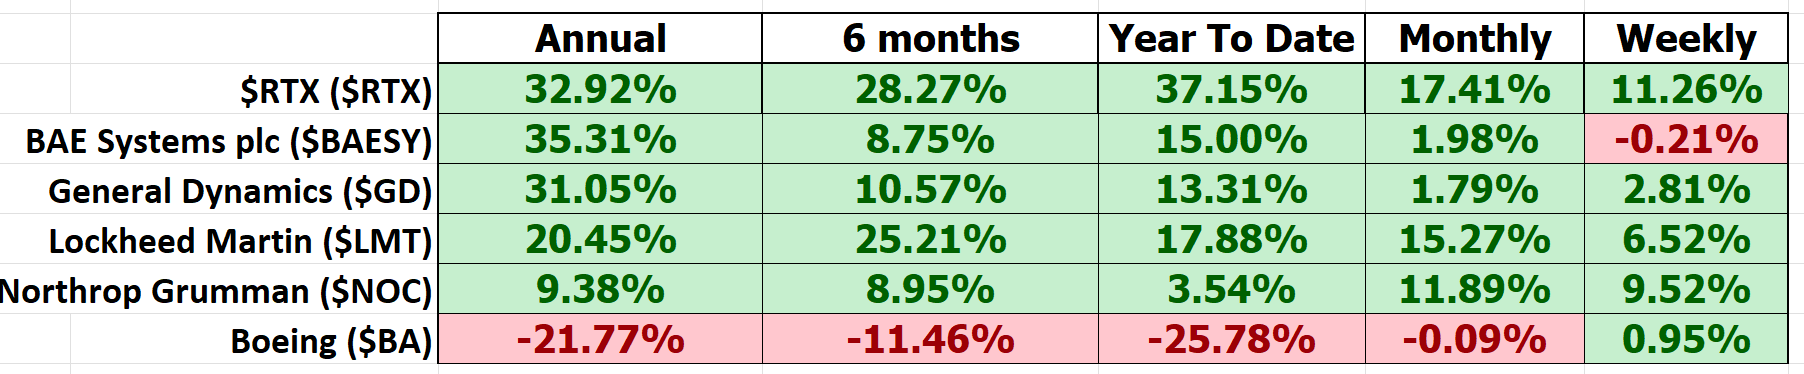
We highly recommend that you place the winners on your radar after performing this analysis as they will continue to present incredible trading opportunities over the next year.
In conclusion, in $RTX we have a stock that is 45% less volatile than the broader market and has massively outperformed. That is the reason why it has done so well recently.
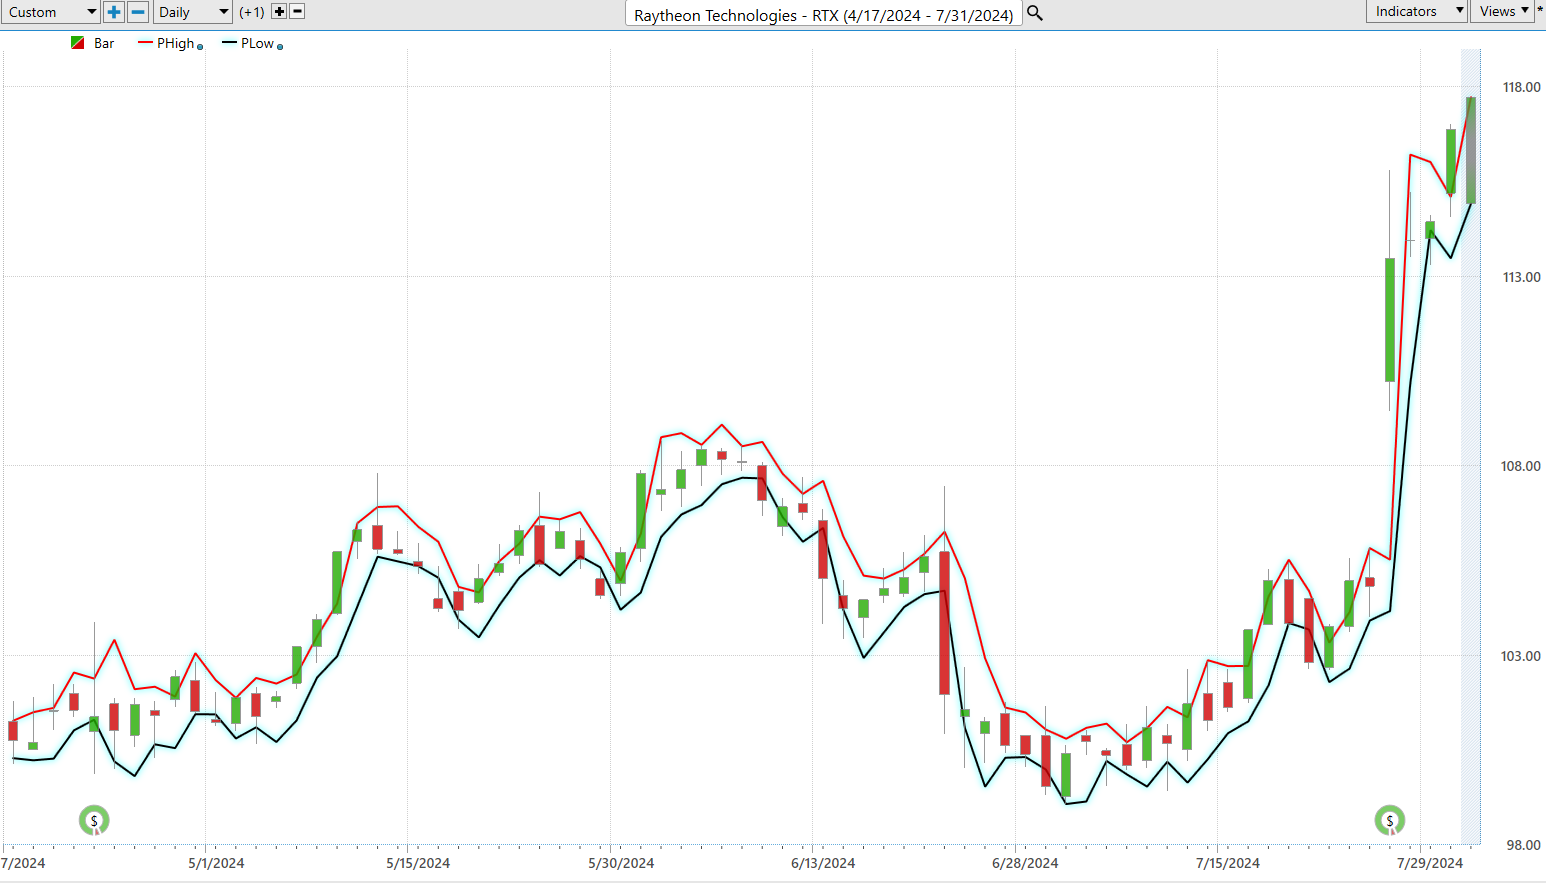
Vantagepoint A.I. Predictive Blue Line
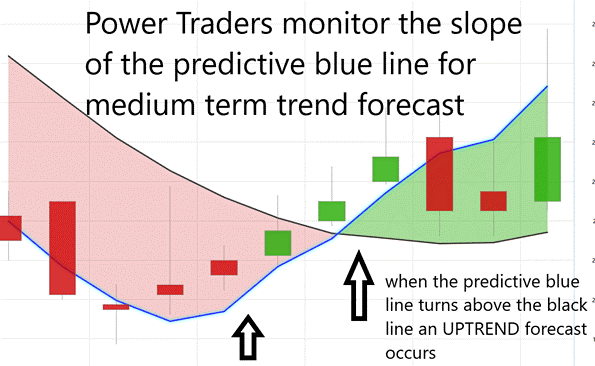
Let’s break down the core principles shaping how traders approach RTX ($RTX). Understanding the flow and trajectory, what we at VantagePoint refer to as the ‘predictive blue line,’ is crucial. This isn’t merely a chart mark; it’s a sophisticated indicator guiding us through the market’s complexities.
Here’s the strategic game plan for tackling RTX with advanced artificial Intelligence tools at our disposal:
The predictive blue line is your window into future market movements. When this line climbs, it signals a rally—a bullish trend suggesting a potential buying opportunity. Conversely, if the line dips, it indicates a potential drop in RTX’s stock price. The slope of the blue line indicates the shorter-term trend.
**Value Zone Identification**: This is where precision comes into play. Surrounding the predictive blue line is what we call the ‘Value Zone.’ The key is timing—buying at or below this line during upward trends or selling above it during downswings. This approach aims to maximize gains while minimizing risks.
**Market Positioning**: When the blue line trends downward, it’s a market warning, signaling possibly lower prices ahead. Savvy traders might take a step back, avoid the turbulence, or hedge their positions to protect their portfolios during these uncertain times.
Study the chart below and the three trend forecasts that have occurred in $RTX over the past 3 months.
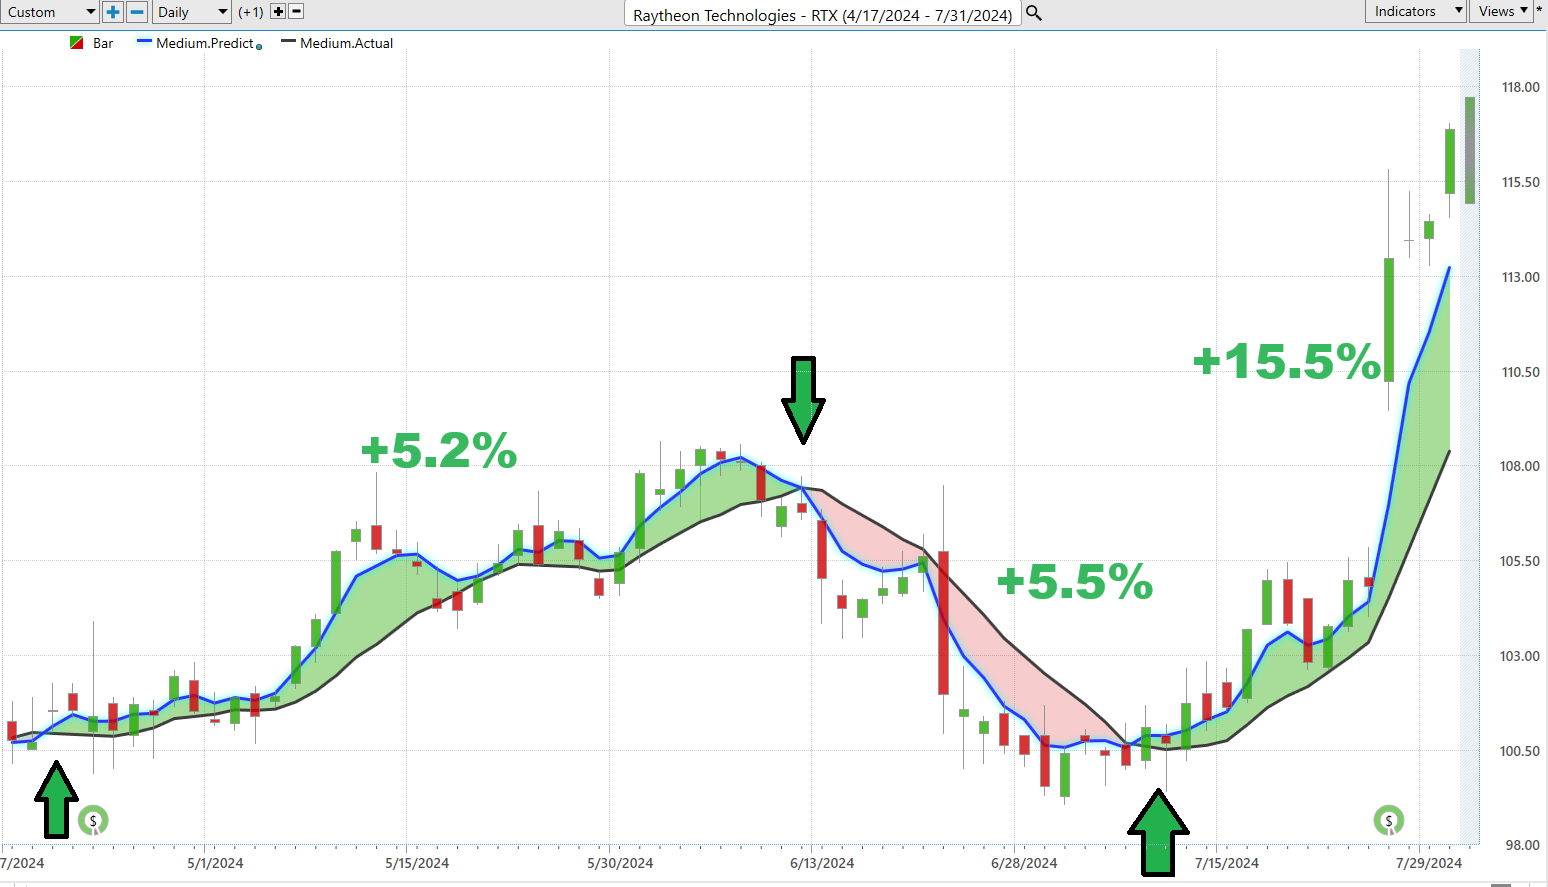
Advancements in artificial intelligence, such as those powering our trend-forecasting tools, allow traders to approach the market with unprecedented precision. The predictive blue line acts like a lighthouse, guiding traders through the fog of daily stock fluctuations and pointing towards potentially profitable moves. In the high-stakes world of stock trading, having the right insights can mean the difference between success and failure.
When the predictive blue line indicates a downturn, it’s a clear signal to brace for potentially lower prices. Traders must decide whether to sit out the volatility or hedge their bets to navigate the market safely.
Thanks to tools like VantagePoint Software, traders have a powerful asset in their arsenal. This isn’t just another tool; it’s akin to having a financial GPS, powered by artificial intelligence, continuously monitoring the blue line, and helping decipher market trends. Whether heading into a bull market or preparing for a bear run, this tool provides the guidance needed to make informed, strategic decisions.
Think of the predictive blue line from VantagePoint Software as your market compass. When it climbs, it’s a clear signal of a bullish market, and when it dips, it warns of potential downturns. In today’s fast-paced financial environment, this A.I.-powered tool delivers real-time insights, giving traders a significant edge by forecasting market shifts before they become apparent to others. This advanced technology helps you stay ahead, making informed decisions with confidence.
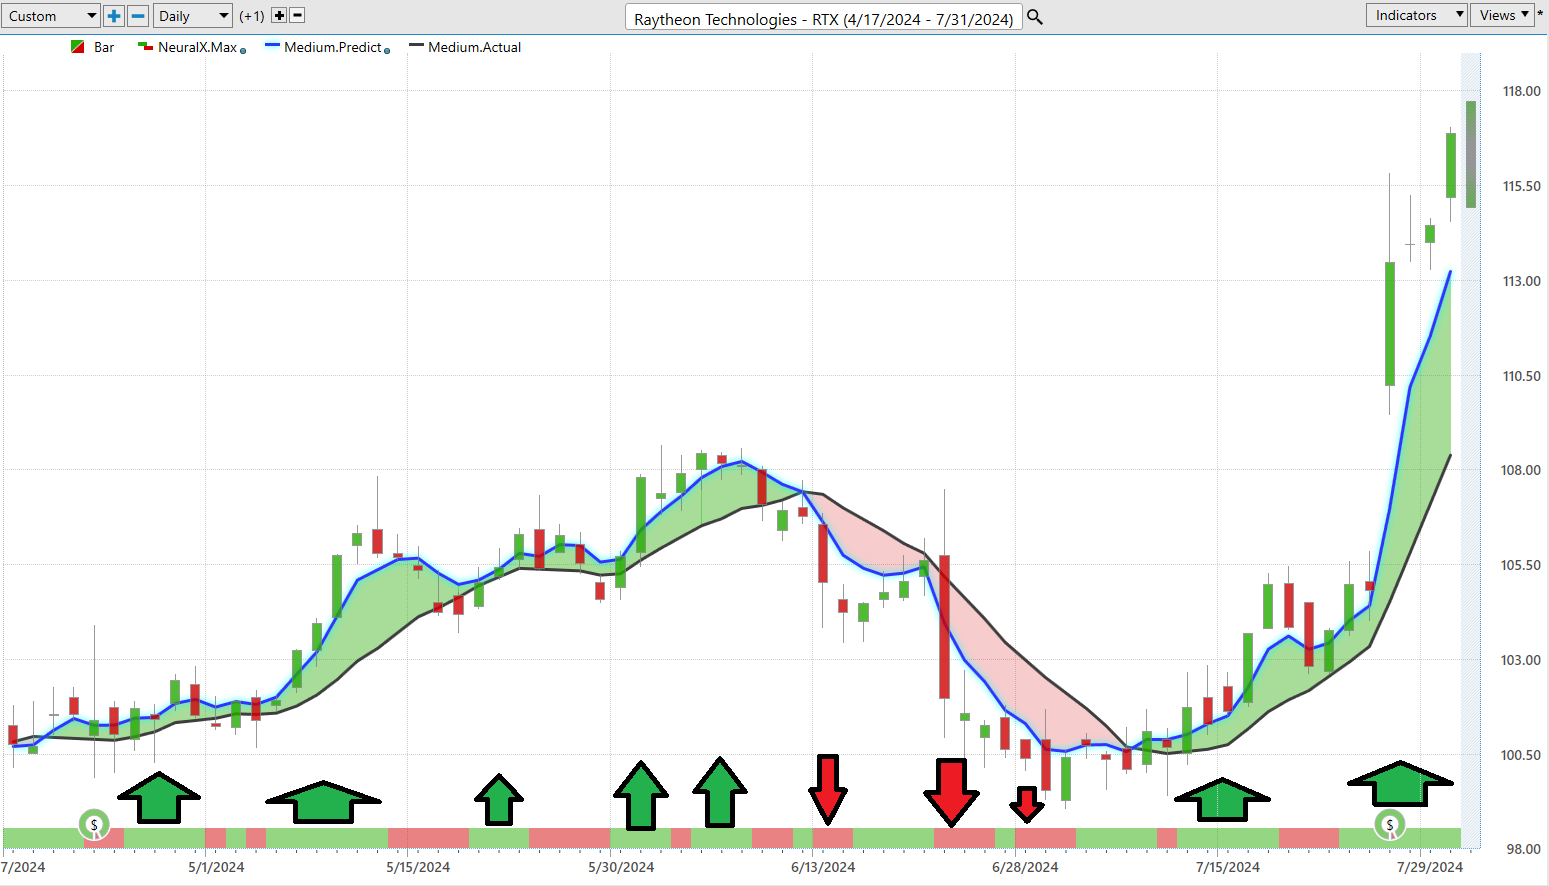
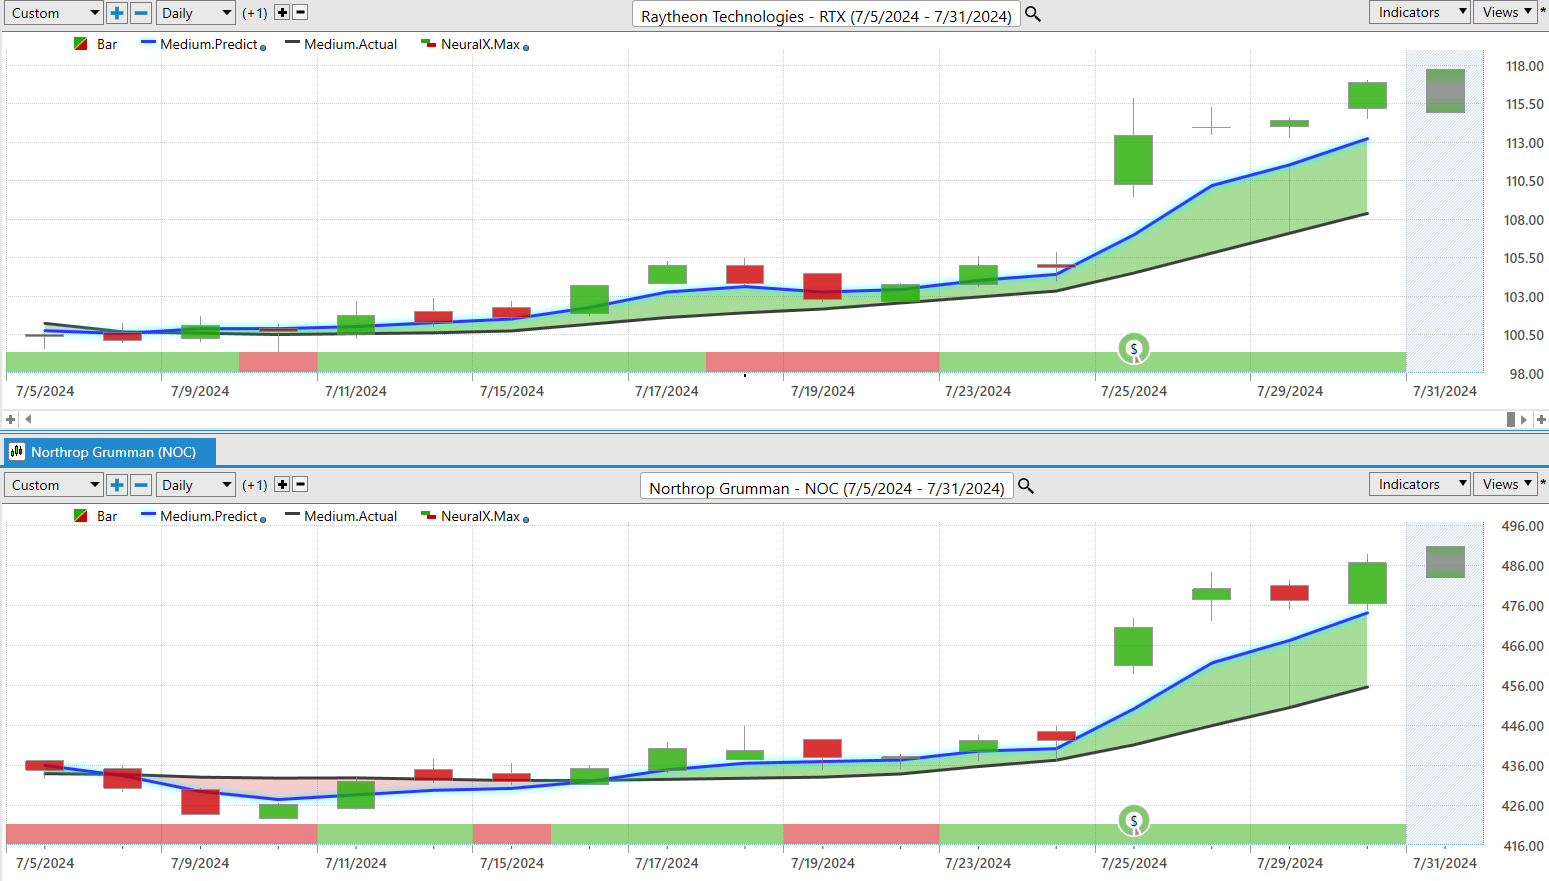
Neural Network Forecast (Machine Learning)
In the high-octane world of trading, neural networks are like having a superpower. These sophisticated tools excel at spotting complex patterns and relationships in market data that might elude human traders or traditional methods. This capability is crucial because the financial markets are relentless—fast, dynamic, and ever-changing.
A neural network for trading is built with layers of interconnected nodes, or neurons, designed to process and analyze data. It starts with an input layer that receives market data, followed by one or more hidden layers where complex computations occur, and concludes with an output layer that provides predictions or signals. These networks are trained using historical market data, learning to identify patterns and relationships through backpropagation, a process that adjusts the weights of connections to minimize prediction errors.
The real game-changer is the adaptive nature of neural networks. They continuously learn from new data, becoming increasingly accurate and effective. For traders, this means leveraging a toolkit capable of predicting market trends, enhancing decision-making, improving risk management, and potentially increasing returns.
Take platforms like VantagePoint, for instance. Here, neural networks aren’t just another feature—they’re a strategic asset. They illuminate the charts, turning green when the market is ripe for opportunities and red when caution is advised. Pair these networks with traditional tools like the Predictive Blue Line, and you have a powerful combination. This ‘double confirmation’ signal provides traders with insights that not only highlight lucrative opportunities but also cut through market complexity with unparalleled precision.
As you study the chart below, notice how strategically the predictive blue line defines value and general bias, and how the neural index at the base of the chart defines the short term 48–72-hour trend. The arrows at the base of the chart are the moments when the neural index and the predictive blue line were both forecasting the same trend direction.
This isn’t merely progress; it’s a paradigm shift, fundamentally transforming trading strategies. For traders intent on leveraging state-of-the-art technology to master the markets, neural networks have become essential. They aren’t just altering the landscape; they’re redefining the very principles of market engagement.
Neural networks bring an unparalleled analytical prowess to trading, identifying intricate patterns and relationships within vast datasets that traditional methods might overlook. Their ability to continuously learn and adapt from new data makes them an ever-evolving asset, sharpening their predictive accuracy over time.
The impact of neural networks on trading is profound. They provide traders with actionable insights, enhancing decision-making processes, optimizing risk management, and potentially boosting returns. For instance, platforms like VantagePoint utilize these advanced networks not just as tools, but as strategic assets. They illuminate market trends with remarkable precision, offering dual-layer confirmation signals that guide traders through complex market environments.
In essence, neural networks are not just revolutionizing trading—they are setting new standards for how markets are analyzed and engaged. This technological leap is indispensable for traders who aspire to stay ahead in a rapidly evolving financial landscape.
VantagePoint A.I. Daily Range Forecast
Every single day traders are confronted with uncertainty. Trading decisions need to be made based upon this reality. Where do you get in? Where do you get out? Do you wait for the market to come to you? Do you chase the market in fear it is going to make a big move? These thoughts can paralyze a trader.
This is why the VantagePoint A.I. Daily Range forecast is an essential tool for traders to equip them with a very unique and effective perspective on price action.
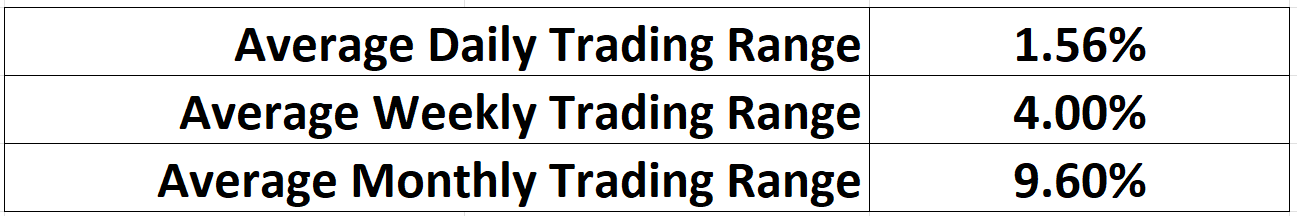
This is what the volatility looked like on $RTX over the past year on a daily, weekly, and monthly basis:
In today’s data-driven financial markets, the challenge isn’t just in acquiring data—it’s in transforming that data into effective trading strategies. Enter the cutting-edge technologies of artificial intelligence, machine learning, and neural networks. These aren’t mere buzzwords; they are the sophisticated tools that navigate traders through the tumultuous seas of the financial world.
Artificial intelligence and its subsets, machine learning and neural networks, provide a strategic advantage by offering clear, actionable insights into market trends. They excel at identifying complex patterns within massive datasets, which traditional methods might miss. This capability allows traders to pinpoint trading ranges with remarkable accuracy, significantly reducing the guesswork in their decisions.
Neural networks, for instance, are designed to continuously learn and adapt from new data, enhancing their predictive precision over time. This ongoing improvement ensures that traders are always equipped with the most current and relevant market insights. Platforms like VantagePoint leverage these technologies to deliver a dual-layer confirmation signal, combining the strengths of both traditional and advanced analytical methods. This approach not only illuminates market trends but also provides a robust framework for strategic decision-making.
By integrating these advanced technologies, traders can stay ahead of market shifts, optimize their strategies, and potentially increase their returns. This isn’t just about keeping up with the pace of modern trading—it’s about setting a new standard for market analysis and engagement.
Look at how effective VantagePoint’s A.I. Daily Range Forecast has been over the past several months in not only providing very accurate trading ranges but in also clearly delineating the trend.
The granularity we’re talking about allows traders to meticulously plan their entry and exit strategies, boosting their confidence in a big way. By leveraging advanced analytics, traders can turn complex market data into actionable strategies, paving the way for substantial growth even in unpredictable financial environments. This kind of precision is essential for those aiming to capitalize on market dynamics, underscoring the importance of advanced tech tools in today’s trading.
Remember, the real money in trading is made by being sure of your entry and exit points. Short-term traders need tools that help them pinpoint the value zone and time their moves perfectly. With the right technology at your fingertips, you can transform the market’s volatility into your greatest asset. So, get equipped, stay informed, and turn those market twists and turns into profitable opportunities!
Intermarket Analysis
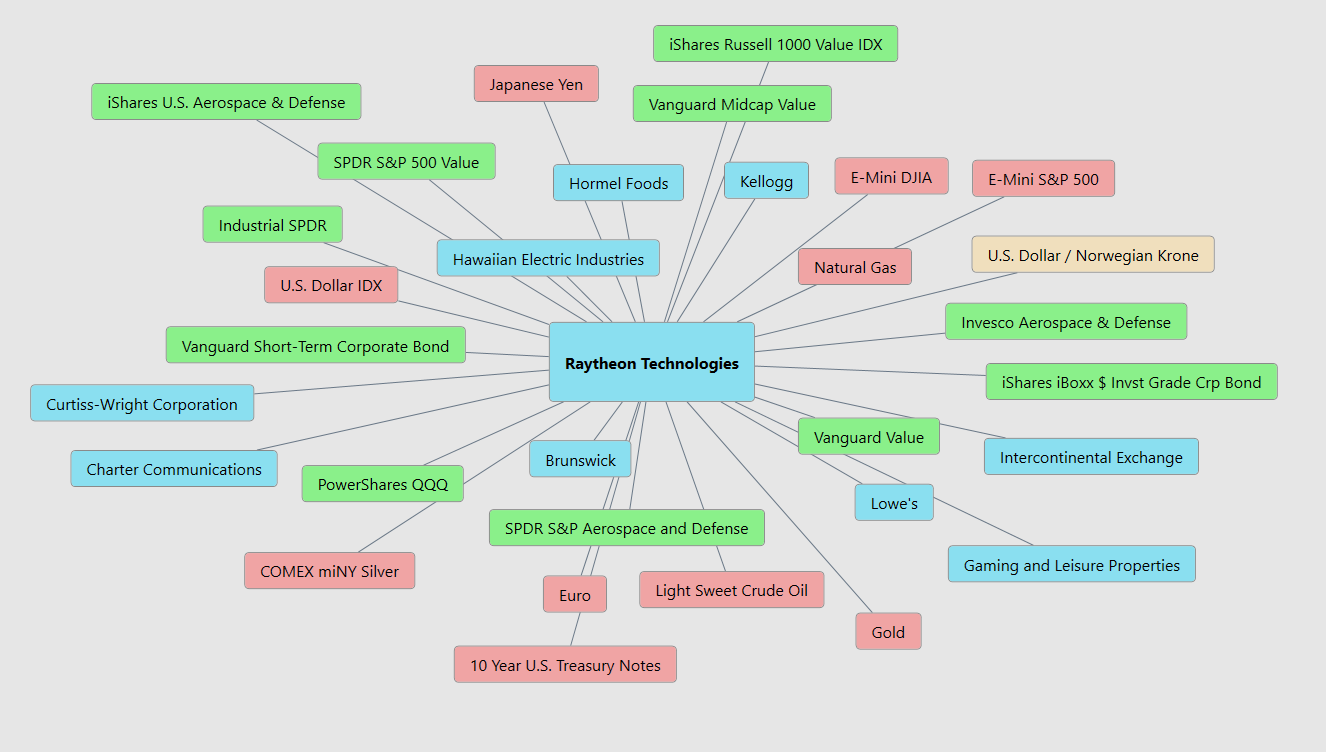
Intermarket analysis is akin to piecing together a multifaceted puzzle to see the broader economic picture. Think of it like predicting the weather—not by just glancing at the sky but by examining the forecast, wind direction, and temperature. Similarly, intermarket analysis examines various financial markets—stocks, bonds, commodities, and currencies—to understand their interrelations and collective impact.
At its core, intermarket analysis helps traders discern how different markets influence one another. For example, a rise in bond yields might signal a potential decline in stock prices, while a surge in commodity prices could suggest upcoming inflationary pressures. By observing these interconnections, traders can make more informed investment decisions.
Intermarket analysis is particularly valuable for traders who aim to grasp the larger economic landscape. Technical analysts and macro traders frequently employ this method to analyze broad economic trends and their effects on the markets. Hedge funds and investment banks also utilize intermarket analysis to formulate comprehensive trading strategies.
John Murphy, a leading figure in this field, has significantly contributed to the understanding of these market relationships through his seminal works like “Intermarket Technical Analysis” and “The Visual Investor.” Another notable expert, Martin Pring, has extensively written about intermarket dynamics and developed various analytical tools. Additionally, Lou Mendelsohn, the founder of VantagePoint Software, pioneered the development of software tools specifically designed to implement intermarket analysis effectively.
By incorporating intermarket analysis into their trading strategies, traders can gain a competitive edge and enhance their success rates in the financial markets. The graphic above illustrates the 31 key drivers of RTX’s price. Study it closely, and you might uncover some invaluable insights.
Our Suggestion
Over the last year, RTX has shown impressive growth alongside significant challenges. Sales increased notably across various segments, with Collins Aerospace and Pratt & Whitney reporting substantial year-over-year gains. The company’s robust commercial and defense demand pushed its backlog to a record $202 billion, and revenue growth in the second quarter of 2024 exceeded expectations, reflecting RTX’s resilience and strategic positioning. However, higher production costs and unfavorable contract adjustments, particularly within Pratt & Whitney, have impacted on operating profits. Additionally, the company faces risks related to insufficient interest coverage by earnings, declining profit margins, and the pressure of large one-off items impacting financial results. The dividend yield of 2.16% is currently not well covered by earnings, highlighting the financial strain. Despite these issues, earnings are forecast to grow by 24.07% annually, offering a more positive outlook.
As traders our only loyalty is to the trend. We advise that you pay close attention to VantagePoint’s A.I. Daily Range forecast for short-term guidance. The stock is fairly valued at present. We think short term corrections will present themselves as buying opportunities.
Remember we are in an election year and defense contractors are primary beneficiaries of government spending. $RTX and $NOC have trends that appear almost identical as we go into the fall elections.
Practice good money management on all your trades.
Remember, it’s not magic.
It’s machine learning.
Make it count.
Disclaimer: THERE IS A HIGH DEGREE OF RISK INVOLVED IN TRADING. IT IS NOT PRUDENT OR ADVISABLE TO MAKE TRADING DECISIONS THAT ARE BEYOND YOUR FINANCIAL MEANS OR INVOLVE TRADING CAPITAL THAT YOU ARE NOT WILLING AND CAPABLE OF LOSING.
VANTAGEPOINT’S MARKETING CAMPAIGNS, OF ANY KIND, DO NOT CONSTITUTE TRADING ADVICE OR AN ENDORSEMENT OR RECOMMENDATION BY VANTAGEPOINT AI OR ANY ASSOCIATED AFFILIATES OF ANY TRADING METHODS, PROGRAMS, SYSTEMS OR ROUTINES. VANTAGEPOINT’S PERSONNEL ARE NOT LICENSED BROKERS OR ADVISORS AND DO NOT OFFER TRADING ADVICE.