-
View Larger Image
| This Week’s a.i. Stock Spotlight is Northrop Grumman ($NOC) |
Northrop Grumman Corporation ($NOC) stands as a titan in the aerospace and defense industry, renowned for its cutting-edge technology and innovation. This article delves into the key aspects of Northrop Grumman, addressing the who, what, where, when, and why of this influential company. Additionally, it analyzes recent metrics and prospects based on the latest data. Founded in 1939 by Jack Northrop, Northrop Grumman is headquartered in Falls Church, Virginia. The company employs approximately 97,000 people and operates through four primary segments: Aerospace Systems, Mission Systems, Technology Services, and Innovation Systems. These segments encompass a wide array of products and services, from manned and unmanned aircraft to missile defense systems and advanced technological innovations.
Northrop Grumman ($NOC) generates revenue through the following profit centers:
Aerospace Systems: Focused on manned and unmanned aircraft, including the B-2 Spirit bomber and the Global Hawk surveillance aircraft.
Mission Systems: Provides solutions for radar, cybersecurity, and mission-critical systems.
Technology Services: Offers logistics, modernization, and sustainment support.
Innovation Systems: Develops advanced weaponry, space systems, and ammunition.
The company’s headquarters are in Falls Church, Virginia, reflecting its close ties with the U.S. government and its strategic position within the defense sector.
Northrop Grumman’s ($NOC) importance lies in its strategic role in national defense and its contributions to technological innovations. The company’s advanced systems and solutions are critical to maintaining national security and advancing aerospace capabilities.
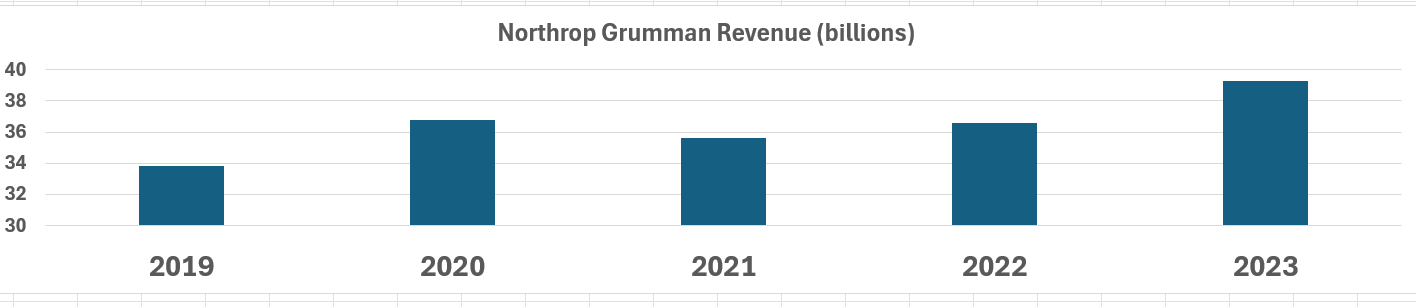
Over the last 5 year $NOC has grown revenue by 16.2%.
Earnings have been much more volatile. And while the company is profitable, earnings are down 8% from 5 year ago levels.
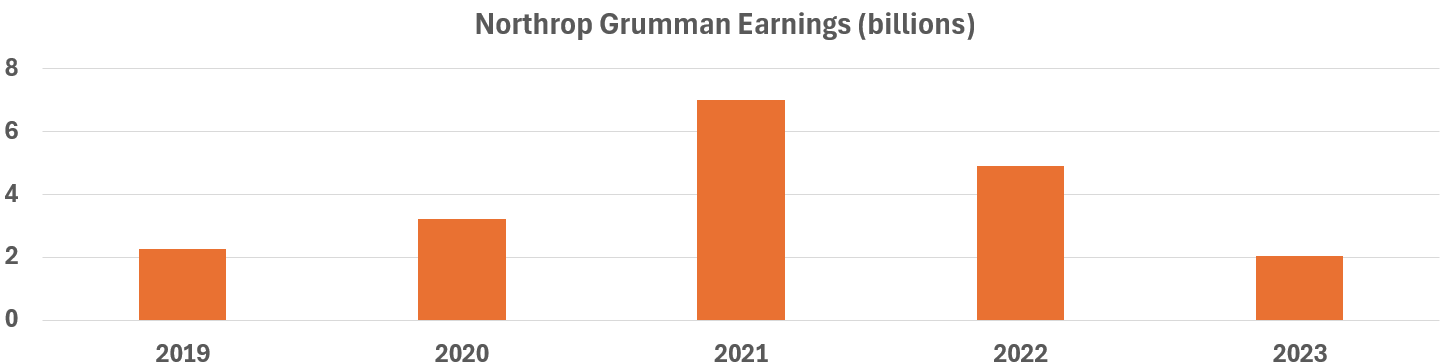
The company has had issues in recent years with cost overruns on many of their contracts.
Thirteen years ago, Northrop Grumman (NOC) shocked the shipbuilding Navy by spinning off Huntington Ingalls and bailing on their Navy shipbuilding business. Fast-forward to today, and Northrop is dipping its toes back into the naval waters once again — this time, with a gargantuan submarine-launched stealth drone for DARPA. Yet, at fivefold since Northrop Grumman left the shipbuilding business, one questions why now?
Northrop Grumman has been successful in making military aircraft. What has drawn the company into the re-entry into a business from which it had earlier withdrawn?
In 2011, military aerospace and shipbuilding giant Northrop Grumman ($NOC) decided it was going to spin off its shipbuilding unit to focus on aerospace. Huntington Ingalls was worth about $2.5 billion at the time, while Northrop Grumman retained a market cap of approximately $14 billion. Fast-forward 13 years, and Northrop Grumman is a $70 billion defense company, having grown fivefold in that period. Huntington Ingalls performed well but hasn’t matched Northrop’s pace of growth.
All this success, yet Northrop Grumman ($NOC) is diving back into the military shipbuilding business now. Why?
Recently, Northrop announced it had completed full-scale sea trials of a large new drone submarine, built for DARPA and dubbed the “Manta Ray.” The Manta Ray is shaped like its namesake and measures roughly 40 feet at its widest and longest points. DARPA describes it as a “new class of long-duration, long-range, payload-capable UUVs,” equipped with multiple payload bays for various naval missions.
Northrop hints that the Manta Ray will operate “in ocean environments where humans can’t go,” a euphemism for deep-sea operations. The Manta Ray can anchor to the seafloor, then hibernate in a low-power state, which may let it sit undetected until activated.
Some analysts believe the Manta Ray is designed to scour the seas for Russian and Chinese submarines. If these speculations are true, it becomes obvious why the U.S. Navy would want the Manta Ray and why DARPA has tapped defense contractors like Northrop to build them. Northrop, along with privately held PacMar Technologies, has contracts to develop these drones, with each contract at approximately $55 million. But analysts are asking themselves why is $NOC changing course now and getting back into the ship building business?
Wall Street analysts often conclude that Northrop changes course whenever one of its business units runs into a patch of trouble. Now, it appears Northrop may be diversifying back into shipbuilding to reduce risks from its aerospace contracts.
Though this is promising, Northrop Grumman still may do better focusing on its core competencies. Instead of diversifying into new areas at the first hint of trouble, it could prove to be more stable if one were to stick with one’s strengths.
The ongoing war in Ukraine has dramatically ramped up the demand for U.S. weaponry in Europe. Nations across the continent are now in high gear, negotiating and sealing deals to acquire American arms, while also expediting ongoing contracts.
And who’s benefiting from this surge? Northrop Grumman, that’s who. The defense giant is now forecasting annual sales to soar to as much as $41.4 billion. That’s an increase from its previous projection of $40.8 billion to $41.2 billion.
Northrop Grumman also sees its adjusted profit per share climbing higher, now expected to range between $24.90 and $25.30, up from an earlier forecast of $24.45 to $24.85 per share.
This is a significant leap, driven by the urgent need for advanced weaponry and the swift moves by European nations to bolster their defenses. As the situation in Ukraine continues to unfold, analysts are keeping a close watch on how these dynamics play out for American defense contractors and the broader implications for our national security.
Northrop Grumman’s re-entry into the shipbuilding business raises some questions regarding strategic direction. Sure, the Manta Ray project epitomizes the innovative capabilities of the company, but it might be perceived a bit as a move against the complications that hit it in the aerospace sector. Diversification and the ability to zero in on tested strengths will make all the difference in these waters that Northrop is navigating.
In this weekly stock study, we will look at and analyze the following indicators and metrics as are our guidelines which dictate our behavior in deciding whether to buy, sell, or stand aside on a particular stock.
- Wall Street Analysts’ Estimates
- 52-Week High and Low boundaries
- Best Case – Worst Case Analysis
- Vantagepoint A.I. Forecast (Predictive Blue Line)
- Neural Network Forecast
- Daily Range Forecast
- Intermarket Analysis
- Our Suggestion
We don’t base our decisions on things like earnings or fundamental cash flow valuations. However, we do look at them to better understand the financial landscape that a company is operating under.
Wall Street Analysts’ Estimates
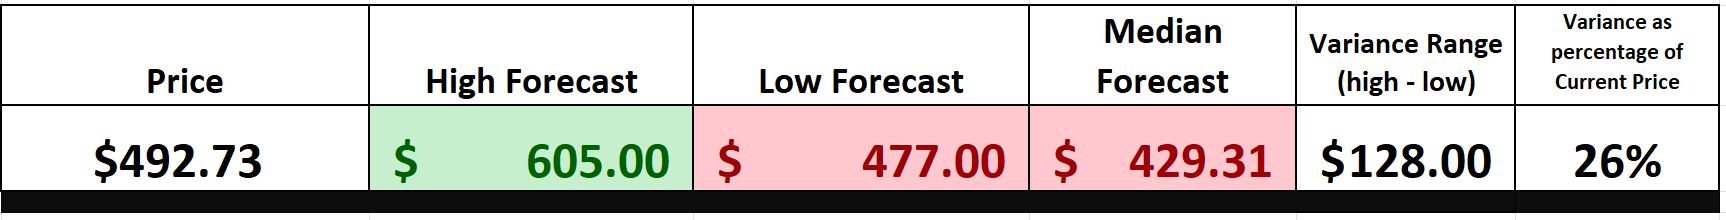
Let’s look at Northrop Grumman and what the Wall Street analysts are saying. Over the past three months, 15 Wall Street analysts have offered their 12-month price targets for the defense giant. The average price target is set at $529.31, with projections ranging from a high of $605.00 to a low of $477.00.
This average target suggests a potential 7.42% increase from the current price of $492.73.
We advise traders to ALWAYS pay close att3ention to the variance between the most bullish and bearish forecasts as this is where the volatility is baked into the price action. At present time, Wall Street analysts have a variance of opinion of $128. This represents 26% of the current price and is considered moderately high volatility.
52-Week High and Low Boundaries
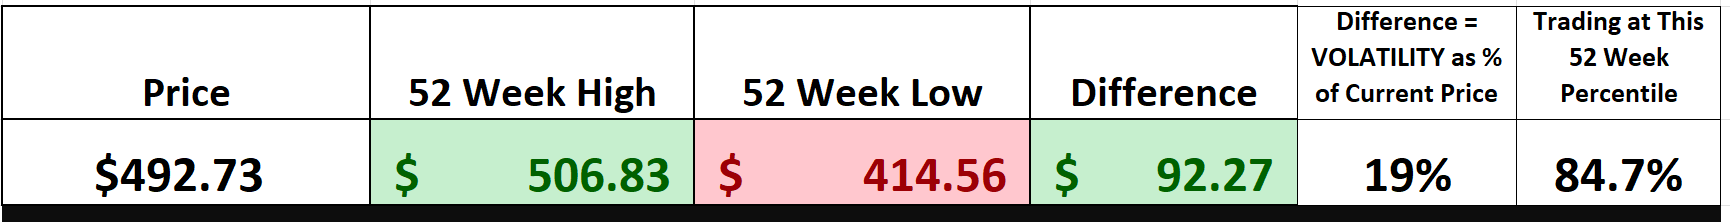
Keeping an eye on the 52-week high and low boundaries is critical. These metrics provide us with valuable insights into a stock’s performance, momentum, and volatility. The 52-week high, the peak price a stock has hit over the past year, indicates strong performance and potential resistance levels. On the flip side, the 52-week low highlights the lowest price in the same period, pointing to potential support levels and investor pessimism.
The 52-week high for Northrop Grumman is $506.83, while the 52-week low is $414.56, with a recent close at $492.73. This range illustrates significant volatility and momentum shifts. For traders, this is essential to understand future potential price movements. Using the annual trading range as a guide, traders can anticipate that $NOC could conceivably trade 19% higher or lower over the next 52 weeks, given these historical price swings. This knowledge is crucial for planning entry and exit strategies, managing risk, and setting realistic profit targets.
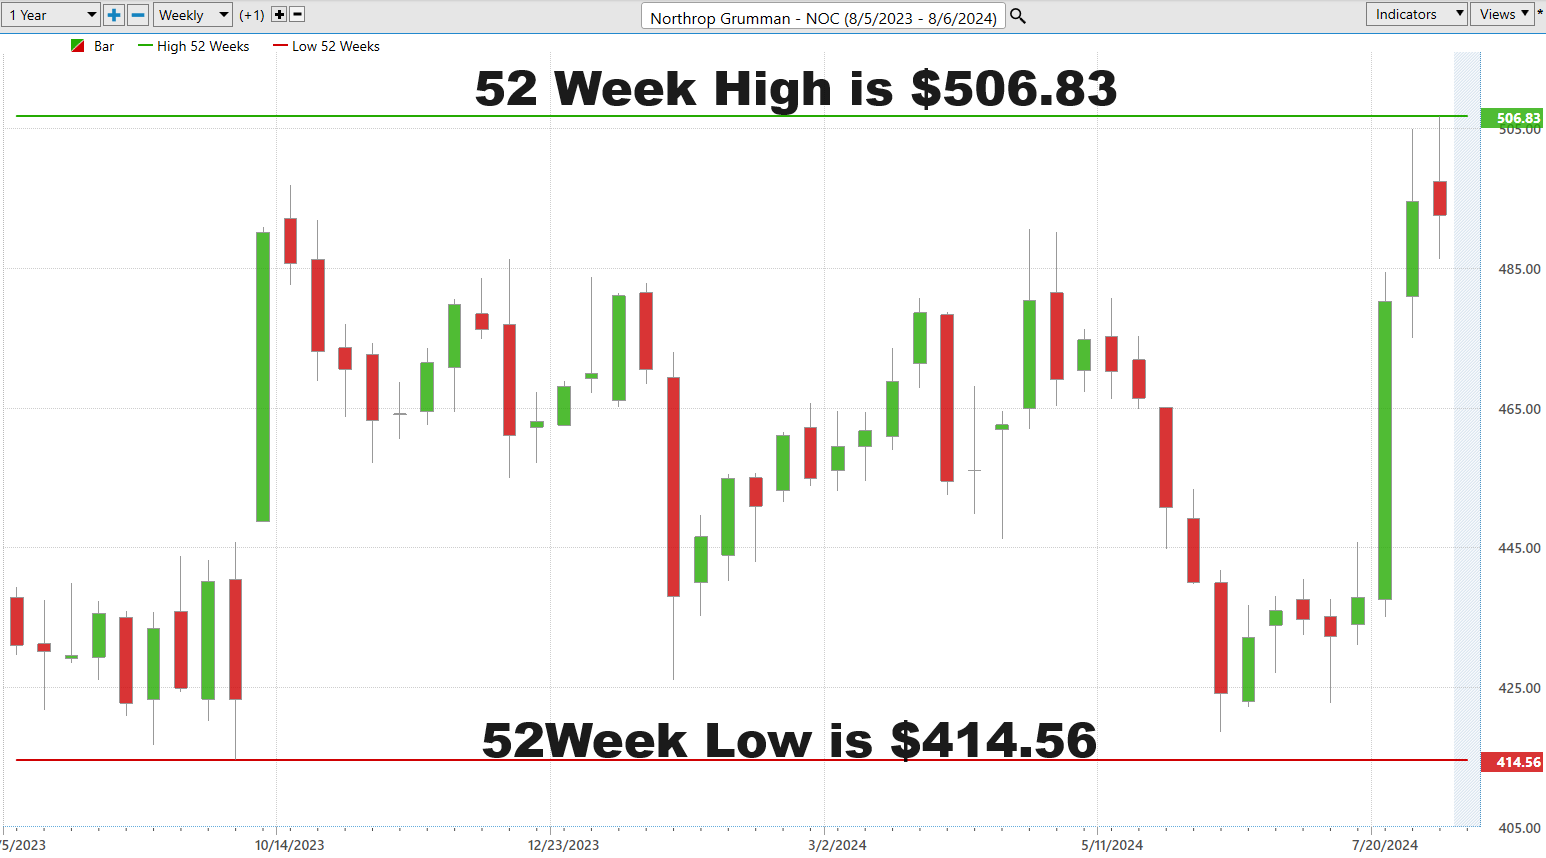
Looking at the 52-week chart from this angle also allows us to see that over the entire year, the stock has traded in a very broad consolidation pattern, even though it recently broke out to new 52-week highs.
But don’t stop there. Zooming out to study the 10-year chart provides a broader perspective on the longer-term trend. Over the last decade, $NOC has traded as high as $556.27 and as low as $118.24.
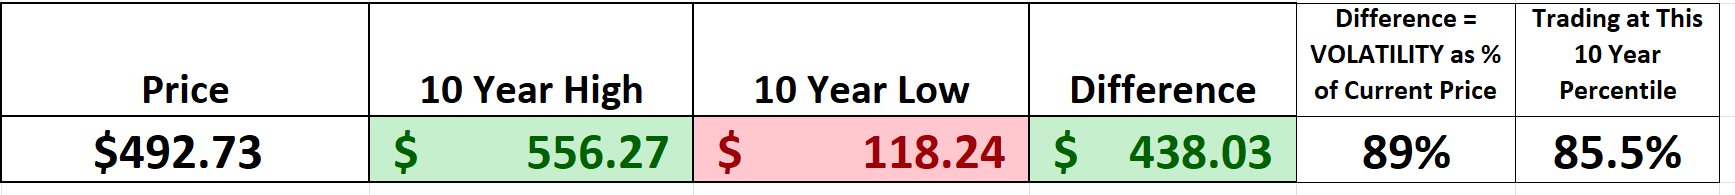
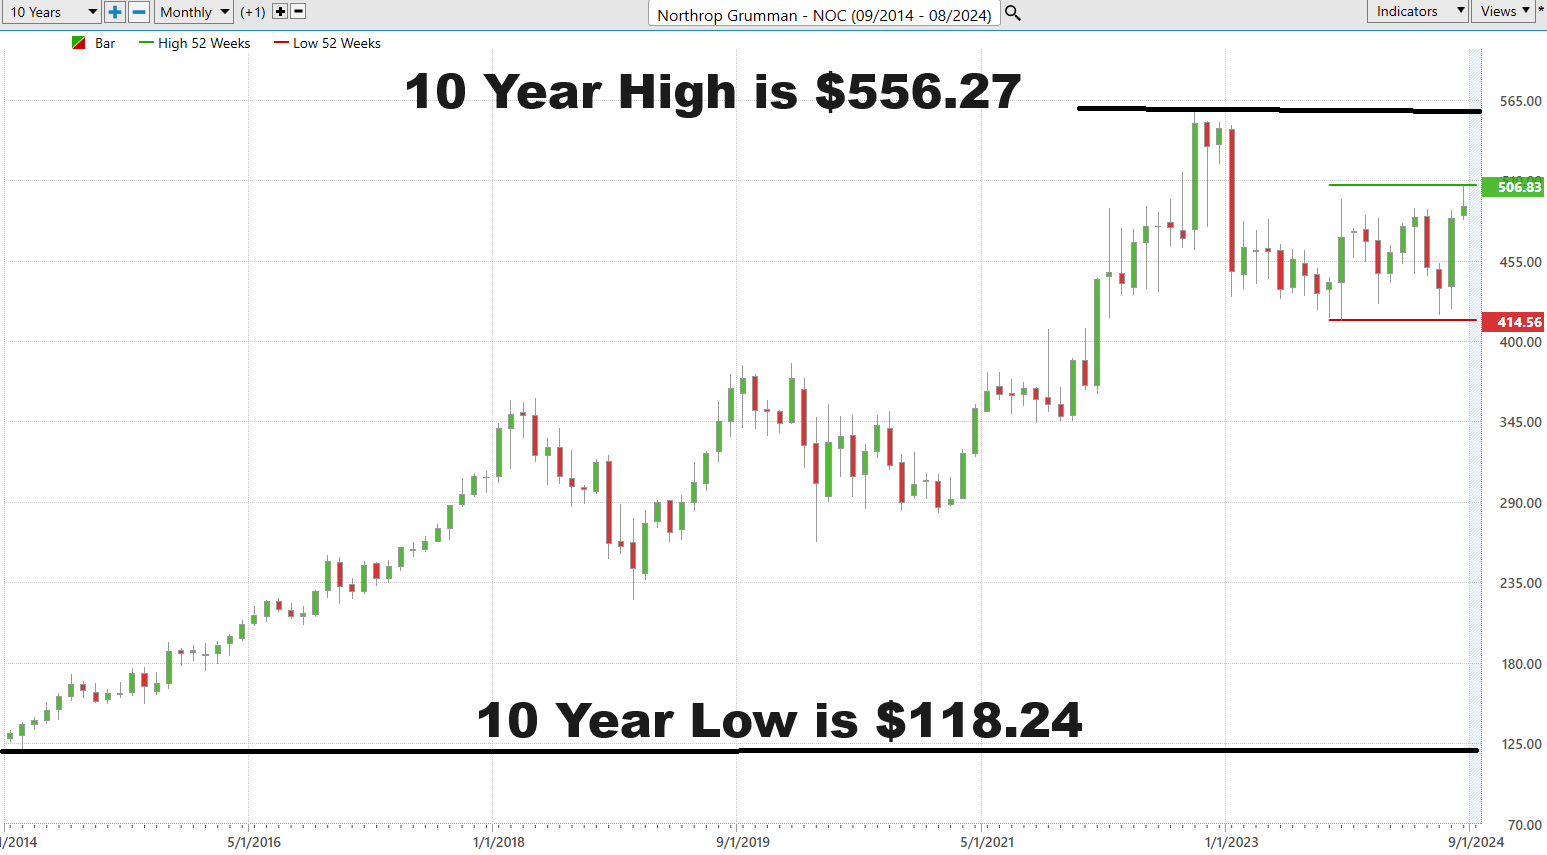
By zooming out to the 10-year chart we can see two crucial areas of price resistance on the chart, the 52-week high at $506.83 and the 10-year high at $556.27. While the trend is clearly up these areas of resistance can challenge us to re-evaluate how we approach this market. Some alternatives that are potentially very attractive are option spreads.
Best Case – Worst Case Analysis
Many traders plunge into the market woefully unprepared and blissfully unaware of the inherent risks, often dazzled by greed and their own overconfidence. However, there’s a straightforward yet powerful technique to effectively gauge both risk and reward: analyzing the strength of rallies and declines over the past year.
Examining a stock’s price chart provides a tangible perspective on volatility, vividly demonstrating how market prices can swing dramatically due to various factors such as market events and investor sentiment. This visual representation of market movements over time highlights the ebbs and flows of stock prices in a way that’s easily comprehensible.
The purpose of this exercise is to define risk and reward quantitatively over the past year. By examining the magnitude of rallies and declines, traders can see how rapidly trends emerge and dissipate, providing a clear-cut understanding of volatility.
For instance, a price chart during a market rally will show a consistent upward trend with occasional dips or corrections, reflecting periods of investor optimism and confidence as they buy stocks in anticipation of future gains. Conversely, during a market decline, the chart will illustrate sharp price drops interspersed with brief rallies, signaling fear and uncertainty as investors sell off stocks to mitigate losses. By comparing the magnitude of these rallies and declines, traders can set realistic expectations and better prepare for potential market volatility.
First, we look at the best-case scenario, assuming we buy at the lows and sell at the highs.
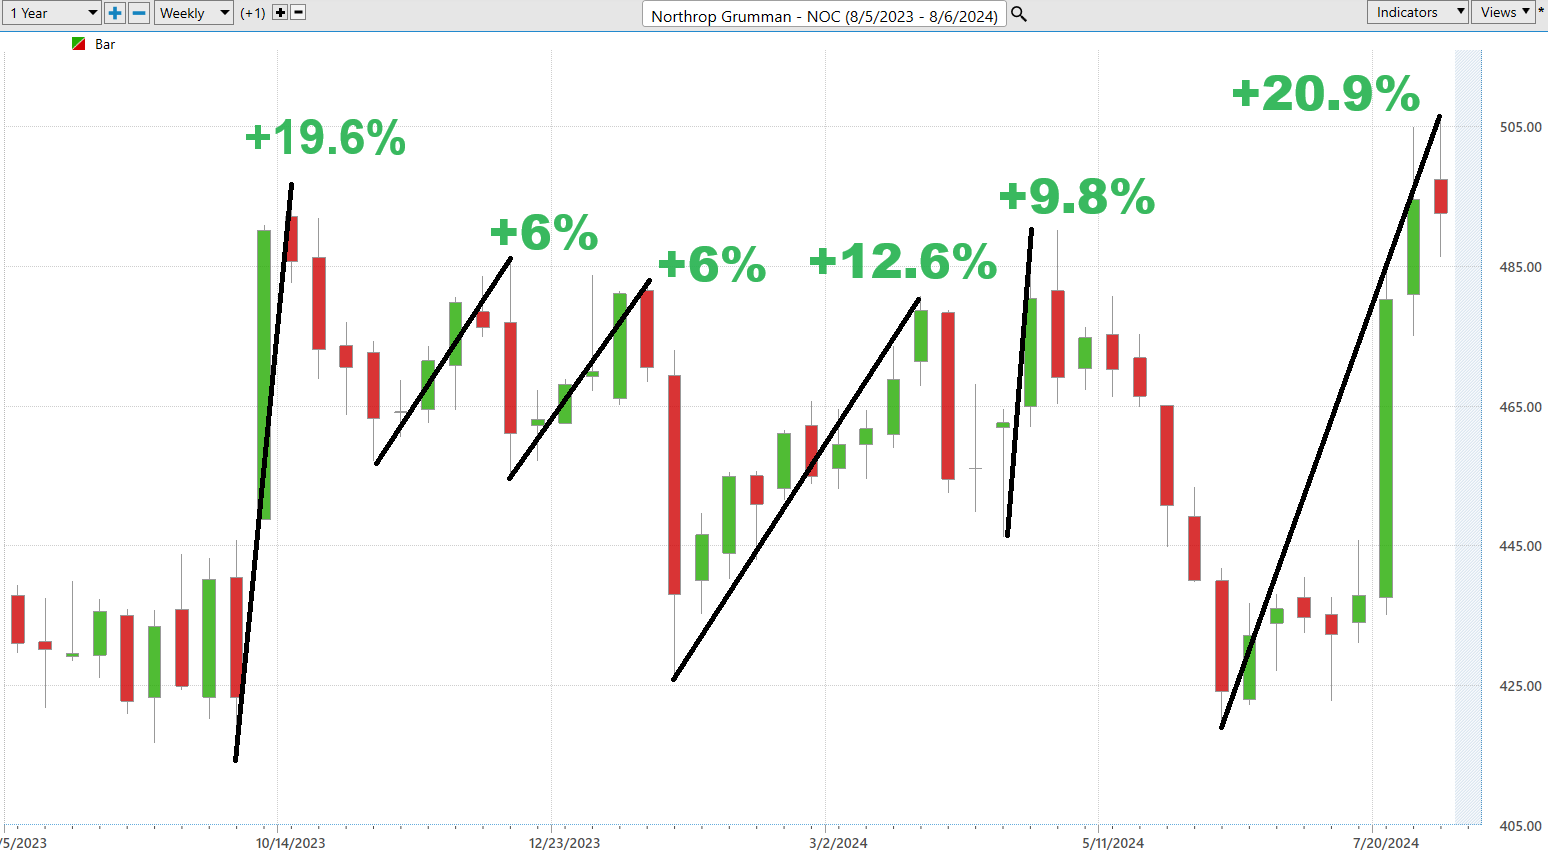
This approach provides a benchmark for maximum potential gains and losses, allowing traders to understand the full spectrum of market dynamics. By doing so, traders can make more informed decisions, balancing ambition with a measured approach to risk management.
Next, we look at the worst-case scenario which assumes we buy the highs and sell the lows.
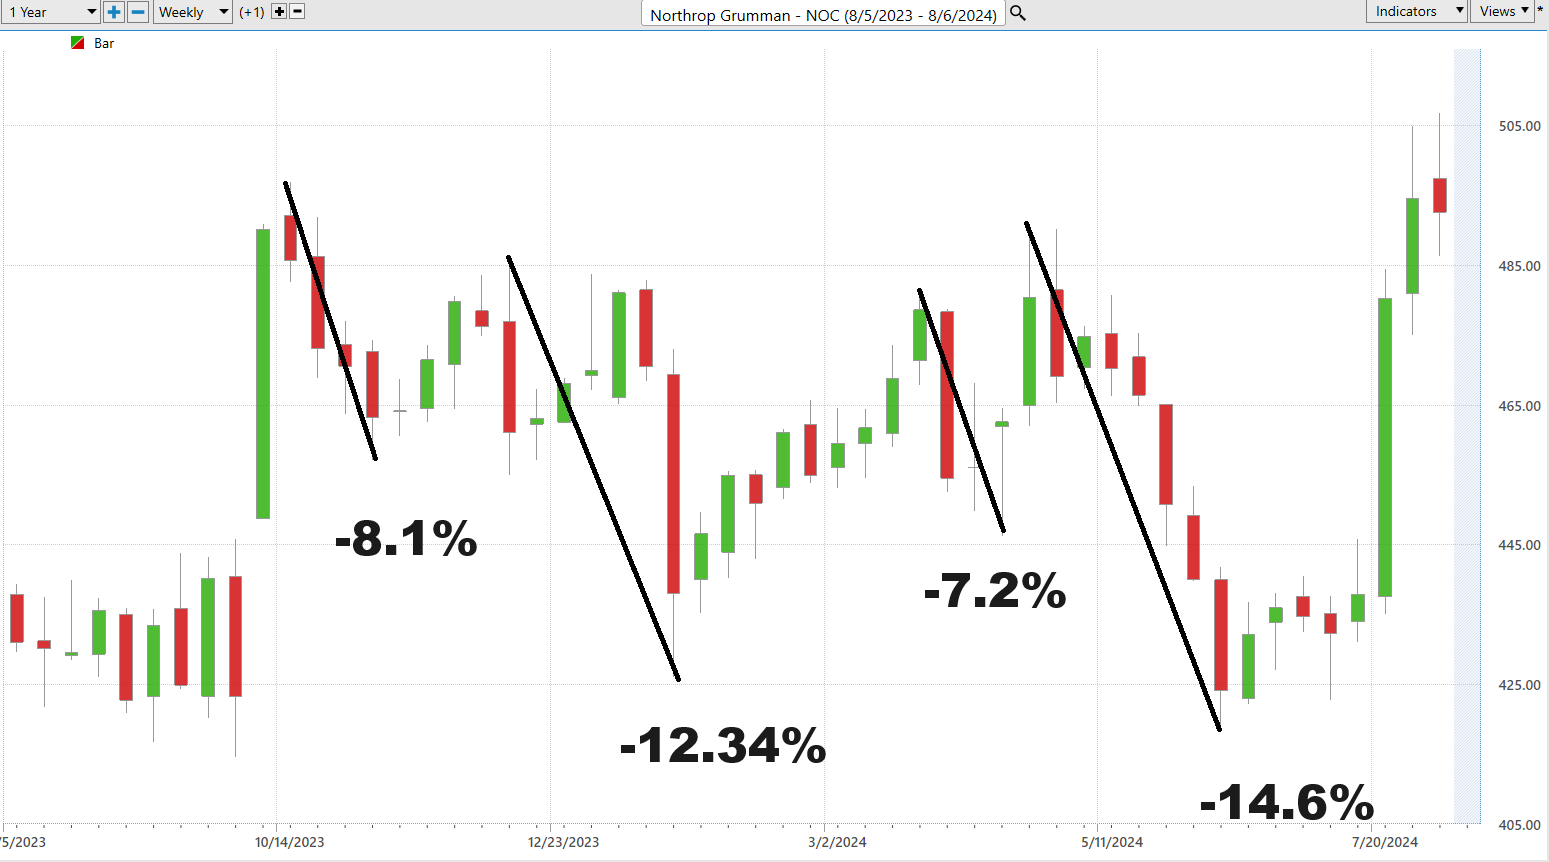
This simple exercise lets us see that over the past year we can quickly see the magnitude of the rallies and the declines and allows us to strategize accordingly.
Lastly, we now compare $NOC to the broader market indexes to compare performance. By doing so we can get a more granular understanding of volatility.
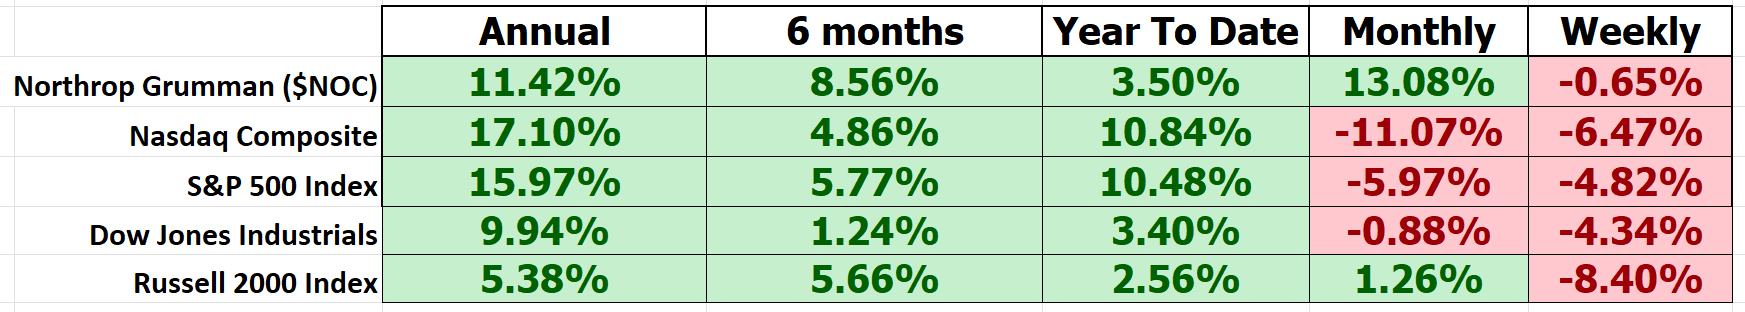
$NOC has outperformed on the shorter-term time horizons.
Finally, we compare $NOC to the other defense contractors to gauge performance in the sector:
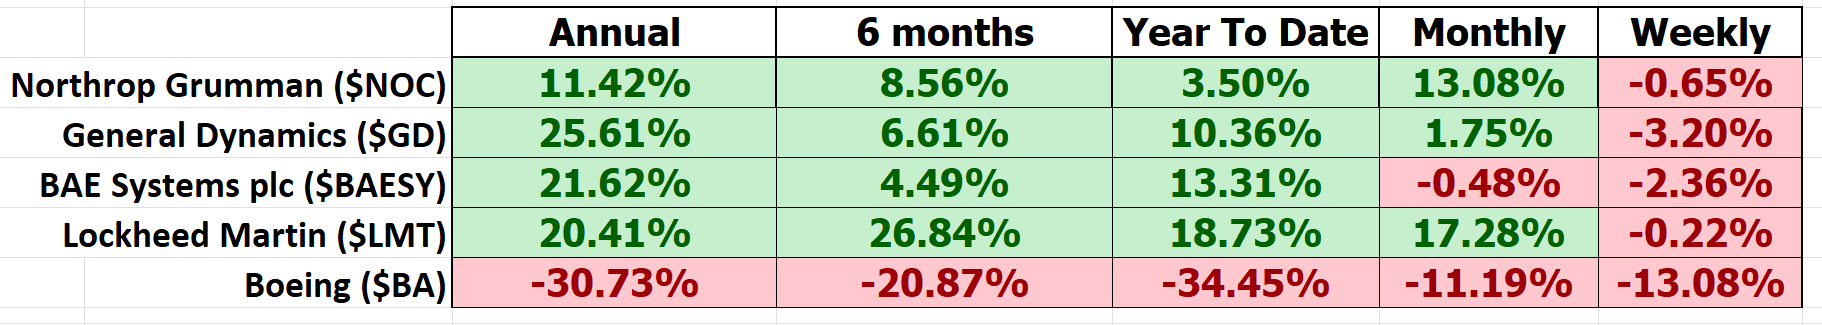
The 5-year beta for Northrop Grumman Corporation ($NOC) is 0.32. This figure is quite significant in the context of stock market volatility and risk assessment. A beta of 0.32 for Northrop Grumman ($NOC) indicates that the stock is 68% less volatile than the overall market. This means that Northrop Grumman’s share price experiences smaller fluctuations compared to broader market movements, reflecting lower risk. For investors, this implies more stable returns and reduced exposure to market volatility, making $NOC an attractive option for those looking to manage risk and maintain portfolio stability, particularly in uncertain market conditions. Stocks with low beta values like Northrop Grumman are often used to diversify a portfolio, reducing overall risk. Adding such a stock can help balance out more volatile investments.
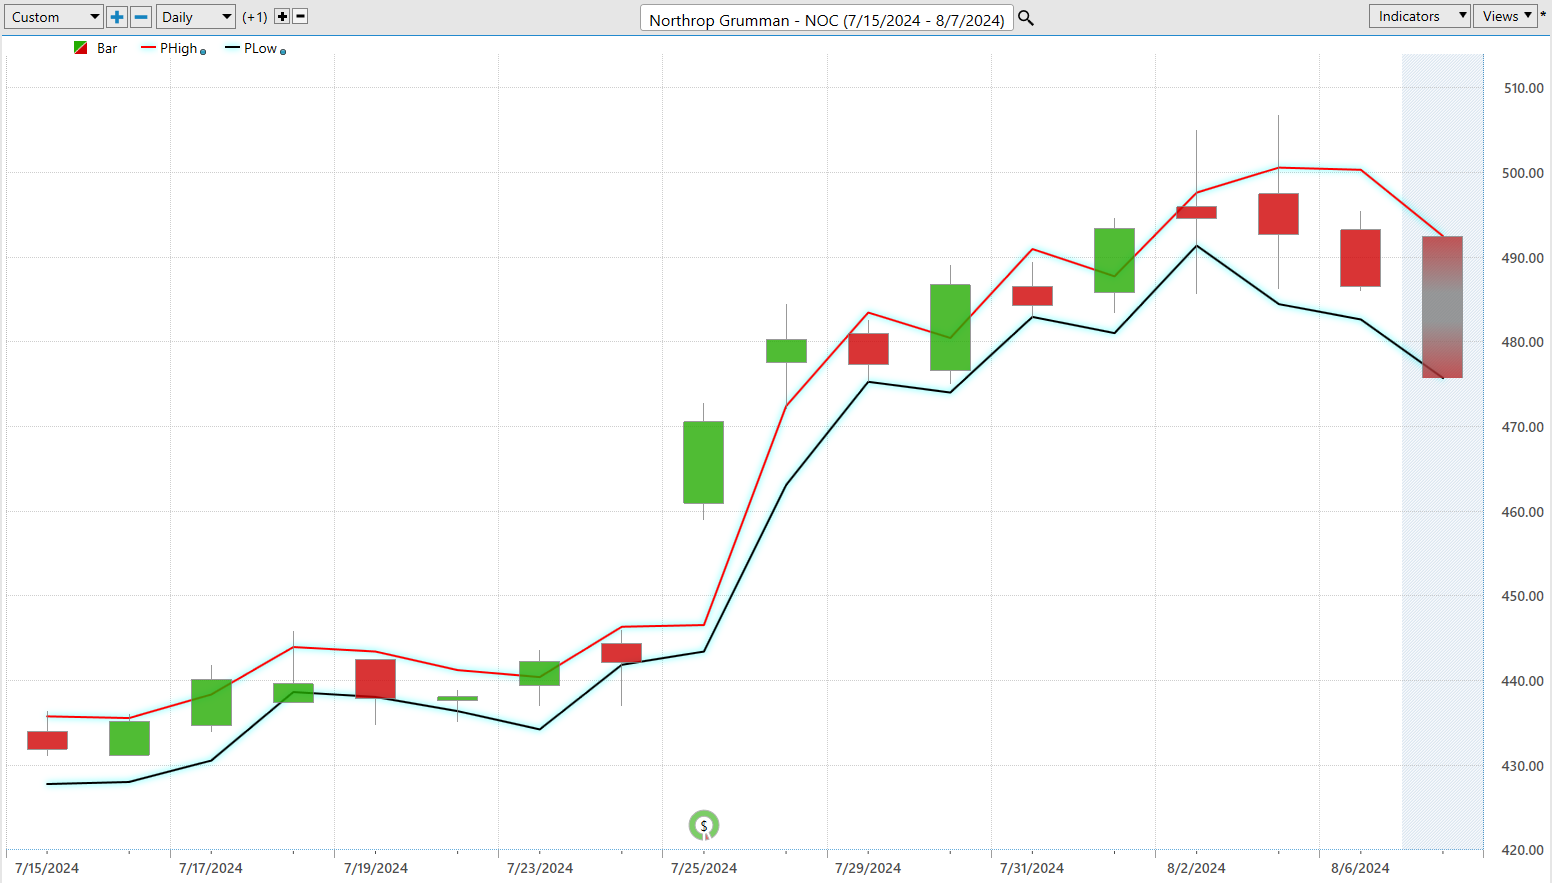
Vantagepoint A.I. Predictive Blue Line
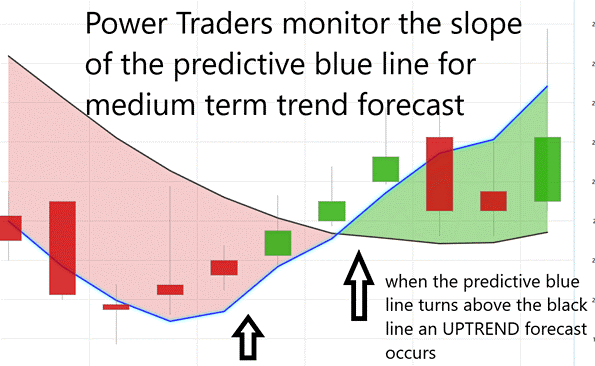
Let’s unpack the essentials of trading with VantagePoint Software, a tool that’s revolutionizing how traders navigate market trends using artificial intelligence. Increasingly, traders are harnessing the power of AI to predict market movements by closely monitoring the predictive blue line’s trajectory. On the charts, the black line represents a simple 10-day moving average, reflecting past market performance. However, the true innovation lies in the predictive blue line, which signifies the value zone where traders aim to buy during uptrends.
When evaluating these charts, the interaction between the black and predictive blue lines becomes crucial. Powered by VantagePoint’s patented Neural Network and Intermarket Analysis, the blue line incorporates key price drivers and statistical correlations to determine an asset’s value.
Here’s the crux: when the predictive blue line crosses above the black line, it signals an upward trend, marking a potential entry point for traders. Conversely, when it falls below, it suggests a potential decline. This methodology enables traders to identify trends and value zones with enhanced precision.
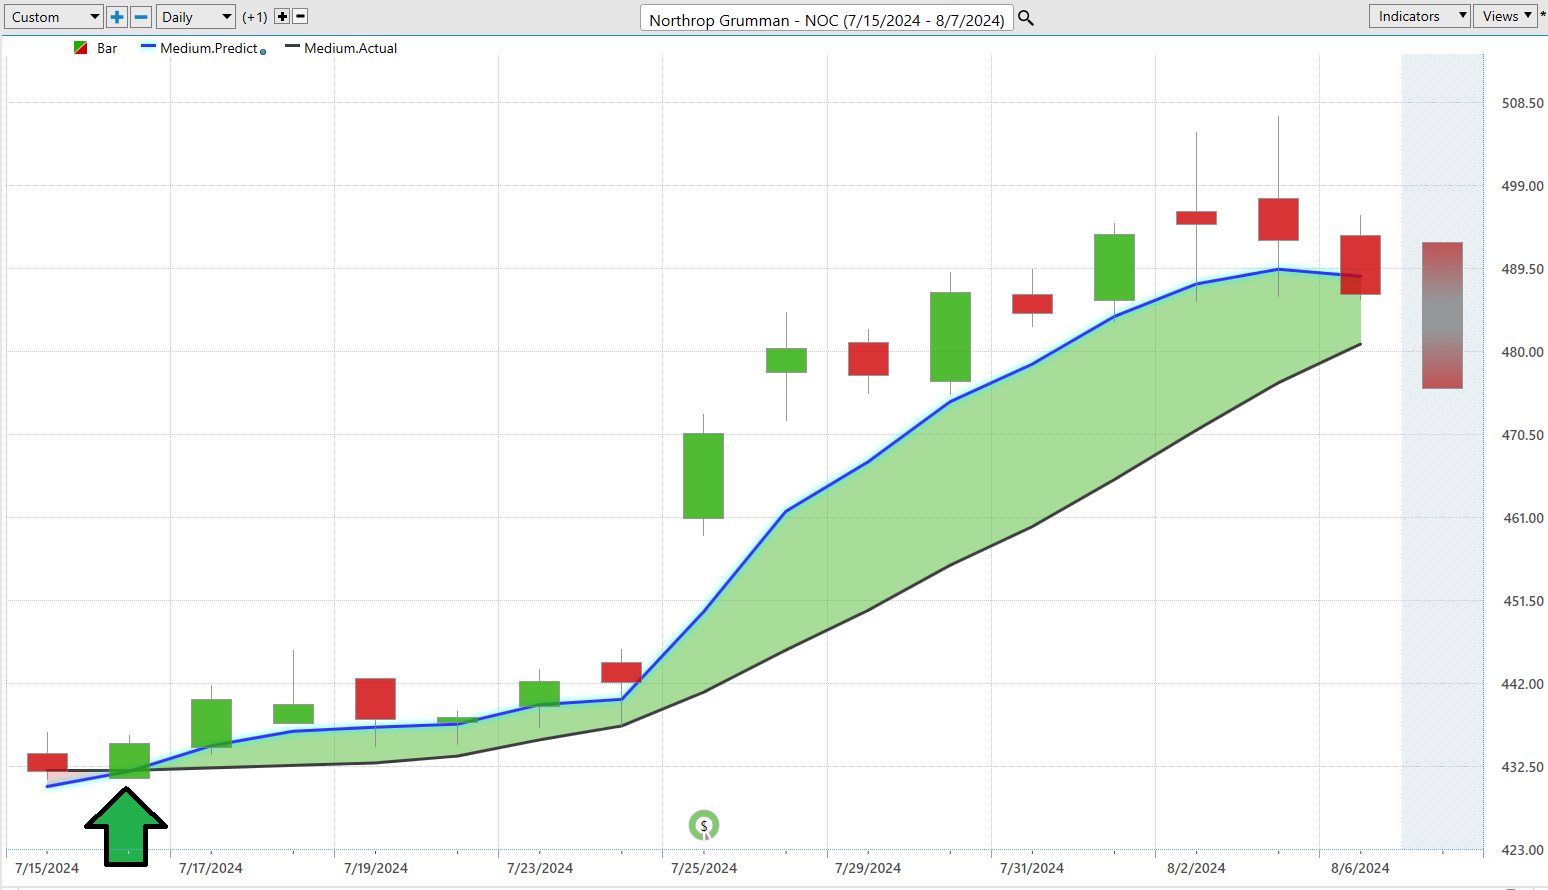
For short-term swing traders, the emphasis is on the trend rather than the popularity of a stock. Take Northrop Grumman ($NOC) for example. While it may not be as popular as some Wall Street darlings, it still offers substantial trading opportunities.
The predictive blue line acts as a foresight tool for future market movements. A rising blue line indicates a bullish trend, suggesting a buying opportunity, whereas a declining blue line warns of potential price drops. Timing is crucial here. The ‘Value Zone’ around the predictive blue line is vital—buy when the stock is at or below this line during uptrends and sell when it peaks during downswings. This approach helps traders maximize gains and minimize risks. A descending blue line signals potentially lower prices ahead, prompting savvy traders to step back, hedge their positions, or take protective measures for their portfolios.
Thanks to advancements in AI, traders now have precision tools that offer insights previously unimaginable. The predictive blue line is more than just a tool; it’s a beacon guiding traders through market fluctuations toward profitable moves.
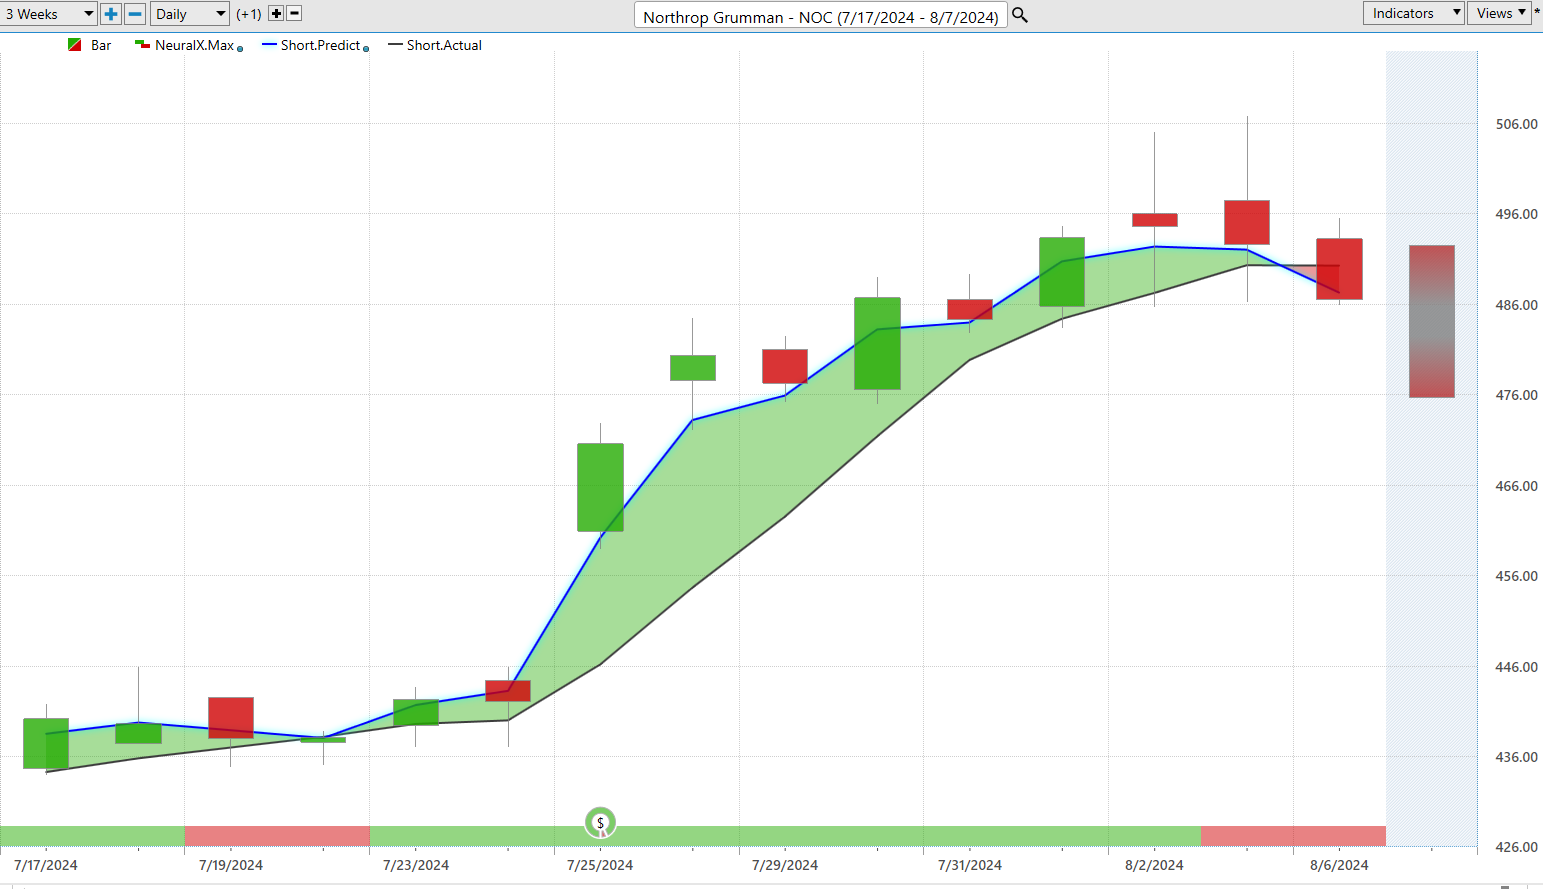
Vantagepoint A.I. Neural Index (Machine Learning)
Now let’s dive into neural networks—these aren’t your standard algorithms. Think of them as an advanced form of artificial intelligence that mimics the human brain’s way of processing information. Imagine layers upon layers of interconnected nodes, or neurons, working together to analyze data and uncover complex patterns. In the trading world, neural networks are revolutionizing the game. They can sift through vast amounts of historical price data, technical indicators, fundamental data, sentiment data, intermarket data, and macroeconomic data to make predictions that human analysts might miss.
So, why is this significant? Traders leveraging neural networks can anticipate market movements with greater accuracy. These networks learn from historical data and adapt to new conditions, giving traders a sharper edge in decision-making, optimizing entry and exit points, and staying ahead of market shifts. The speed and efficiency of these networks provide traders with real-time insights, which is crucial in today’s fast-paced markets.
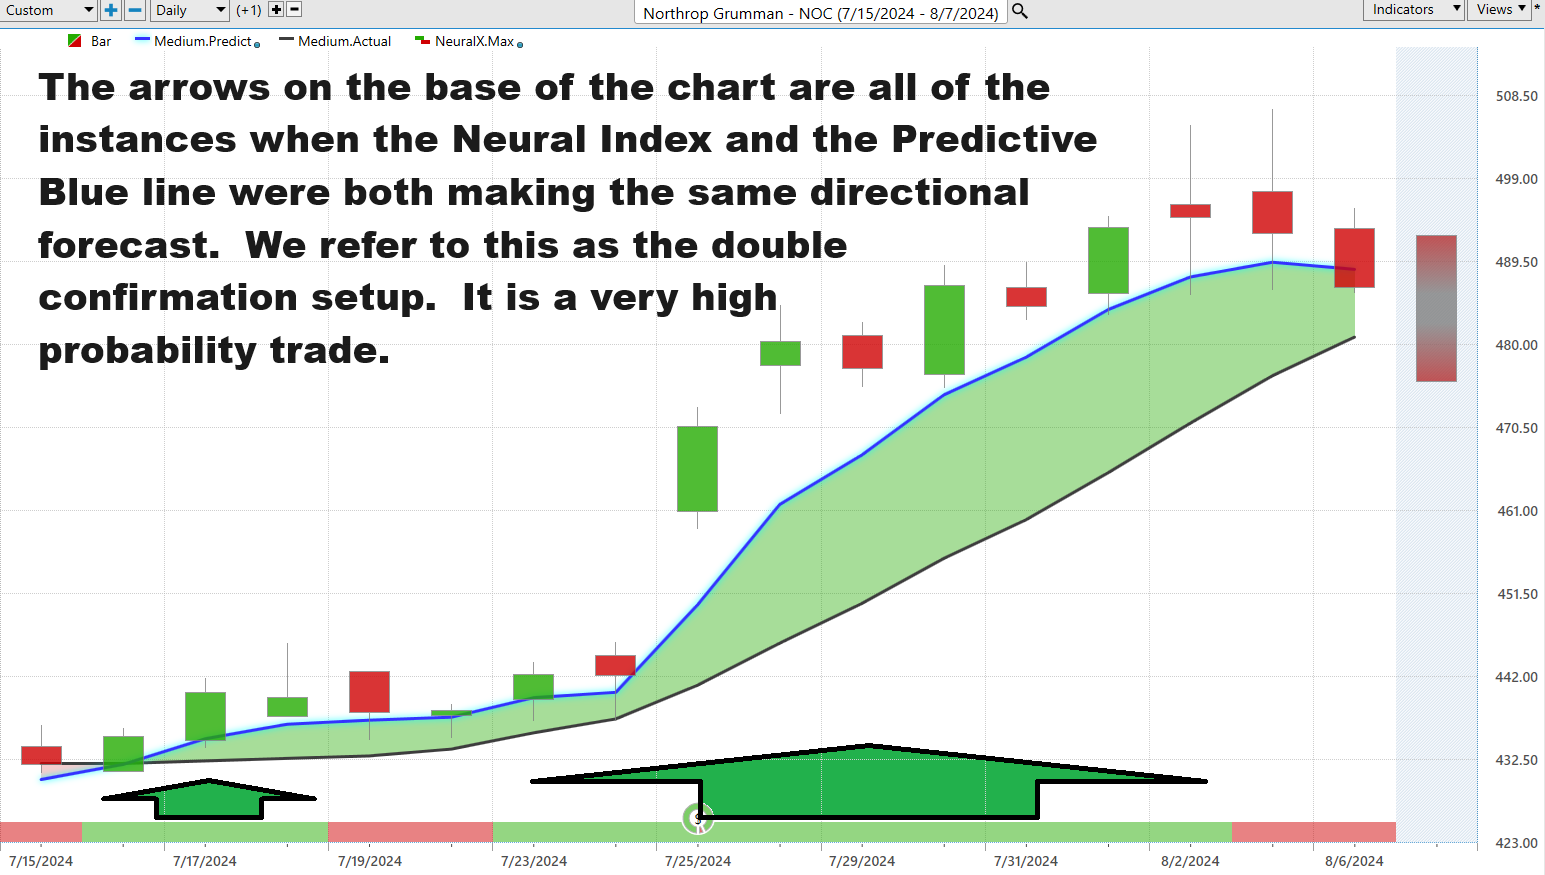
The real kicker is the continuous evolution of neural networks—they get smarter over time, enhancing their predictive capabilities. For traders, this translates to a toolkit that not only forecasts market trends but also improves risk management and potentially boosts returns. Neural networks don’t just add value—they are a strategic asset. They illuminate the charts, with green for buy signals and red for sell signals. Combine this with tools like the Predictive Blue Line, and you get a powerful duo that helps traders navigate the market with precision.
When you look at the chart below, notice how the predictive blue line defines value and the overall trend. Pay attention to the neural index forecast for the next 48 to 72 hours, providing traders with signals on short-term market strength or weakness. It’s all about staying ahead and making informed decisions. That’s the transformative power of neural networks in trading.
VantagePoint A.I. Daily Range Forecast
Next, let’s get down to one of the toughest challenges in trading—knowing when to jump in and when to bail out. Market volatility can knock you off balance, making those decisions even harder. For traders eyeing stocks like Northrop Grumman ($NOC), getting the timing right means understanding the ebb and flow of daily, weekly, and monthly trading ranges—and then putting that knowledge to work.
Here’s the bottom line: it’s not just about having the data; it’s about turning that data into winning strategies. That’s where the heavy hitters like A.I., machine learning, and neural networks come in. These technologies aren’t just buzzwords—they’re your secret weapons in the financial markets. They give you clear, actionable insights into market trends and pinpoint trading ranges with remarkable accuracy, cutting the guesswork out of your trading decisions.
So, let’s break down the volatility for Northrop Grumman ($NOC) over the past year, analyzing it daily, weekly, and monthly.
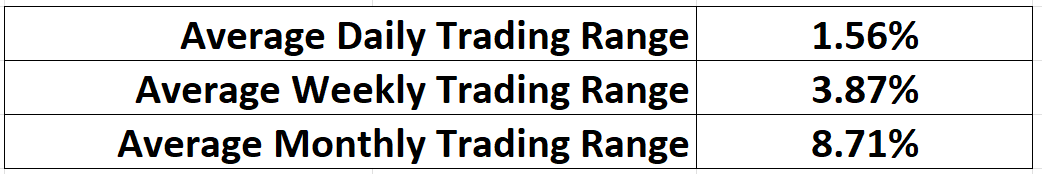
This is the kind of intel that can give you the edge in your trading game, helping you make informed, strategic moves. But the numbers listed above are just data. You still need to know at what price level you should strike.
Enter the VantagePoint A.I. Daily Range Forecast. This forecast provides traders with intel every day as to where the projected high and low prices are expected to be.
With these tools and insights at your disposal, you’re not just participating in the market—you’re dominating it.
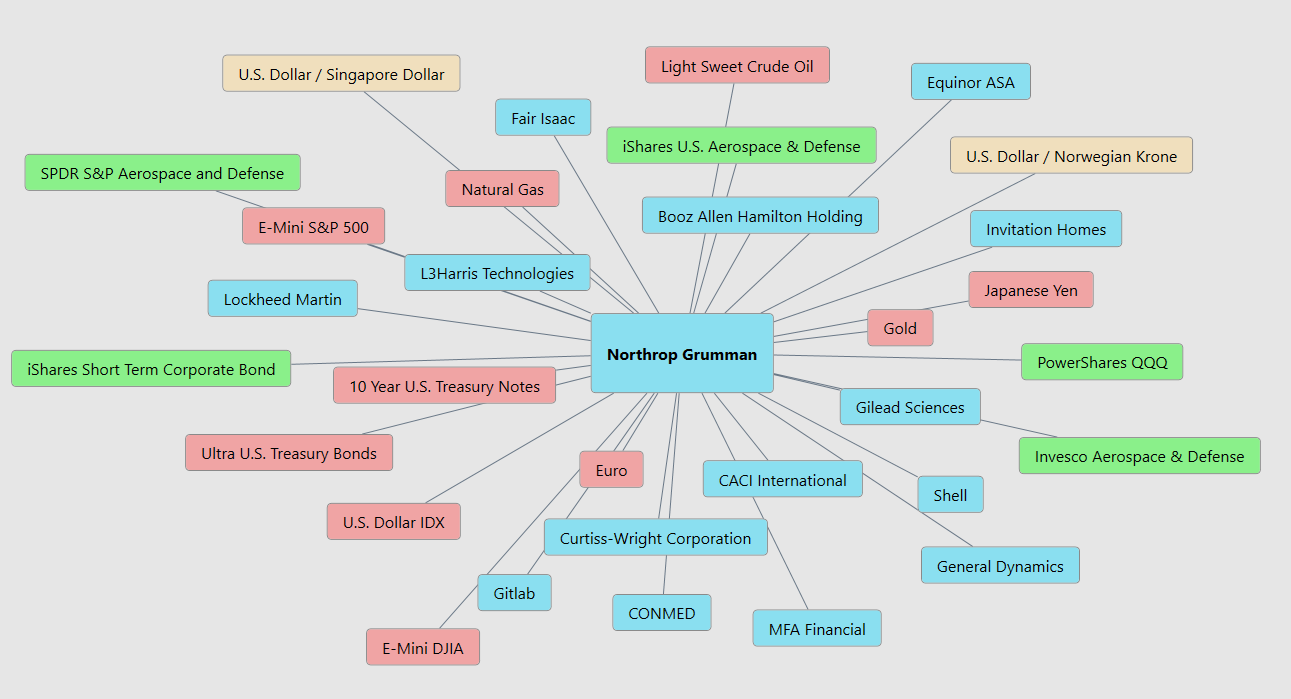
Intermarket Analysis
Intermarket analysis examines the correlations between different financial markets to forecast price movements and improve trading decisions. It’s all about understanding the relationships between various asset classes—stocks, bonds, commodities, and currencies—and seeing how movements in one market can influence another. By observing these intermarket connections, traders can gain valuable insights into broader market trends, identify potential turning points, and develop more comprehensive trading strategies. This holistic approach helps traders anticipate price movements based on the interplay of different market forces, ultimately enhancing their profitability.
Two key figures who have significantly advanced the field of intermarket analysis are John Murphy and Lou Mendelsohn. John Murphy, through his seminal works like “Intermarket Technical Analysis,” showed how intermarket relationships can be harnessed to predict market movements, providing traders with a competitive edge. Meanwhile, Lou Mendelsohn, a pioneer in trading software, integrated intermarket analysis into the VantagePoint software. His work emphasized the importance of intermarket data in improving the accuracy of trading forecasts. Together, their contributions have significantly advanced the acceptance and application of intermarket analysis among traders.
So, as we navigate the complexities of the financial markets, it’s crucial to consider the broader picture. By understanding how different markets interact, traders can make more informed decisions and enhance their strategies. As you study the graphic below, recognize that you are looking at the 31 key drivers of price for $NOC. These are the assets most responsible for the price action of $NOC.
Our Suggestion
In the first half of 2024, Northrop Grumman reported strong financial performance, with Q1 revenues of $9.7 billion and net earnings of $946 million, driven by demand in defense and space segments. Q2 saw continued growth with revenues reaching $10.2 billion and net earnings of $1.04 billion. Earnings per share (EPS) increased to $6.45 in Q1 and $6.98 in Q2. The company also raised its full-year guidance, projecting sales between $41.4 billion and $41.8 billion, and adjusted EPS between $24.90 and $25.30.
The next earnings call for Northrop Grumman ($NOC) is expected to be on October 24, 2024. For this upcoming Q3 2024 earnings report, analysts have set their expectations with estimated earnings per share (EPS) between $5.92 and $6.13, with an average estimate of $6.03. This projection follows the strong performance in Q2 2024, where Northrop Grumman reported an EPS of $6.36, surpassing the consensus estimate of $5.93, and revenue of $10.22 billion, which also exceeded expectations of $10.02 billion.
$NOC and other defense contractors continue to be huge beneficiaries of armed conflict around the globe.
We advise traders to continue to follow the VantagePoint A.I. Daily range forecast for guidance. $NOC will continue to present great trading opportunities in the coming year.
Practice good money management on all of your trades.
Let’s Be Careful Out There.
It’s Not Magic.
It’s Machine Learning.
Disclaimer: THERE IS A HIGH DEGREE OF RISK INVOLVED IN TRADING. IT IS NOT PRUDENT OR ADVISABLE TO MAKE TRADING DECISIONS THAT ARE BEYOND YOUR FINANCIAL MEANS OR INVOLVE TRADING CAPITAL THAT YOU ARE NOT WILLING AND CAPABLE OF LOSING.
VANTAGEPOINT’S MARKETING CAMPAIGNS, OF ANY KIND, DO NOT CONSTITUTE TRADING ADVICE OR AN ENDORSEMENT OR RECOMMENDATION BY VANTAGEPOINT AI OR ANY ASSOCIATED AFFILIATES OF ANY TRADING METHODS, PROGRAMS, SYSTEMS OR ROUTINES. VANTAGEPOINT’S PERSONNEL ARE NOT LICENSED BROKERS OR ADVISORS AND DO NOT OFFER TRADING ADVICE.