| This Week’s a.i. Stock Spotlight is TESLA Motors ($TSLA) |

Tesla continues to confound investors, leading the charge in the electric vehicle revolution while ambitiously expanding into energy, robotics, and artificial intelligence. With grand visions of self-driving fleets and humanoid robots becoming a staple in our daily lives, the real question is, how long can investors afford to wait for these futuristic promises to turn into concrete profits?
As it stands, Tesla’s mainstay, the electric vehicle market, is experiencing turbulence. So, are Tesla’s future prospects strong enough to warrant buying shares today?
Here’s the essential rundown:
Elon Musk, Tesla’s ever-bold CEO, is pushing the company’s stakes higher with each passing quarter. The bet ? That Tesla will perfect autonomous driving and successfully launch its much-anticipated Robotaxi service. Musk was quite clear on Tesla’s Q2 earnings call, stating that if investors don’t believe in Tesla’s autonomous future, they might as well sell their shares. Remember, Musk has been championing Tesla’s autopilot capabilities since 2013, predicting near-complete autonomous driving in just three years—a target that has obviously stretched out but has seen significant advancements, especially with the recent integration of neural networks to better interpret real-world data.
Tesla is gearing up to unveil its Robotaxi this coming October. However, let’s not confuse a flashy unveiling with an actual launch—recall the Cybertruck saga that only saw delivery start four years after its introduction.
Investors/Traders must critically assess the gap between Robotaxi’s showcase and its operational deployment in the market.
According to Musk, activating Robotaxi would be as simple as flipping a switch, allowing your Tesla to earn its keep as it shuttles passengers. Yet, for legal and safety reasons, near-flawless Full Self-Driving (FSD) functionality is non-negotiable. Early assessments of the latest FSD iteration (version 12.5) suggest there are still hurdles, particularly with adaptive decision-making and poor weather navigation.
It’s imperative to understand that progress in technology isn’t linear; perfecting the final touches on Full Self Driving (FSD) may well prove to be the most challenging phase.
Tesla’s rise has been fueled by a surge in EV adoption globally. Yet recent trends suggest some cooling. Despite surpassing market predictions, Tesla’s Q2 deliveries fell by 5% year over year. Meanwhile, overall vehicle sales in the U.S. ticked up slightly.
What’s the hang-up? It appears U.S. consumers are rethinking the viability of battery EVs. A McKinsey survey indicates nearly half of American EV owners are considering a return to gasoline due to persistent issues like insufficient charging stations, high costs of ownership, and limited range. It turns out, hybrid vehicles might just be Tesla’s real competition.
Tesla faces a complex landscape of challenges and opportunities as it navigates the competitive electric vehicle (EV) market, particularly in China and Europe. Despite a promising start to Q3 in China, Tesla’s overall sales are declining due to factors like reduced subsidies in key markets such as Germany. The company is grappling with intense local competition offering more affordable alternatives, highlighting the need for Tesla to possibly adjust its pricing strategies and enhance its marketing efforts to better promote its higher-priced models like the Model 3 and Model Y. Additionally, there is a significant gap in public awareness and promotion in both the U.S. and Europe, which Tesla needs to address to leverage potential price advantages and incentives. Looking forward, Tesla is considering the launch of more affordable models by 2025 to stimulate growth and is exploring the potential of its vehicles in the Robo-Taxi market, although this introduces new challenges related to vehicle durability and customer service. The video emphasizes the necessity for Tesla to refine its market strategies, improve promotion, and possibly revise pricing to revitalize its market position and capitalize on future growth opportunities.
Tesla’s reliance on regulatory credits—a significant slice of its profit pie—might also wane as governmental policies evolve with shifting consumer preferences and political climates. As Tesla’s stock hovers around half its peak value, Wall Street seems to be waking up to the dual challenges facing the company: delays in Robotaxi and ongoing struggles in the EV market.
If you believe Robotaxi is around the corner, then perhaps you can overlook Tesla’s current vehicle market woes, anticipating that Robotaxi will bring in hefty profits that significantly enhance the company’s earnings potential. On the flip side, if the weight of Tesla’s present difficulties in the vehicle sector is too great, there could be rougher road ahead for the stock price.
While traditional automakers like General Motors are expected to see earnings grow by a steady 10% annually, Tesla, with a projected 20% growth rate, trades at a P/E ratio of 86—a premium that bets heavily on the success of its Robotaxi venture.
In sum, Tesla remains a high-risk investment. As we navigate these turbulent times, prudent investors should approach with caution, prepared for the possibility that Tesla may never align with more traditionally valued automotive stocks—if its high-tech ventures falter.
Tesla’s next earnings call is on October 16, 2024. Earnings and key progress of Full Self Driving technology are the key drivers here. FSD promises to be huge and would give Tesla first mover advantage and a huge jump on all its competition.
In this weekly stock study, we will look at an analysis of the following indicators and metrics which are our guidelines which dictate our behavior in deciding whether to buy, sell or stand aside on a particular stock.
- Wall Street Analysts Ratings and Forecasts
- 52 Week High and Low Boundaries
- Best-Case/Worst-Case Analysis
- Vantagepoint A.I. Forecast (Predictive Blue Line)
- Neural Network Forecast (Machine Learning)
- VantagePoint A.I. Daily Range Forecast
- Intermarket Analysis
- Our Suggestion
While we make all our decisions based upon the artificial intelligence forecasts, we do look at the fundamentals briefly, just to understand the financial landscape that $TSLA is operating in.
Wall Street Analysts Forecasts
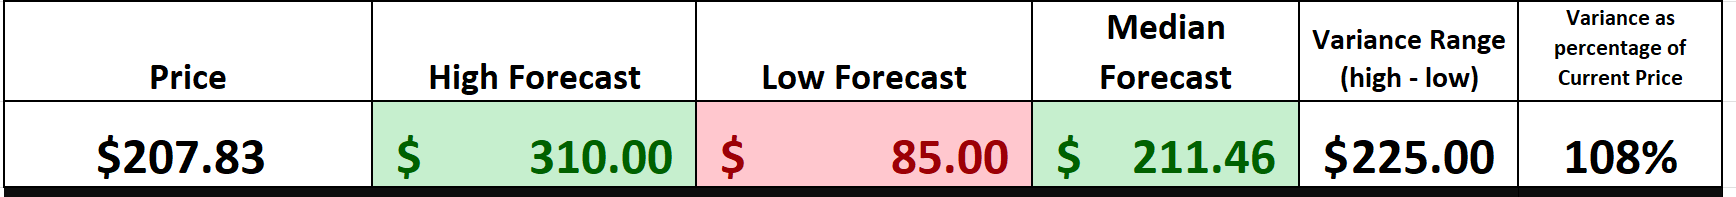
Alright, let’s dive into the latest from Wall Street on Tesla. We’ve got 31 top analysts weighing in over the past quarter, and they’re painting quite the picture for the electric vehicle giant. The consensus target? It’s pegged at $211.46. But hold onto your hats—some are shooting for the stars with predictions as high as $310.00. On the flip side, there are the naysayers, the ones who see things tumbling down to $85.00. Now, that’s a range to reckon with!
We advise traders to always pay attention to the variance between the most bullish and most bearish forecast as this is the source of volatility. You can quickly see in the graphic above that this variance is $225 which represents 108% of the current price. In other words, investors in $TSLA need to be prepared for some incredibly volatility if they plan to simply buy and hold.
Whether you’re bullish or bearish on Tesla, these figures are something to watch!
52 Week High and Low Boundaries
Over the past year, Tesla’s stock (TSLA) reached a 52-week high of $278.96 on September 15, 2023, and a 52-week low of $138.80 on April 22, 2024.
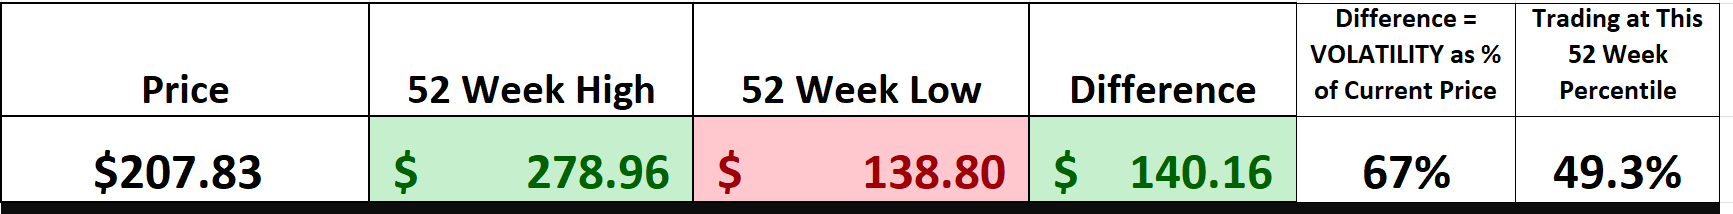
Let’s dive into the wild ride that has been Tesla stock ($TSLA) this past year. We’re talking about a high of $278.96 and a low of $138.80; that’s a whopping swing of $140.16. And with annual volatility sitting at 67%, it’s clear that swings of this magnitude are not off the table for Tesla in the year ahead.
Now, for the juicy part: Tesla is currently trading right in the middle of its game, at the 49th percentile of its 52-week range. Think of the 52-week range as a kind of report card—it shows us the momentum and growth Tesla has achieved over the past year. It’s also a window into how the stock behaves at these critical junctures.
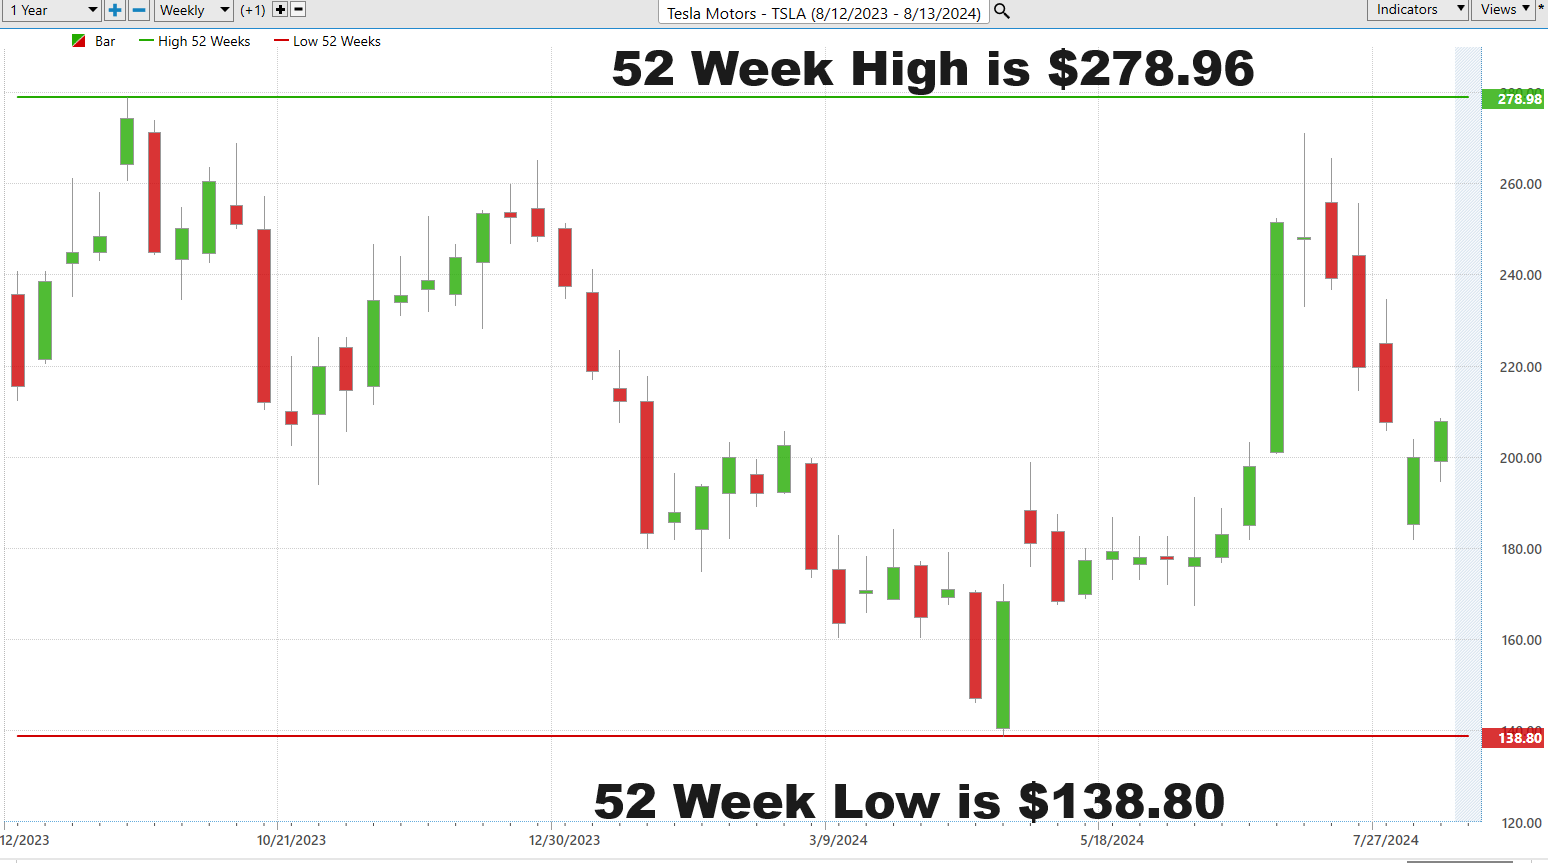
A broader view, like a 10-year chart, puts the last year into perspective against Tesla’s longer journey.
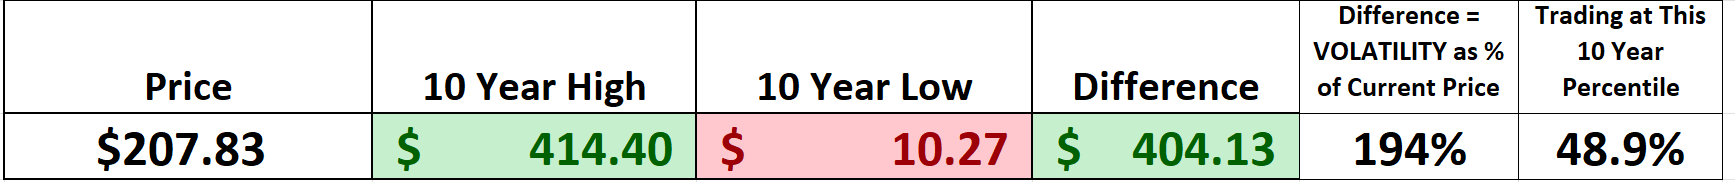
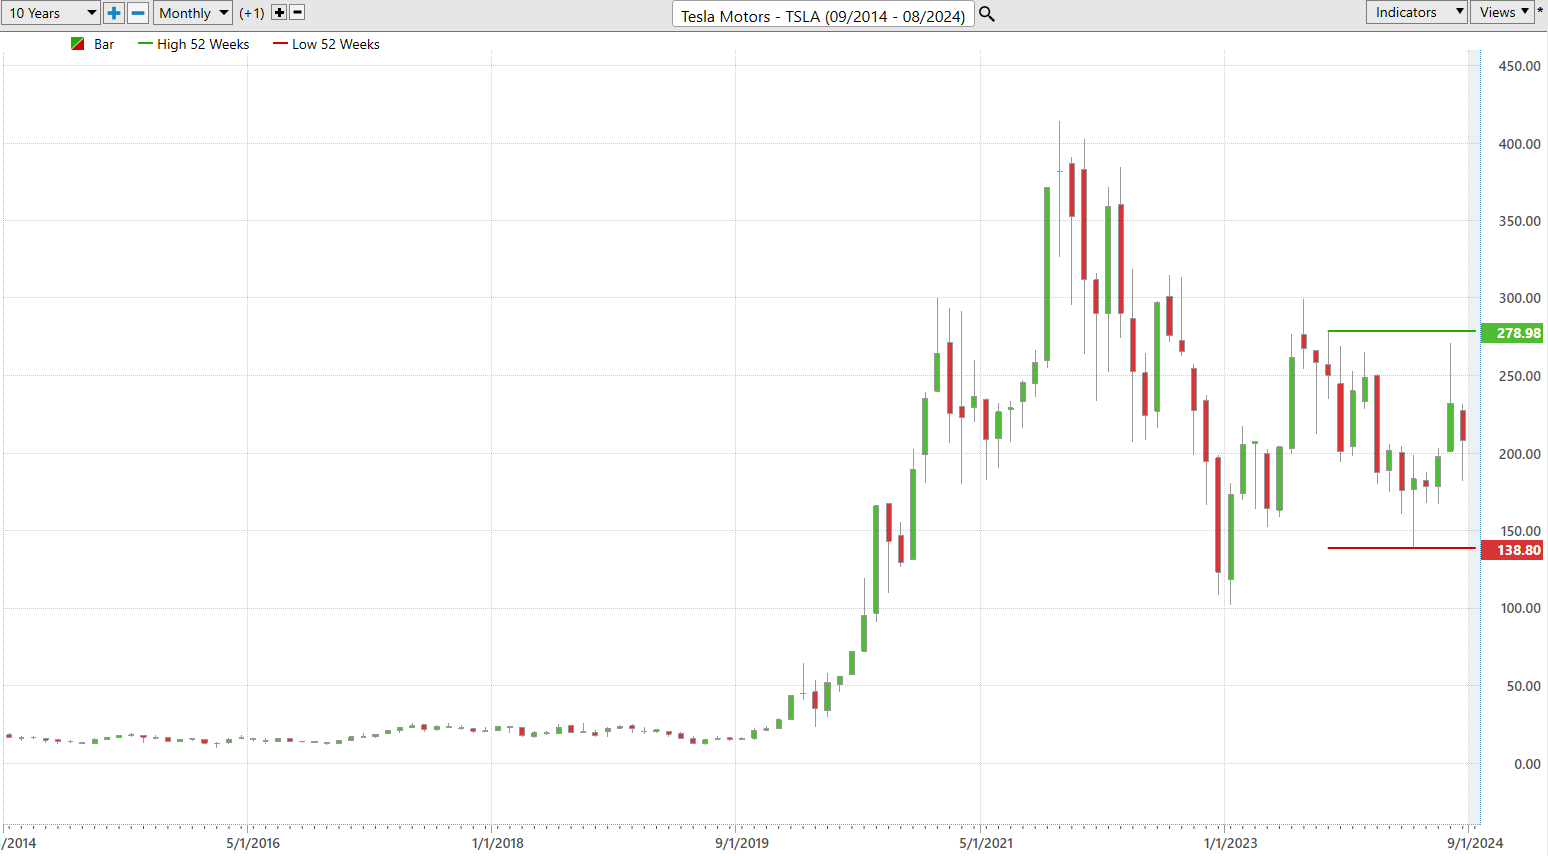
Astute Tesla followers will be aware that $TSLA is also trading below its 50 th percentile on the 10-year chart.
Supporters of Elon Musk are everywhere, and for good reason. They argue that Tesla shares hold substantial value, particularly when they are trading at a 50% discount from their 52-week high. Proponents point to Tesla’s leadership in electric vehicles and renewable energy as indicators of its potential for long-term dominance. Expansion into new markets and enhanced production capabilities also suggest strong growth prospects that could further boost its stock price.
On the flip side, there are reasons to be cautious. Intensifying competition from both established car manufacturers and new entrants in the EV market threatens to chip away at Tesla’s market share and compress its margins. Plus, persistent supply chain disruptions and looming regulatory hurdles could impede Tesla’s operational efficiency and financial outcomes, potentially weighing down its stock performance.
Best-Case/Worst-Case Analysis
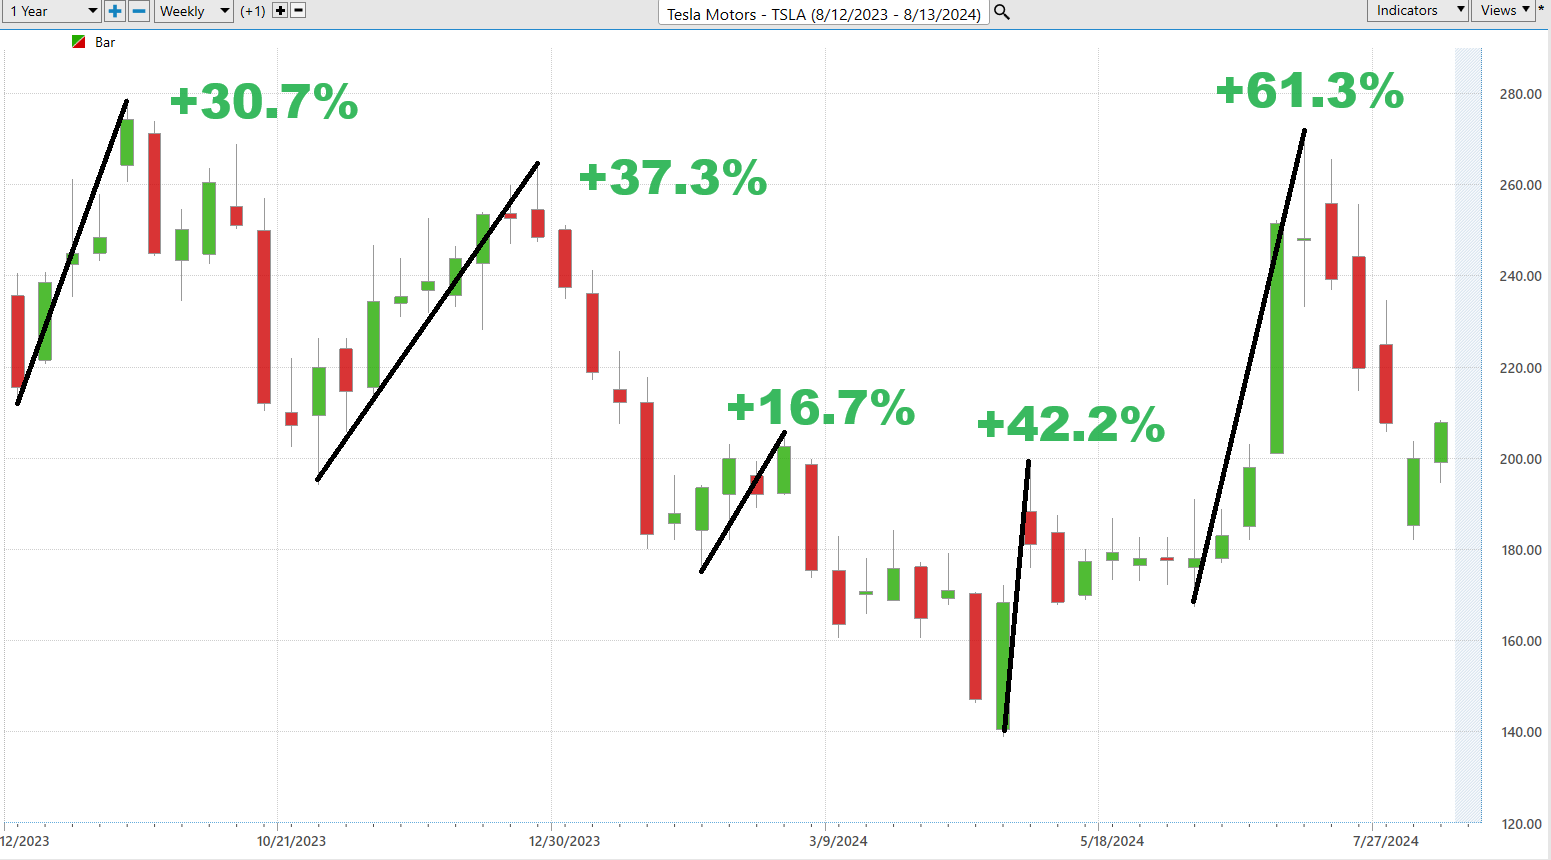
The most effective way for traders to understand volatility is to apply a best-case and worst-case analysis on a chart for the past year. The fastest way to understand risk is to simply look at compare the magnitude of the rallies against the severity of the declines. Then you will very clearly understand the price action and the risks involved in trading the asset you are studying.
So, don’t just give those charts a once-over; really get into the nitty-gritty. We’re talking about more than just tactics here; this is about crafting a robust strategy that empowers you to make well-informed decisions, handle your risks effectively, and construct an investment portfolio that’s ready to take on whatever the market throws at it.
Far too many traders dive headlong into the market’s churning waters, tragically unprepared and wildly overconfident, their eyes glazed with greed. Yet, there exists a simple but profound method to accurately assess both risk and reward: by analyzing the strength of rallies and the depth of declines over the previous year. By scrutinizing a stock’s price chart, one gains a tangible understanding of market volatility, with the sharp price fluctuations vividly illustrating how events and shifting investor moods can drastically alter market dynamics. This visual map of market movements not only educates but also starkly showcases the rhythmic highs and lows of stock prices, making the complexities of market behavior readily accessible. As traders our job is to simply measure the short-term rallies and balance them out against the severity of the declines. This is very simple to do and extremely practical and also balances reward against the inherent risk of being in the market.
Fist the best-case case scenario, which assumes that we bought the lows and sold the highs.
Next, we do the exact opposite in our worst-case analysis, and assume that we bought the highs and sold the lows. This allows us to quickly evaluate gains versus losses over the past year.
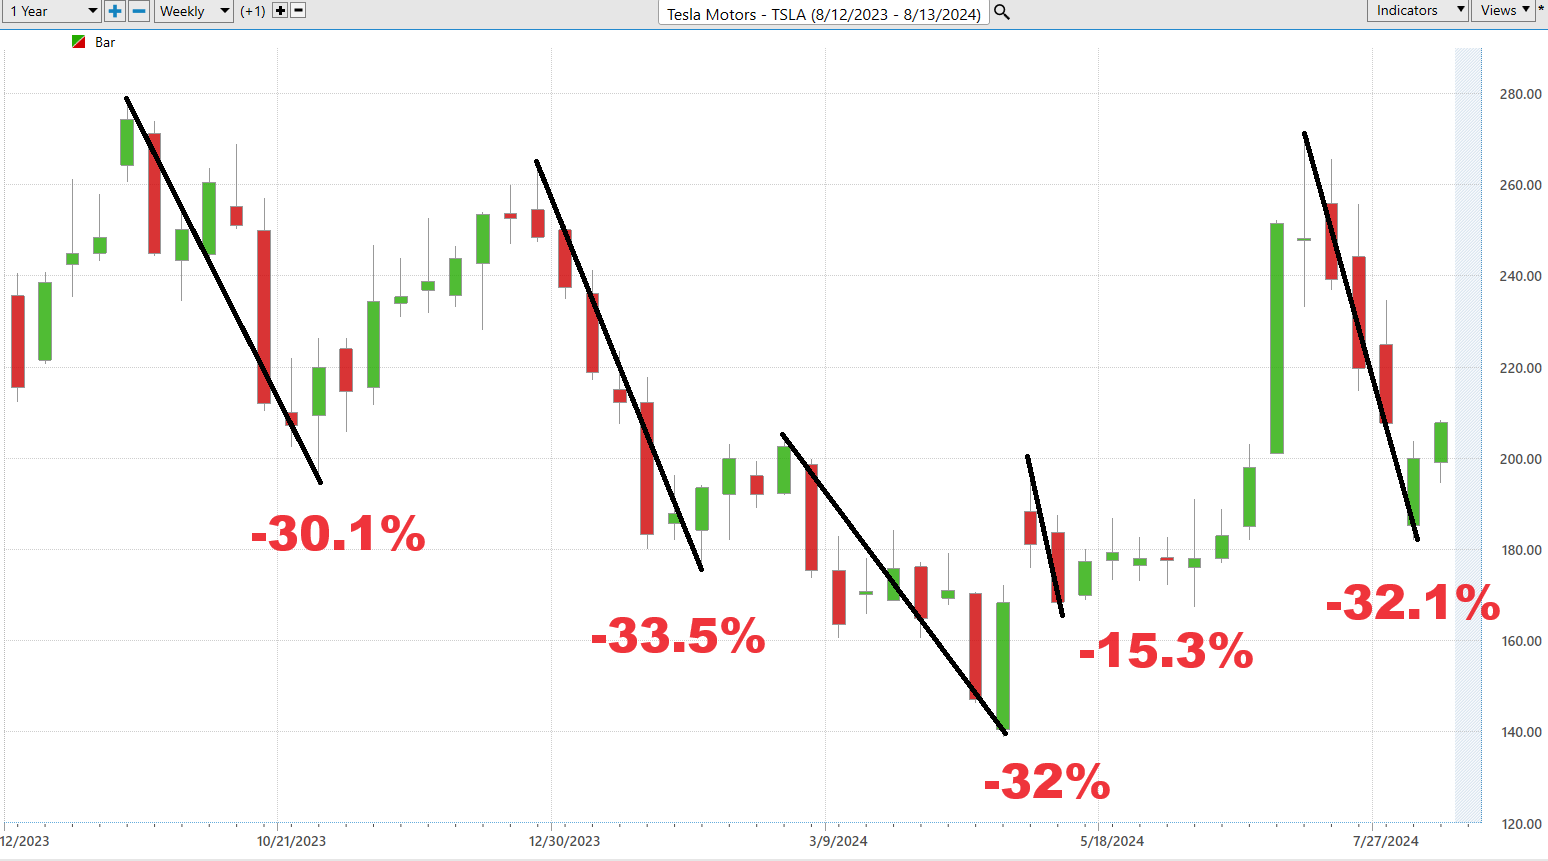
This exercise allows us to see the trajectory that $TSLA has had over the past year and how gains stacked up in comparison to the losses. We can also see how quickly they occurred. This is incredibly valuable and should not be overlooked.
Next, we compare $TSLA to broader stock market indexes to understand its correlations and performance. $TSLA is a component of the S&P 500, the NASDAQ, and the Dow Jones Industrials.
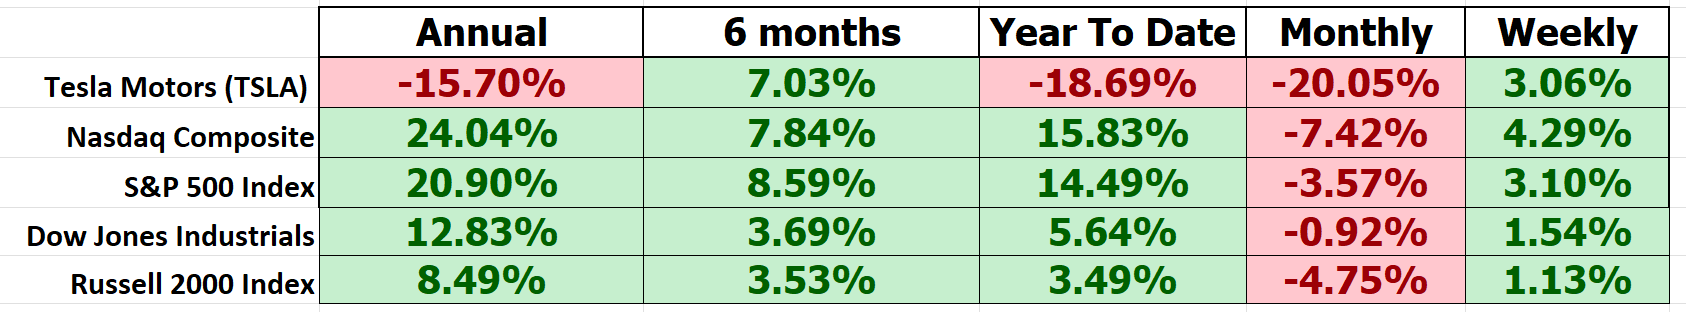
Clearly Tesla ($TSLA) has underperformed in a big, big way.
The beta value of Tesla ($TSLA) is 1.81. This measures how much the stock’s price movements are correlated with the movements of the overall market, usually measured against a benchmark index like the S&P 500. A beta of 1 means the stock’s price tends to move with the market; a beta greater than 1 indicates greater volatility than the market, and a beta less than 1 indicates less volatility than the market. Tesla is 81% more volatile than the broader market.
Vantagepoint A.I. Predictive Blue Line
In the high-stakes world of trading Tesla ($TSLA) stock, traders are arming themselves with some seriously sophisticated gear to predict market movements. Enter the “predictive blue line” from VantagePoint—a critical tool that’s become indispensable in the trader’s arsenal. This isn’t just any tool; it’s like having a crystal ball, thanks to its use of artificial intelligence to forecast where the market’s heading. If that blue line starts pointing up, it’s practically screaming at traders to buckle up for a rally and maybe start buying. And if it dips? Well, that’s a red flag waving, suggesting it might be time to pull back or hedge.
Surrounding this predictive blue line is what they call the ‘Value Zone,’ where savvy traders make their move, either buying or selling based on how the stock’s price dances around this line. This tool is more than a guide; it’s like a financial GPS, offering real-time insights powered by AI, crucial for navigating today’s fast-moving markets.
This is no ordinary line on a chart; it’s a powerhouse fueled by artificial intelligence and sophisticated intermarket analysis designed to predict market trends. Think of it as a compass in the uncharted wilderness of stock trading, showing you the way through the ups and downs of stocks like Tesla. When that line climbs, it’s your green light from the market—time to jump in. If it flattens, you’re in a holding pattern, waiting to see what happens next. And when it starts to fall? That’s your heads-up that a drop could be coming soon. This predictive blue line isn’t just a tool; it’s your secret weapon, silently calculating every move to map out your strategy. In trading, keeping up with the trend isn’t just good advice—it’s a rule. With the predictive blue line from VantagePoint, you’re not just following the trends; you’re staying ahead, guided by some of the most advanced tools in the business.
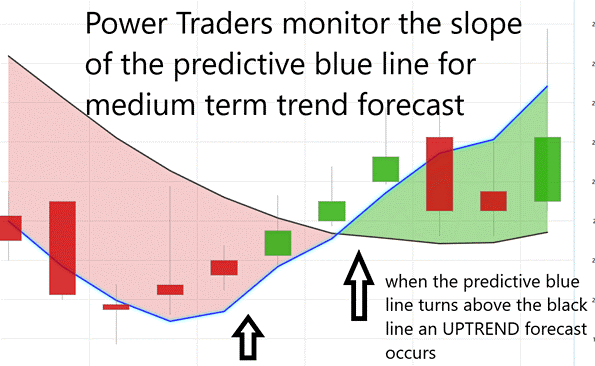
To give you an idea of the power and utility of the predictive blue line let’s look at it in the absence of prices just to observe the slope of predictive blue line and how that line interacts with the black line which is a 10-day simple moving average.
As you can see the predictive blue line determines the slope and the value zone. In an uptrend ideally traders want to buy at or below the blue line. In a downtrend, traders ideally want to sell at or above the blue line.
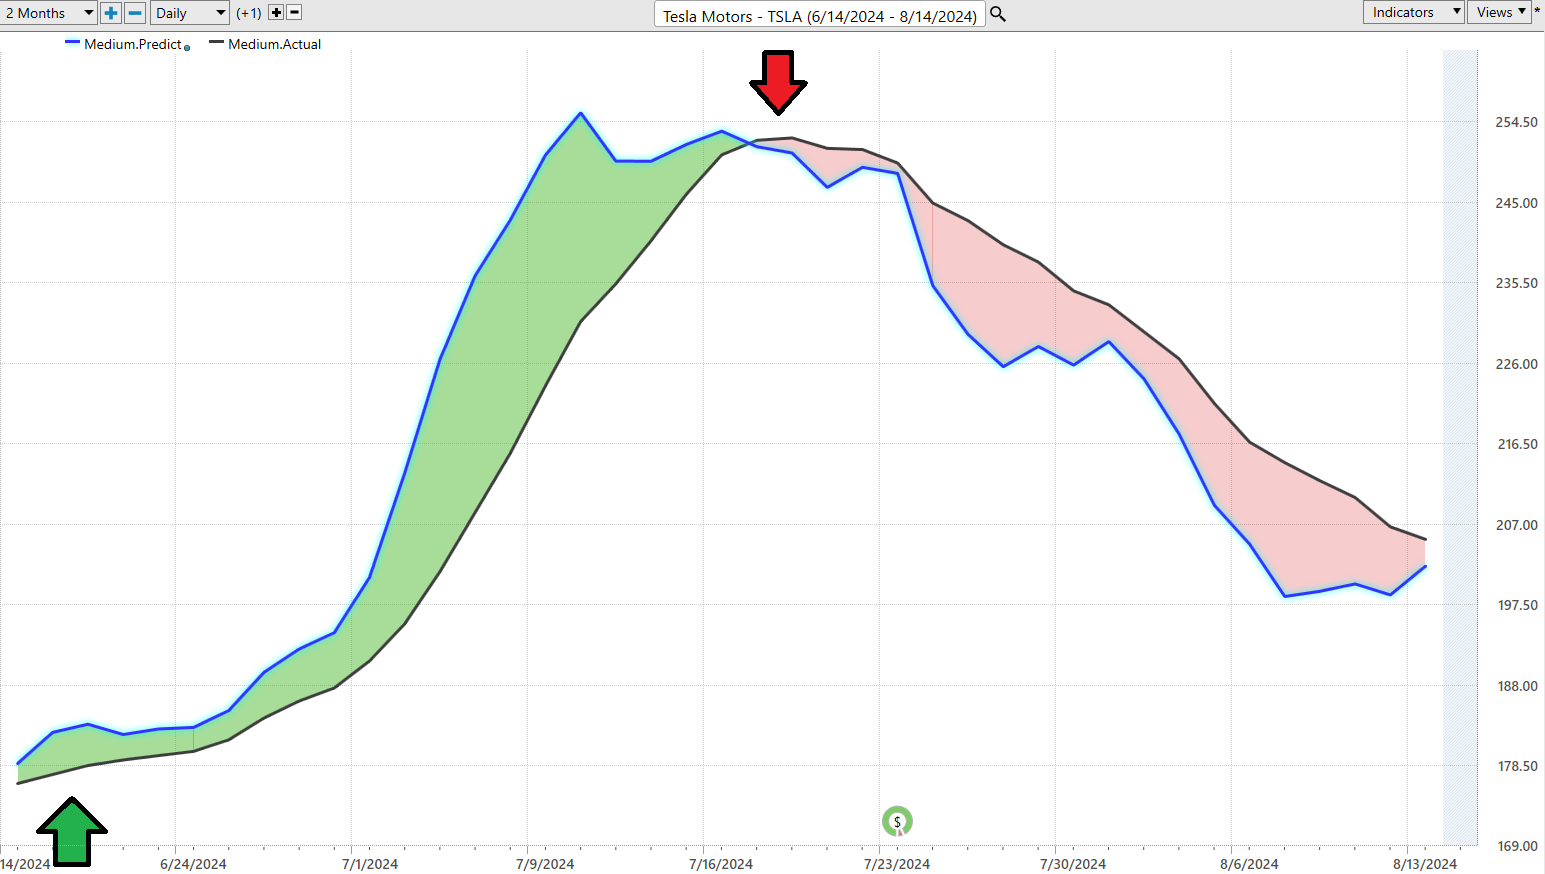
Now let’s add prices to see the historical price action and how brilliantly the artificial intelligence guided the trader through the volatility.
When you see not one, but two consecutive closes above that predictive blue line, think of it as the market giving you a nod, possibly signaling an uptrend is on the horizon. Conversely, if you spot those closes falling below the line back-to-back, consider it a warning—a downtrend may be brewing. This direct, no-frills method cuts through the often-bewildering complexities of market trends, enabling you to fine-tune your trading and investment strategies with remarkable precision. It’s all about getting in sync with the right trend at just the right time—it really is as straightforward as that.
Neural Network Forecast (Machine Learning)
A neural network in the world of trading is essentially artificial intelligence on steroids, mimicking the brain’s own neural pathways to chew through mountains of data at breakneck speed. Built from layers upon layers of nodes—think of them as mini-brains themselves—each one crunches the incoming data, performs calculations, and passes on its findings down the line. This digital brain is trained on historical market data, learning to spot patterns and predict future moves with an accuracy that gets sharper over time.
For traders, this is a game changer. Neural networks tackle vast and complex datasets with ease, spotting subtle market signals that might elude even the most seasoned traders. They’re not just crunching numbers; they’re forecasting trends, pinpointing buy and sell opportunities, and optimizing trade timings—all in real time. Armed with insights from every corner of the market—from fluctuating indicators to global economic events—traders can make decisions that are not just informed but laser-accurate.
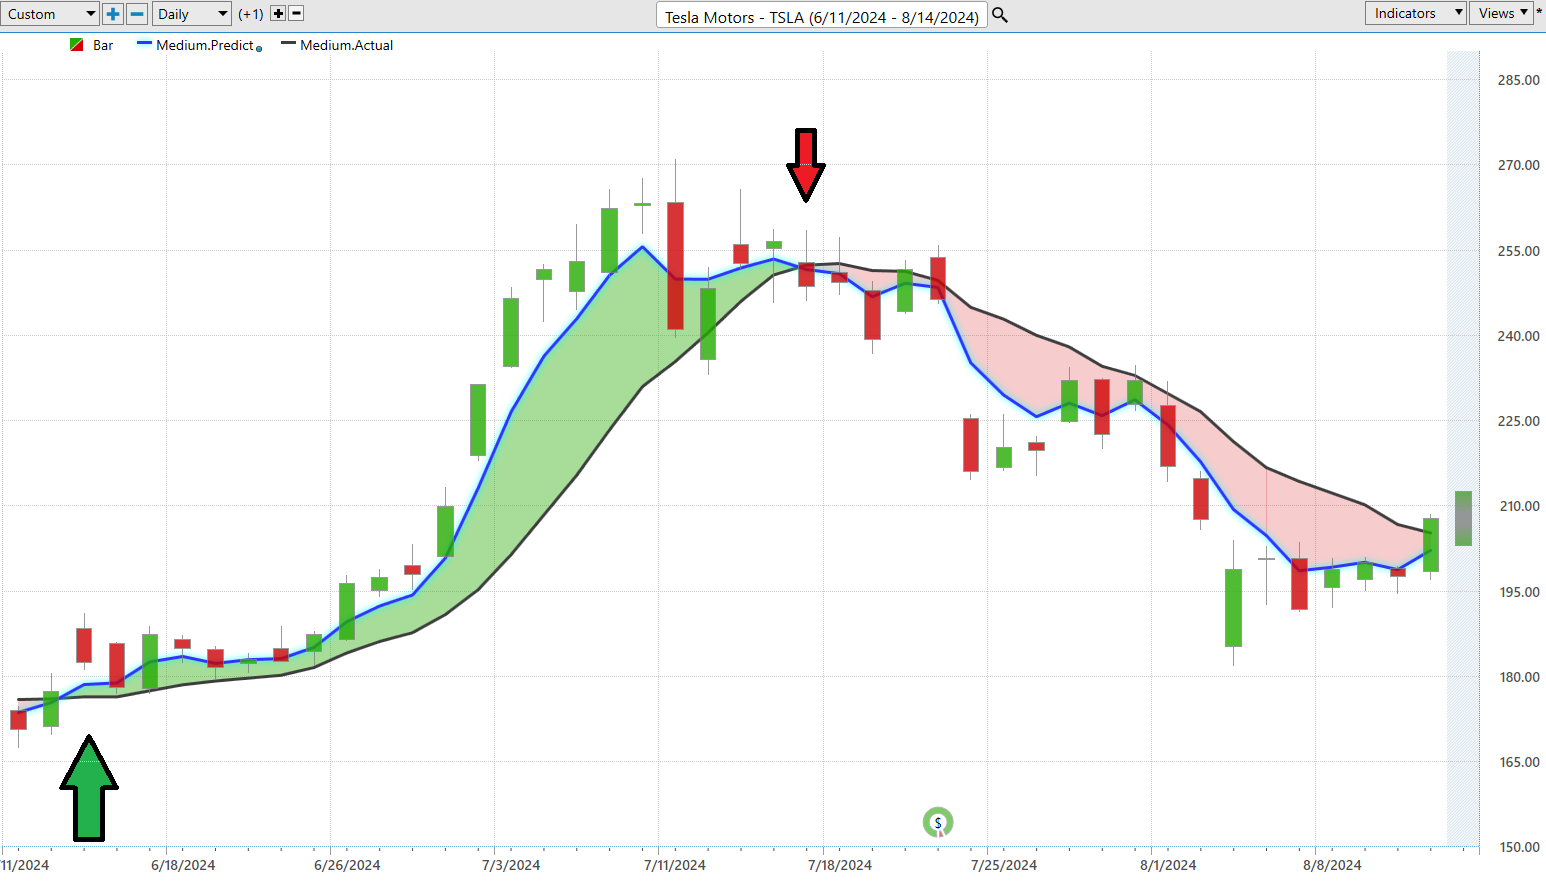
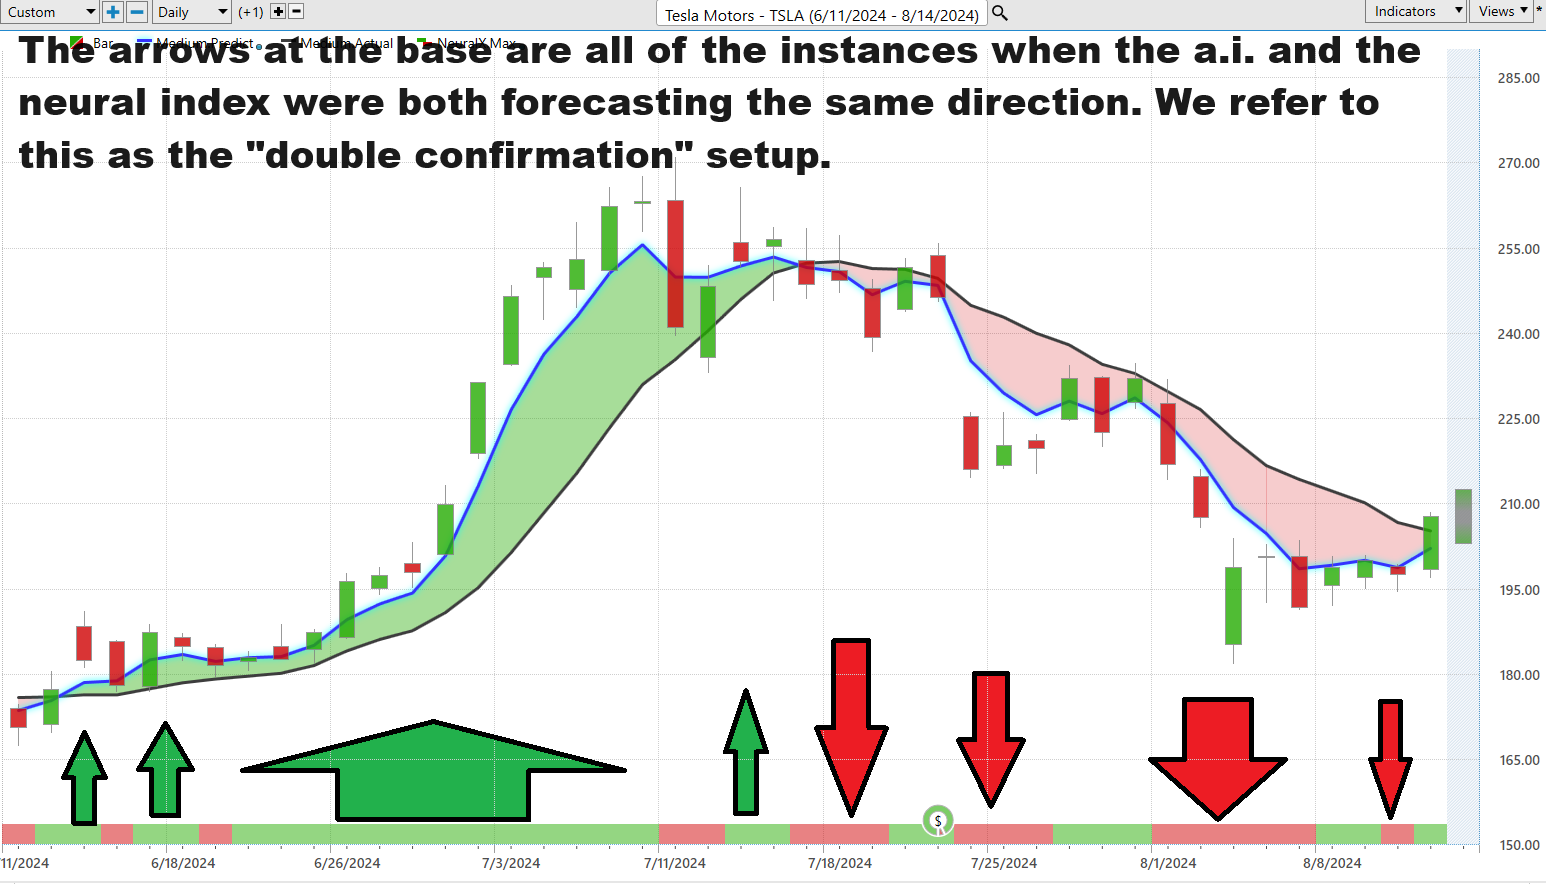
Check out the $TSLA chart with the Neural Index at the base. The arrows on the chart are all of the instances when the artificial intelligence and the neural index were both forecasting the same direction. We refer to these occurrences as the double confirmation setup which is a high probability trade.
Imagine deploying an ultra-intelligent, data-devouring brain at the heart of your trading strategy. This brain isn’t just smart; it’s a relentless learner, constantly refining its algorithms to offer sharper, more precise market predictions. It’s like having a supercharged co-pilot, one that’s always on, processing every piece of market data, from nuanced technical analyses to sweeping global events, and spitting out connections at speeds no human could match. Think about it: this A.I. might link a dip in oil prices to unexpected shifts in regional stock indices before anyone else even sees a blip.
Here’s the kicker for traders—the true test of mettle in this high-stakes arena is verification. The pros know to line up signals from that predictive blue line with insights from the Neural Network Indicator. When these two powerhouses align, it’s a green light for action, whether that’s buying on the uptick or selling before a downturn. This one-two punch of advanced A.I. and traditional trend tools isn’t just smart trading; it’s trading with a formidable edge.
As you study the chart above, you can easily observe that it looks like $TSLA has formed a short-term bottom and is attempting to rally. Power traders are paying close attention. As I have previously mentioned the predictive blue line is powerful guidance in trading $TSLA shares.
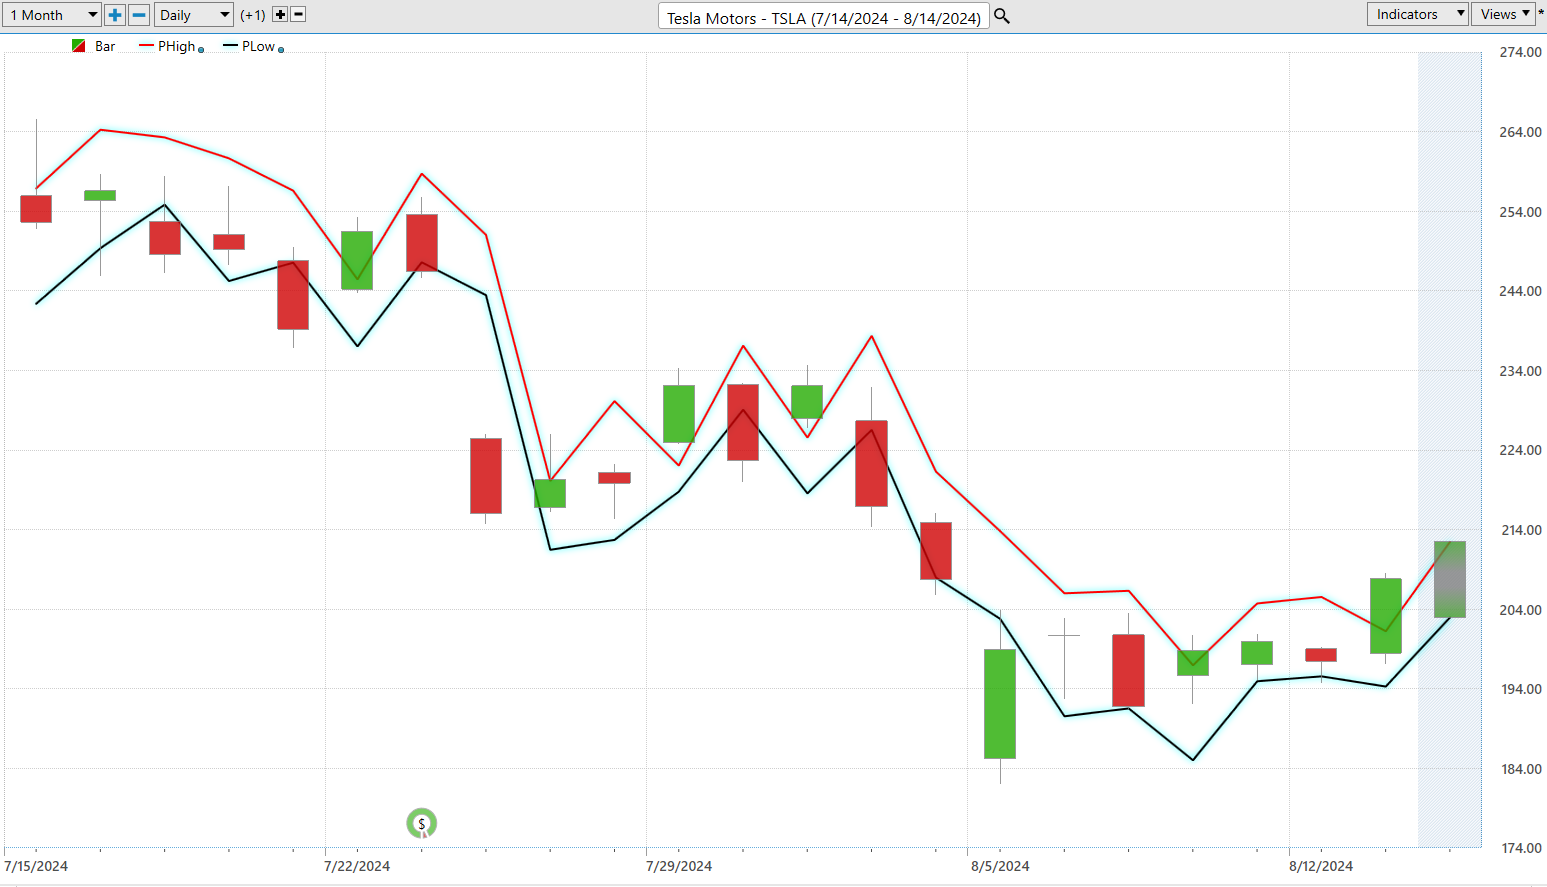
VantagePoint A.I. Daily Range Forecast
One of the paramount challenges traders face is nailing the timing of their entries and exits—a critical component in maximizing returns and minimizing risks. This is precisely where VantagePoint excels, offering daily predicted price levels that provide traders with unmatched navigational guidance.
Thanks to the formidable data-processing capabilities of artificial intelligence, coupled with advanced machine learning and comprehensive intermarket analysis, VantagePoint transforms market volatility from a threat into an opportunity. This software equips traders to make informed, strategic decisions seamlessly.
To illustrate the practical application, let’s consider the average daily, weekly, and monthly ranges for Tesla ($TSLA) over the past year, a clear demonstration of how sophisticated tools can enhance trading efficacy in real-world scenarios.
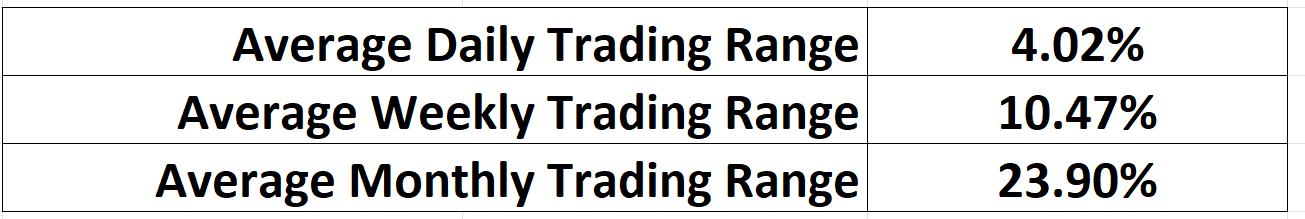
You can immediately understand the level of volatility that $TSLA exhibits when you see those metrics. The challenge though lies in learning to apply them. This is where the VantagePoint A.I. Daily Range forecast comes in and equips traders to anticipate what the next day’s high and low price are forecasted to be.
With this caliber of razor-sharp insight, traders can truly hone their skills, timing their market entries and exits with precision, and elevating their confidence to new heights. By leveraging advanced analytics, traders convert intricate market data into straightforward, actionable strategies—preparing them to seize opportunities for substantial growth, even amid the market’s most unpredictable twists. This level of precision, provided by predictive analytics, is nothing short of revolutionary for those ready to actively engage with market dynamics. It highlights the indispensable role of cutting-edge technological tools in today’s trading landscape.
Intermarket Analysis
Intermarket analysis is a method used in finance to evaluate the relationships between different sectors of the financial markets. This could include stocks, bonds, commodities, and currencies. The idea is to look for patterns and correlations between these markets to predict future movements. For instance, if the price of oil rises, it might affect companies in the energy sector, leading to changes in stock prices, or influence inflation, which can impact bond yields.
Intermarket analysis is crucial because it helps traders and investors see a bigger picture that they might miss by looking at a single market in isolation. Financial markets are interconnected, so a change in one area can ripple through others in ways that are not immediately obvious.
By understanding how different markets influence each other, investors can gain a deeper insight into the underlying forces driving market movements. For example, a rise in commodity prices like oil can indicate inflationary pressures, which might lead central banks to adjust interest rates, affecting bond and currency markets.
Intermarket analysis can be a valuable tool for managing risk. By recognizing the relationships between markets, traders can anticipate adverse movements in one market that might affect another and adjust their portfolios to mitigate potential losses. For example, if bond yields are rising (indicating falling bond prices), it could be a sign of declining demand for safer assets, which might suggest a favorable environment for stocks.
With a clearer understanding of market relationships, traders can make more strategic decisions about when to buy or sell different assets. For instance, if the dollar is strengthening, it might be a good time to look at international stocks that could benefit from a stronger U.S. currency.
Intermarket analysis can help identify broader market trends that are developing. If commodities, stocks, and bond yields are all rising, it might suggest a bullish sentiment across multiple markets, indicating a strong economic outlook.
In summary, intermarket analysis gives traders and investors a comprehensive toolkit for navigating the complex web of global financial markets, enhancing decision-making processes, and potentially leading to better trading outcomes. This holistic approach is essential in a globalized economy where different markets are more interconnected than ever before.
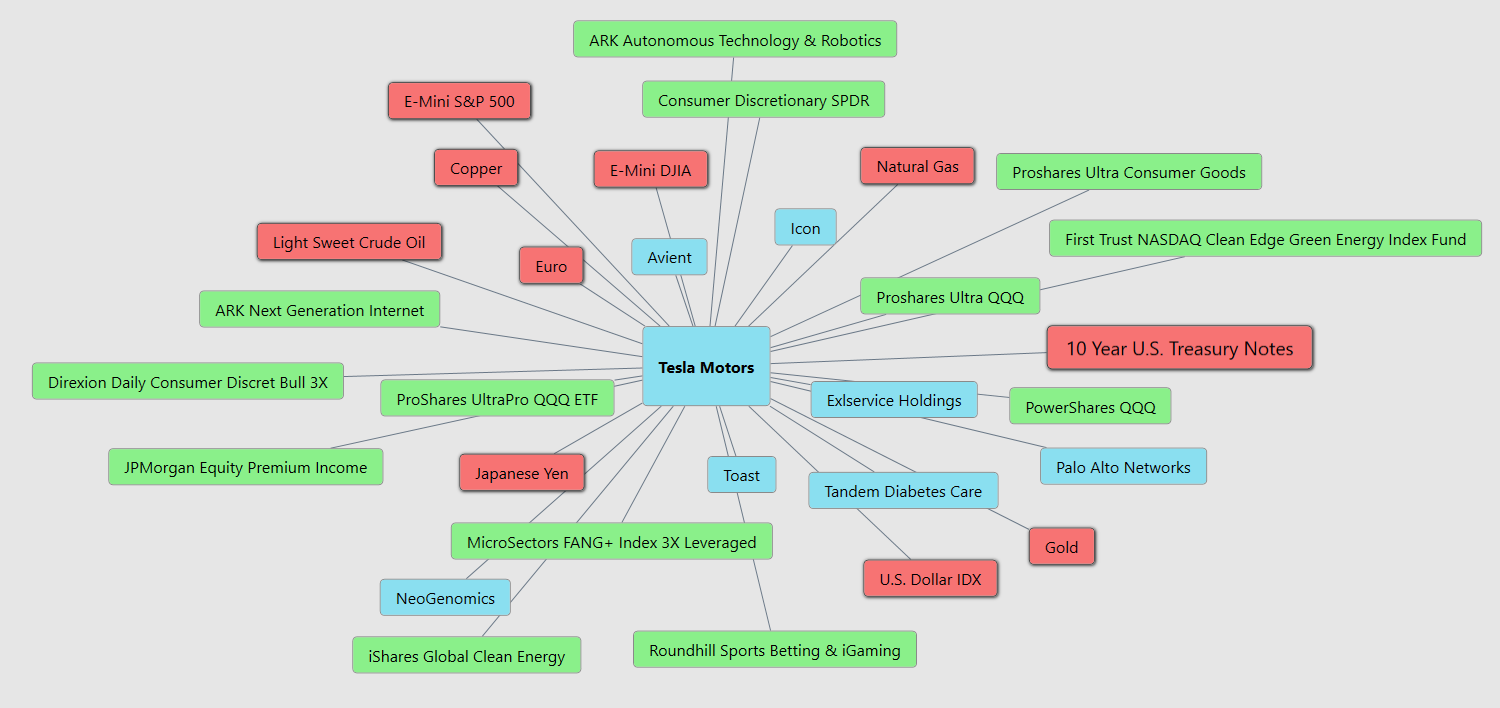
Here are the 31 primary drivers of $TSLA price action. When studying these assets, you will often find hidden gems with explosive potential as well.
Our Suggestion
Elon Musk has made a lot of traders very wealthy. It is very hard to bet against him. We highly recommend that you place $TSLA on your trading radar and follow the ai guidance moving forward. Tesla shares are incredibly volatile, so position sizing is vital.
In Tesla’s Q2 2024 earnings call, the company faced both challenges and successes. While it missed earnings expectations, earning $0.52 per share against a forecast of $0.61, it surpassed revenue projections, posting $25.5 billion, thanks to significant contributions from its energy division. Notably, Tesla’s Energy Storage business experienced record revenues and deployments. Additionally, Tesla plans to unveil its Robotaxi technology on October 10, 2024, hinting at major advancements in its full self-driving capabilities. Wall Street will need to see strong earnings and revenue increases for Tesla shares to demonstrate that they are overcoming the challenges of their business model.
Wall Street analysts are buzzing about the first mover advantage that Tesla would have if they successfully completed Fully Self Driving (FSD) vehicles. This technology is vital to fulfilling Tesla’s desire to have the first fully autonomous Robotaxi fleet in the world. The potential is massive. The risks are high. The initial results from FSD testing have been fraught with problems which you would expect with any new technology.
Elon Musk has been trumpeting the enormous profit potential of AI technologies, especially when it comes to the company’s grand plan to roll out self-driving software across its nearly 7 million-strong global fleet of electric vehicles. He’s signaling that, due to this ambitious push, he’s looking at capital spending skyrocketing to about $10 billion this year.
The next Tesla earnings call is Wednesday October 16, 2024.
Recent figures reveal that insiders at Tesla, Inc. hold a substantial stake in the company, owning $82 billion worth of shares in a corporation valued at $631 billion. That’s not just a token amount; it’s a significant chunk, and it’s encouraging to see insiders with that level of skin in the game.
Meanwhile, the general public, which includes everyday retail investors, controls a 43% stake in Tesla. They may not have the final say, but their considerable shareholding ensures that their voice is significant and influential in the company’s operations.
We continue to monitor the stock closely. While Tesla is extremely volatile, we will continue to rely on the A.I. for trade guidance.
Practice good money management on all your trades.
Let’s Be careful Out There!
It’s Not Magic.
It’s Machine Learning.
Disclaimer: THERE IS A HIGH DEGREE OF RISK INVOLVED IN TRADING. IT IS NOT PRUDENT OR ADVISABLE TO MAKE TRADING DECISIONS THAT ARE BEYOND YOUR FINANCIAL MEANS OR INVOLVE TRADING CAPITAL THAT YOU ARE NOT WILLING AND CAPABLE OF LOSING.
VANTAGEPOINT’S MARKETING CAMPAIGNS, OF ANY KIND, DO NOT CONSTITUTE TRADING ADVICE OR AN ENDORSEMENT OR RECOMMENDATION BY VANTAGEPOINT AI OR ANY ASSOCIATED AFFILIATES OF ANY TRADING METHODS, PROGRAMS, SYSTEMS OR ROUTINES. VANTAGEPOINT’S PERSONNEL ARE NOT LICENSED BROKERS OR ADVISORS AND DO NOT OFFER TRADING ADVICE.