GOLD PRICE OUTLOOK
- Gold prices haven’t gone anywhere in recent days, though they are down more than 2% this year
- U.S. Core PCE data on Friday will likely guide the precious metal’s near-term outlook
- This article looks at XAU/ USD ’s key technical levels worth watching over the coming days
Gold prices (XAU/USD) inched higher on Thursday, supported by falling yields, which ticked down across the curve despite stronger-than-expected U.S. gross domestic product data.
Considering recent moves, bullion has lost more than 2% this year, but it has lacked directional conviction over the past few trading sessions. Volatility, however, could pick up heading into the weekend, with U.S. core PCE from December on tap Friday morning ahead of the FOMC announcement next week.
In terms of estimates, the Fed’s favorite inflation gauge is seen rising 0.2% m-o-m, bringing the year-over-year rate to 3.0% from 3.2% previously - a welcome development for policymakers.
UPCOMING US ECONOMIC DATA
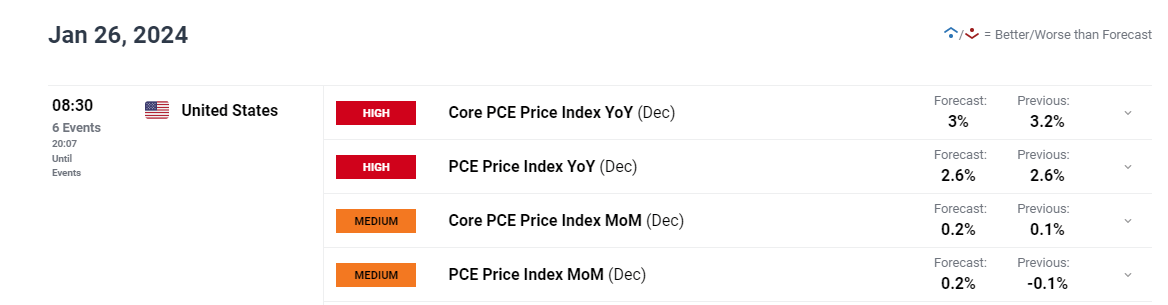
With the U.S. economy still firing on all cylinders, as reflected by recent GDP and labor market data, traders should pay close attention to the inflation path. If only immaterial progress is seen in the disinflation trend, markets are likely to unwind overly dovish bets on the Fed’s policy path, a situation that could push yields higher and hurt precious metals.
On the other hand, if price pressures remain in a downward trajectory, the Fed will have fewer obstacles to begin removing policy restriction, placing a March rate cut fully back on the table even if economic activity continues to perform well. Any core PCI annual reading below the 3.0% threshold should have this effect on markets.
GOLD PRICE TECHNICAL ANALYSIS
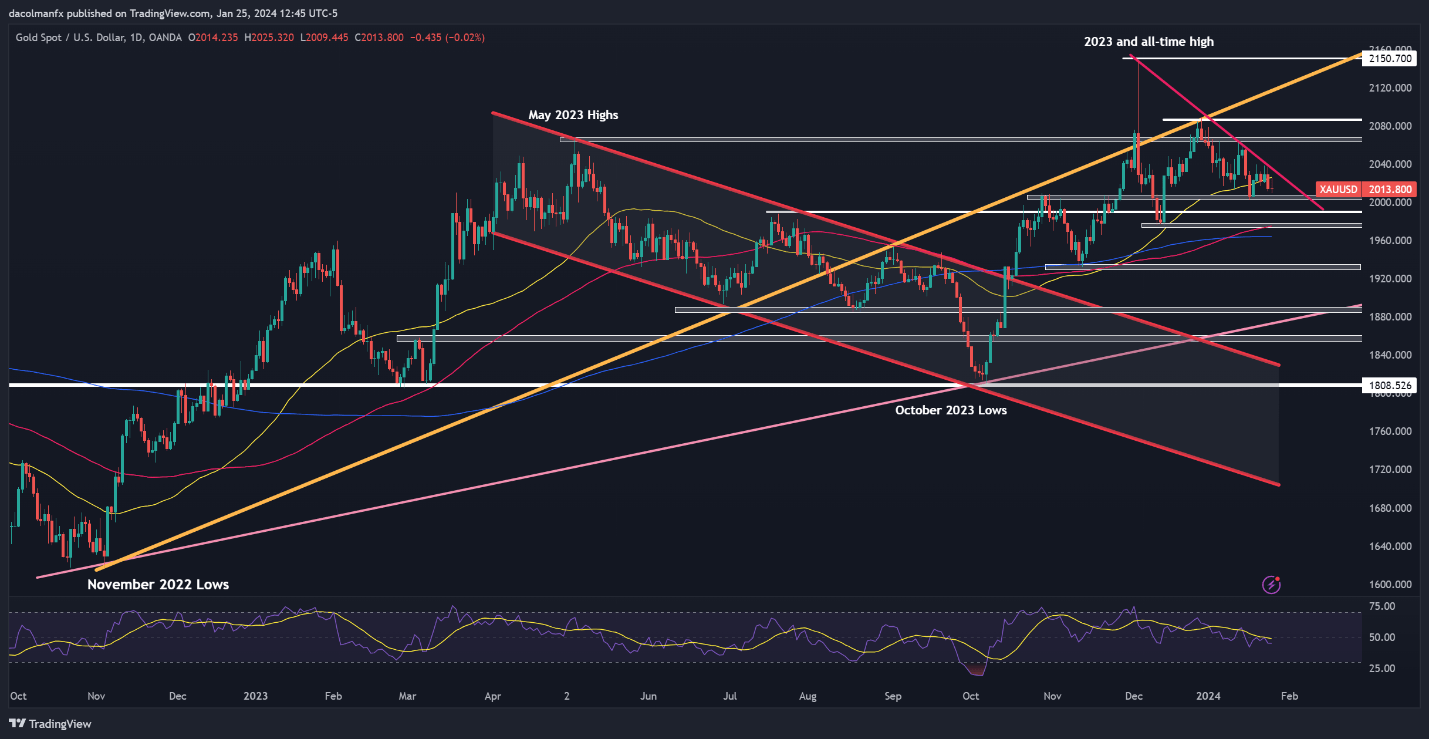
After falling to multi-week lows last week, gold has stabilized in recent days, although it hasn't really gone anywhere, with prices wedged inside trendline resistance at $2,030 and horizontal support at $2,005. Breaking beyond these technical levels is crucial for large directional moves to unfold, otherwise consolidation becomes the most likely scenario.
Focusing on possible outcomes, a bullish breakout could send XAU/USD towards $2,065. On further strength, all eyes will be on $2,080. In the event of a bearish breakdown, the next line of defense against a pullback appears at $1,990, followed by $1,975, around the 100-day simple moving average. Additional losses from this point onward could draw attention to the 200-day simple moving average.
GOLD PRICE TECHNICAL CHART