Gold and Silver Analysis, Prices, and Charts
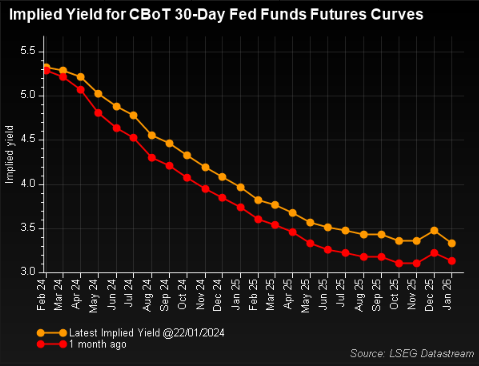
- The latest Fed rate expectations show six quarter-point cuts this year.
- Gold and Silver struggle but the sell-off is so far contained.
The latest look at US rate expectations shows six quarter-point cuts are now being priced in with the first seen in May compared to seven last week with the first in March.
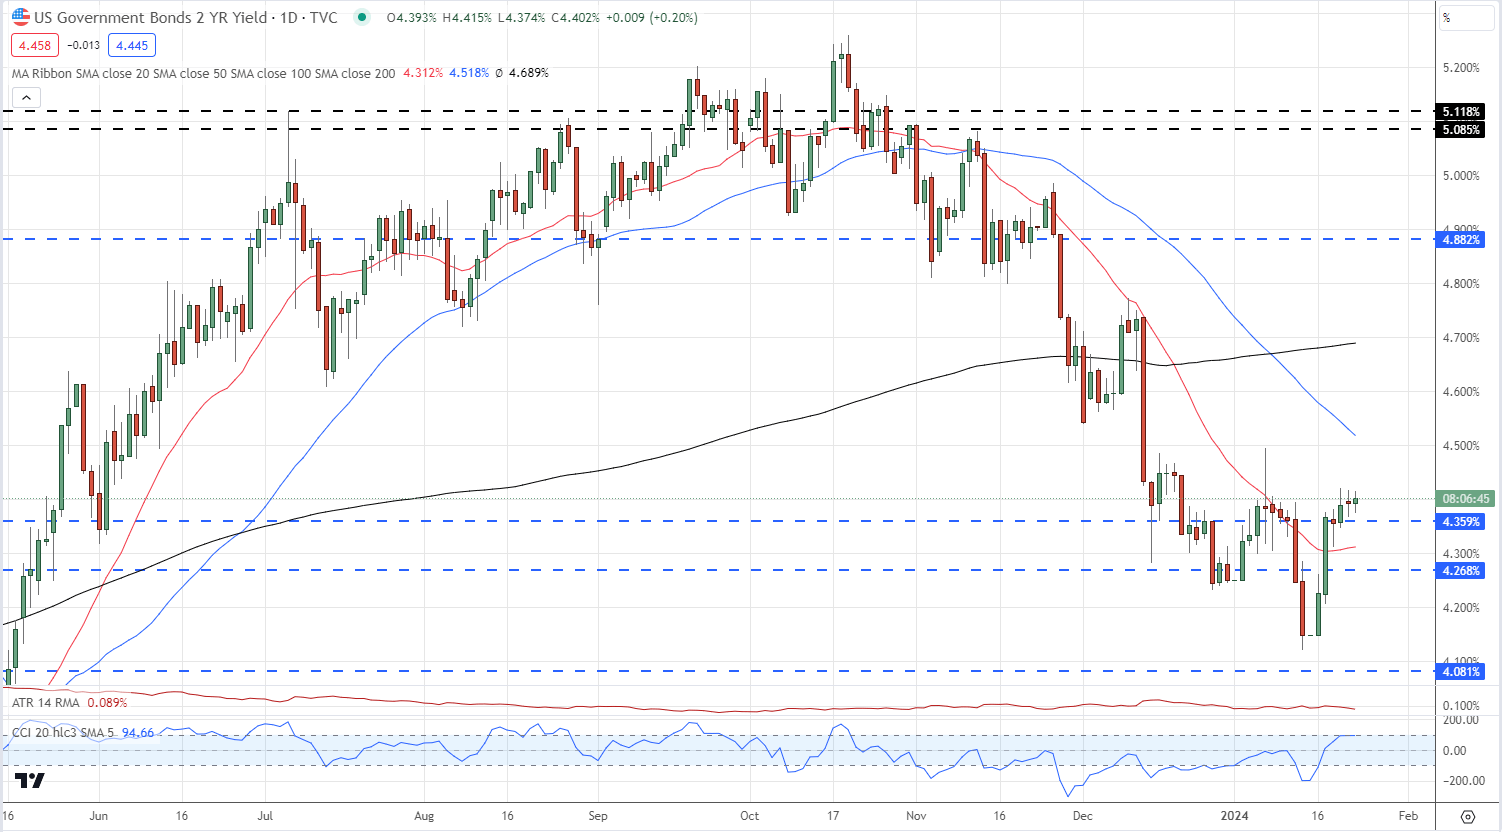
The yield on the rate-sensitive UST 2-year has risen from 4.14% to a current level of 4.40% over the same period, highlighting the tempering of rate cuts ahead of next week’s FOMC meeting.
UST 2-Year Daily Yield Chart
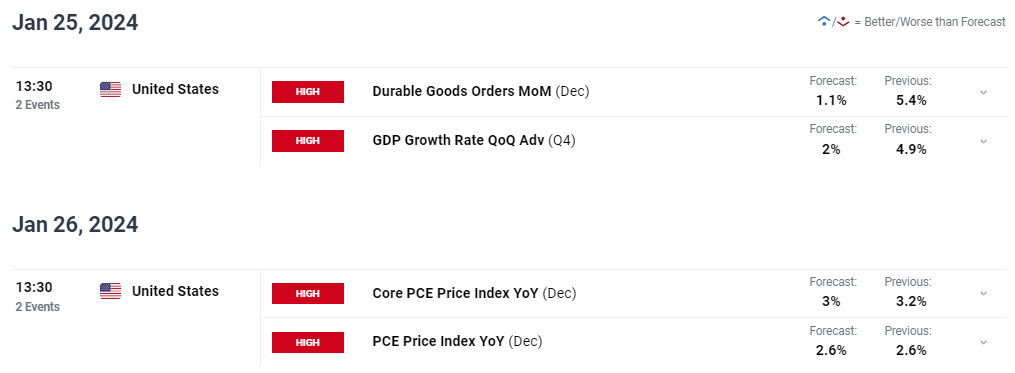
There are three heavyweight pieces of US economic data released this week, the first look at US Q4 GDP on Thursday, along with the latest Durable Goods release, and the Core PCE report on Friday. All of these will be closely watched by the Fed ahead of next week’s FOMC meeting.
For all economic data releases and events see the
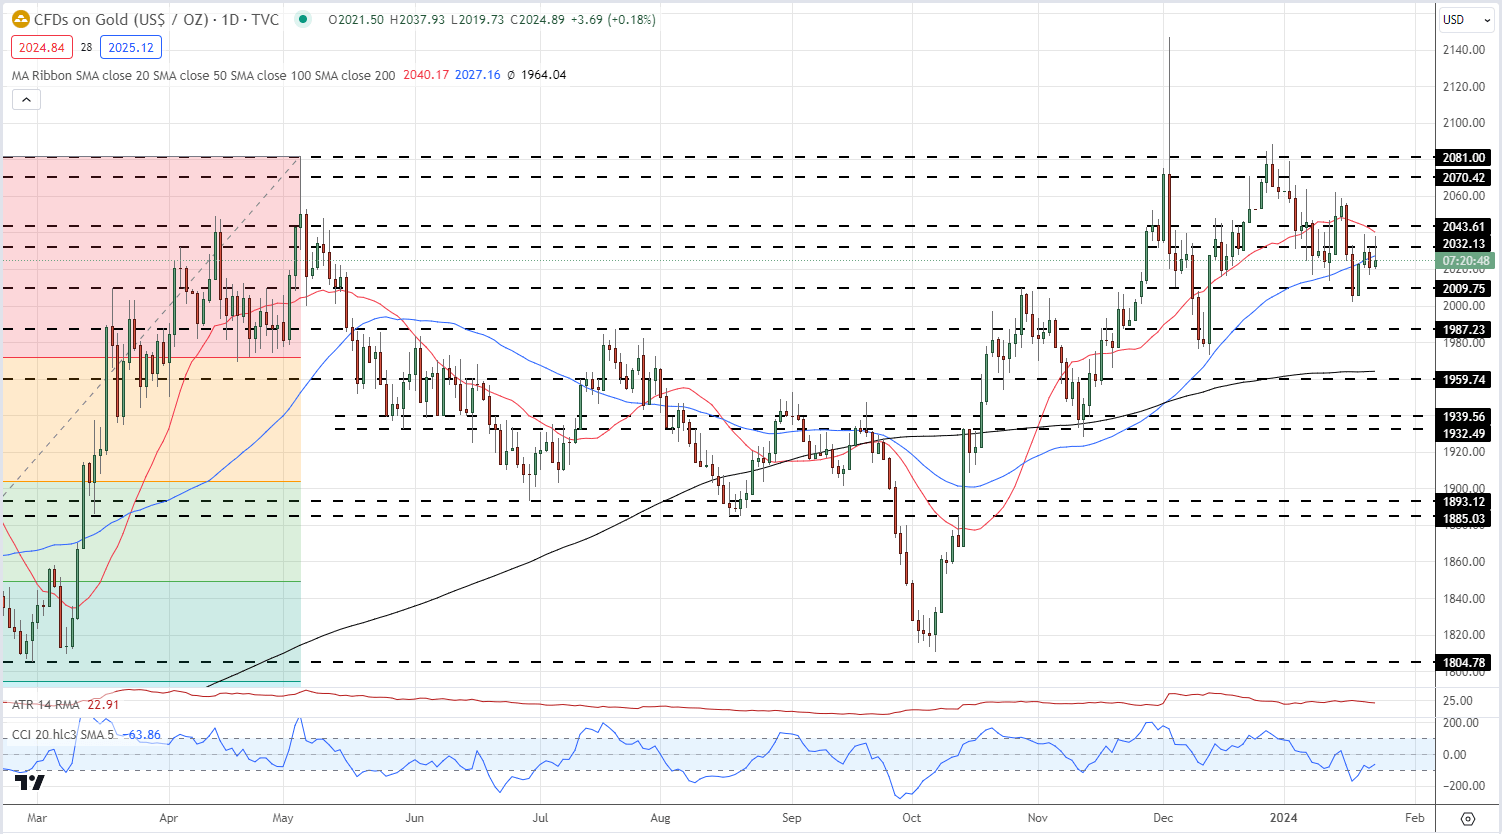
Gold is currently stuck in a rough $2,000/oz. - $2,040/oz. trading range and is likely to remain there ahead of the data releases. A series of higher lows continue to support the precious metal, while current price action on either side of the 20- and 50-day simple moving averages is clouding the issue at the current time. A break lower brings prior support at $1,987/oz. into play.
Gold Daily Price Chart
Retail trader data show59.13% of traders are net-long with the ratio of traders long to short at 1.45 to 1.The number of traders net long is 7.39% lower than yesterday and 3.25% lower than last week, while the number of traders net short is 2.08% lower than yesterday and 5.86% lower than last week.
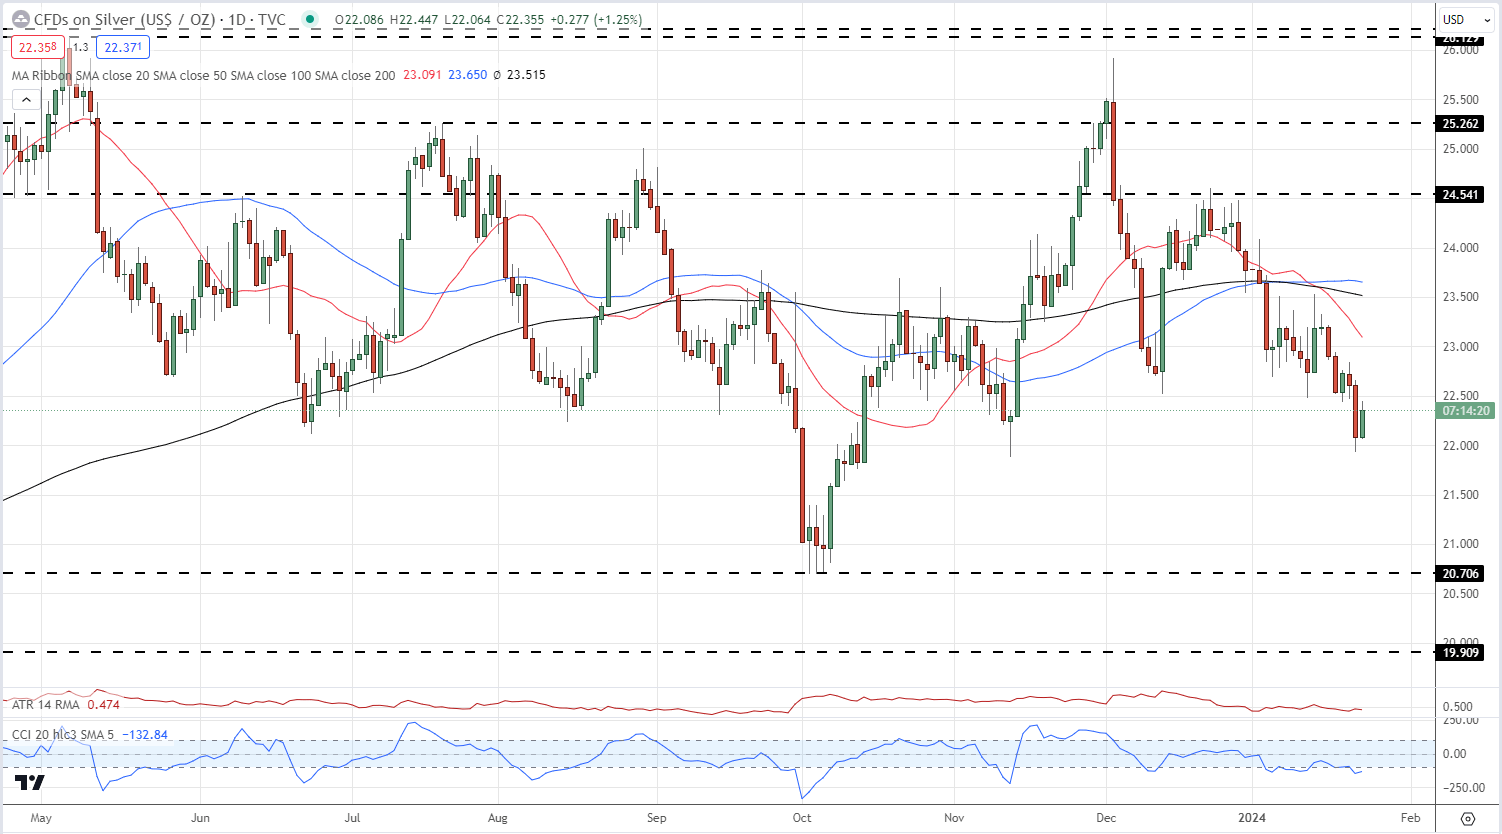
Silver is pushing higher today after a multi-week sell-off from late December. Silver fell below $22/oz. briefly on Monday, printing a fresh multi-week nadir before recovering today to trade around 1.1% higher on the session. The silver chart remains weak, printing short-term lower highs and lows, while the CCI indicator shows the precious metal in oversold territory. The cluster of lows made in early October around $20.71 may still be under threat.
Silver Price Daily Chart