Bitcoin Technical Outlook
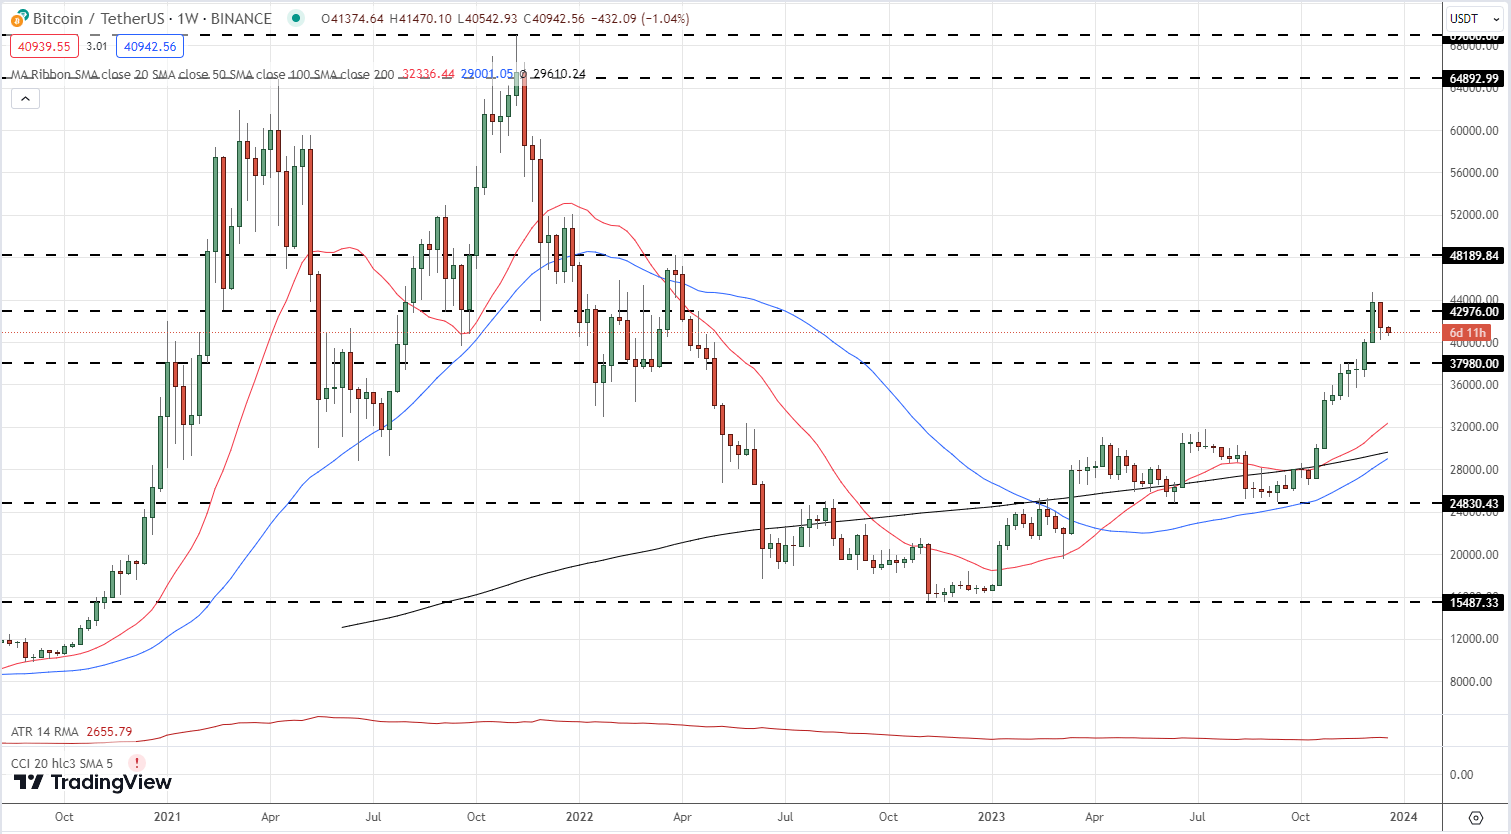
Bitcoin had a strong performance this year, rallying from an opening level of around $16.6k to a recent high of $44.7k with little in the way of notable pullbacks along the way. The strong bottoming-out pattern between November 2022 and January 2023 prompted a wave of higher lows and higher highs throughout the year, culminating in an 80% rally between early September and early December. The next target on the weekly chart is just above $48k, the end of March swing high. The current strength of Bitcoin can be seen in the three simple moving averages which are currently situated between $29k and $32.3k. The 50-day SMA is also looking to create a golden cross by breaking above the 200-dsma. Weekly support at $40k and just below $38k.
Bitcoin Weekly Price Chart
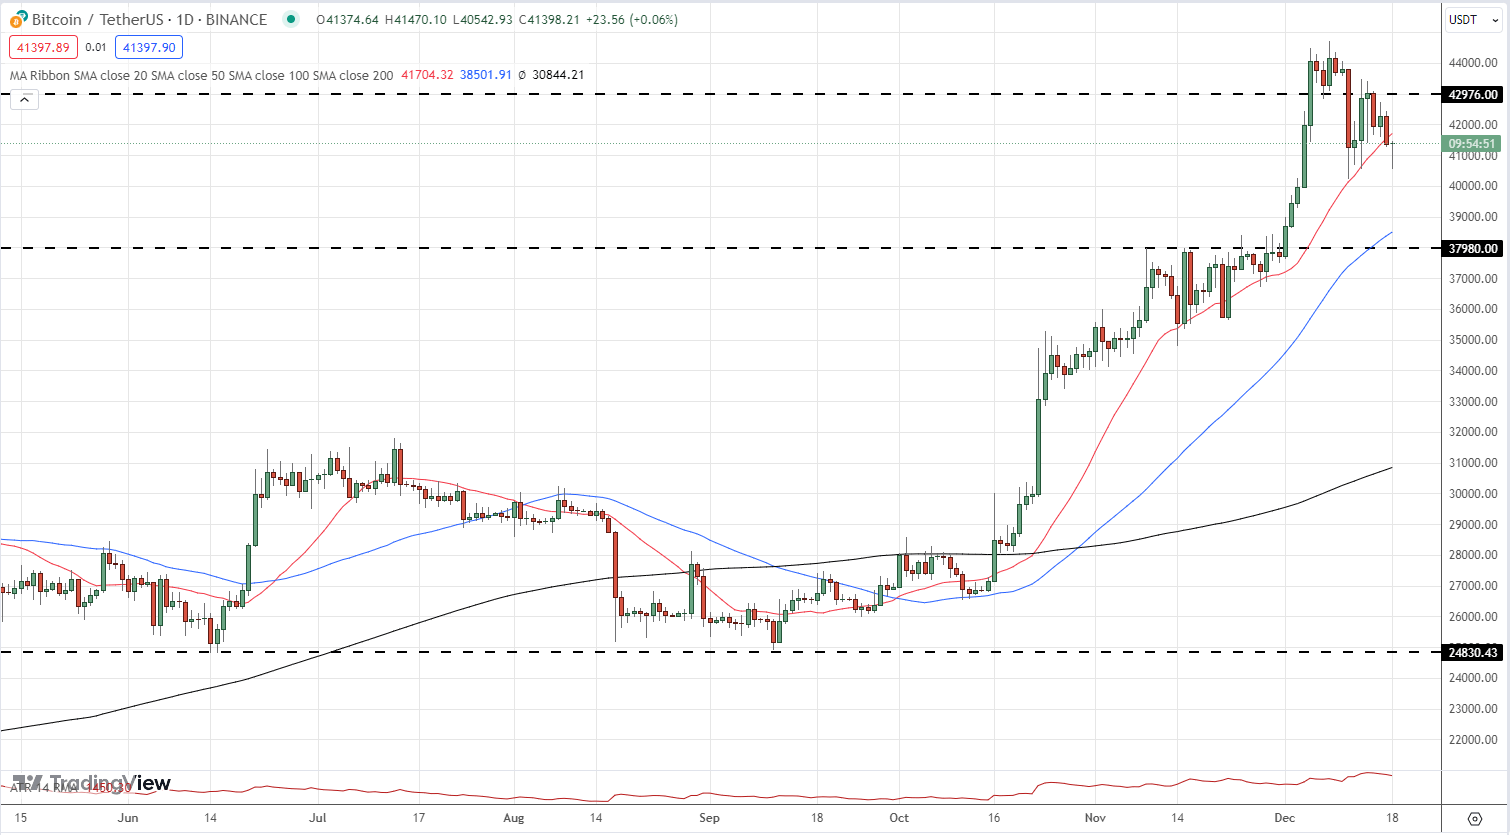
The daily Bitcoin chart remains positive although a short-term pullback cannot be discounted. The 50-/200-dsma produced a golden cross on October 29th ($34.5k) and this allowed BTC to rally to a multi-month high of $44.7k on December 8th. The chart shows a series of higher lows and higher highs since mid-September and a break below $38k would be needed to negate this and turn the chart neutral. The 20-dsma has acted as support during the recent rally but is now being tested. A confirmed break below here could see Bitcoin trade down to horizontal support a fraction below $38k.
Bitcoin Daily Price Chart