GOLD OUTLOOK & ANALYSIS
- War between Israel and Hamas ramps up, gold bid.
- Light economic calendar will see risk sentiment drive market volatility.
- Bearish technical signals could see gold head back down towards $2000.
XAU/USD FUNDAMENTAL FORECAST
Gold prices recorded news all-time highs at market open due to escalating geopolitical tensions as Israel and Hamas resume fighting after the ceasefire ended last week. The safe haven allure of the yellow metal supported this move but has since pulled back below the mark once again; this despite a stronger US dollar . An update from my weekly gold forecast shows a similar implied Fed funds futures path with pricing showing roughly of cumulative interest rate cuts by December 2024.
IMPLIED FED FUNDS FUTURES
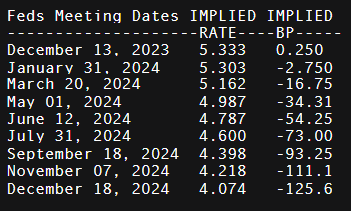
Source: Refinitiv
US real yields (see below) is trading higher following US Treasury yields. Technically, this makes limits gold’s attractiveness due to increasing opportunity cost but for now safe haven demand is the dominating variable.
US 10-YEAR REAL YIELD
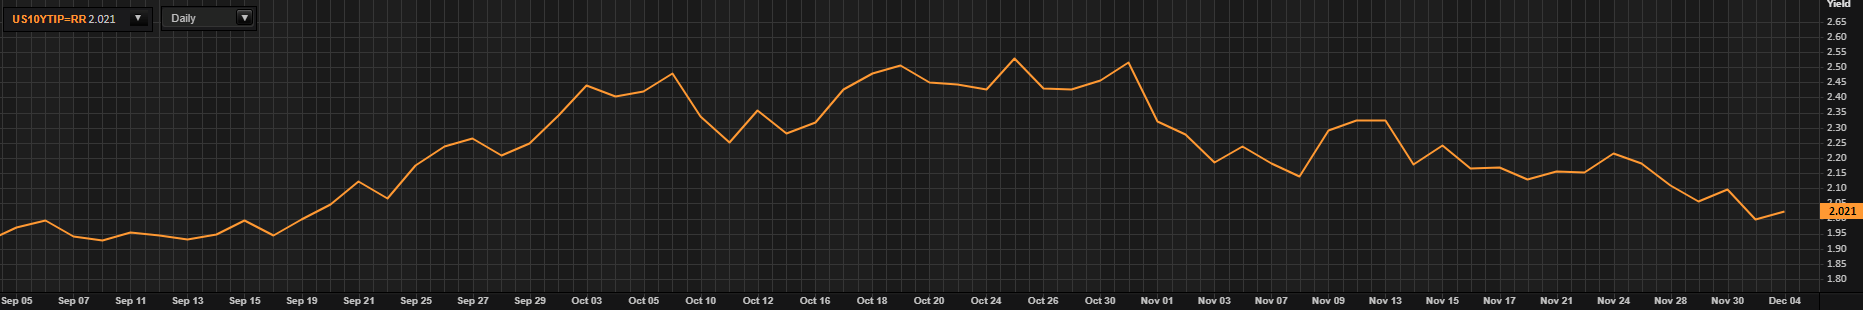
Source: Refinitiv
With no real high impact data today, price action will likely be dictated by updates in Gaza as well as expectations surrounding the upcoming ISM services PMI and Non-Farm Payrolls (NFP) respectively. With many analysts expecting upside surprises, gold may be negatively impacted should this come to fruition.
GOLD ECONOMIC CALENDAR
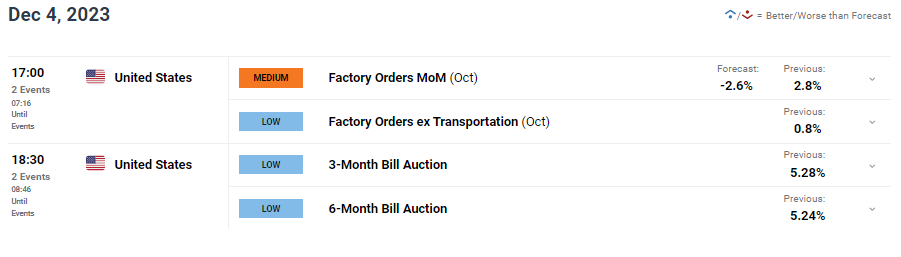
Source: DailyFX
TECHNICAL ANALYSIS
GOLD PRICE DAILY CHART
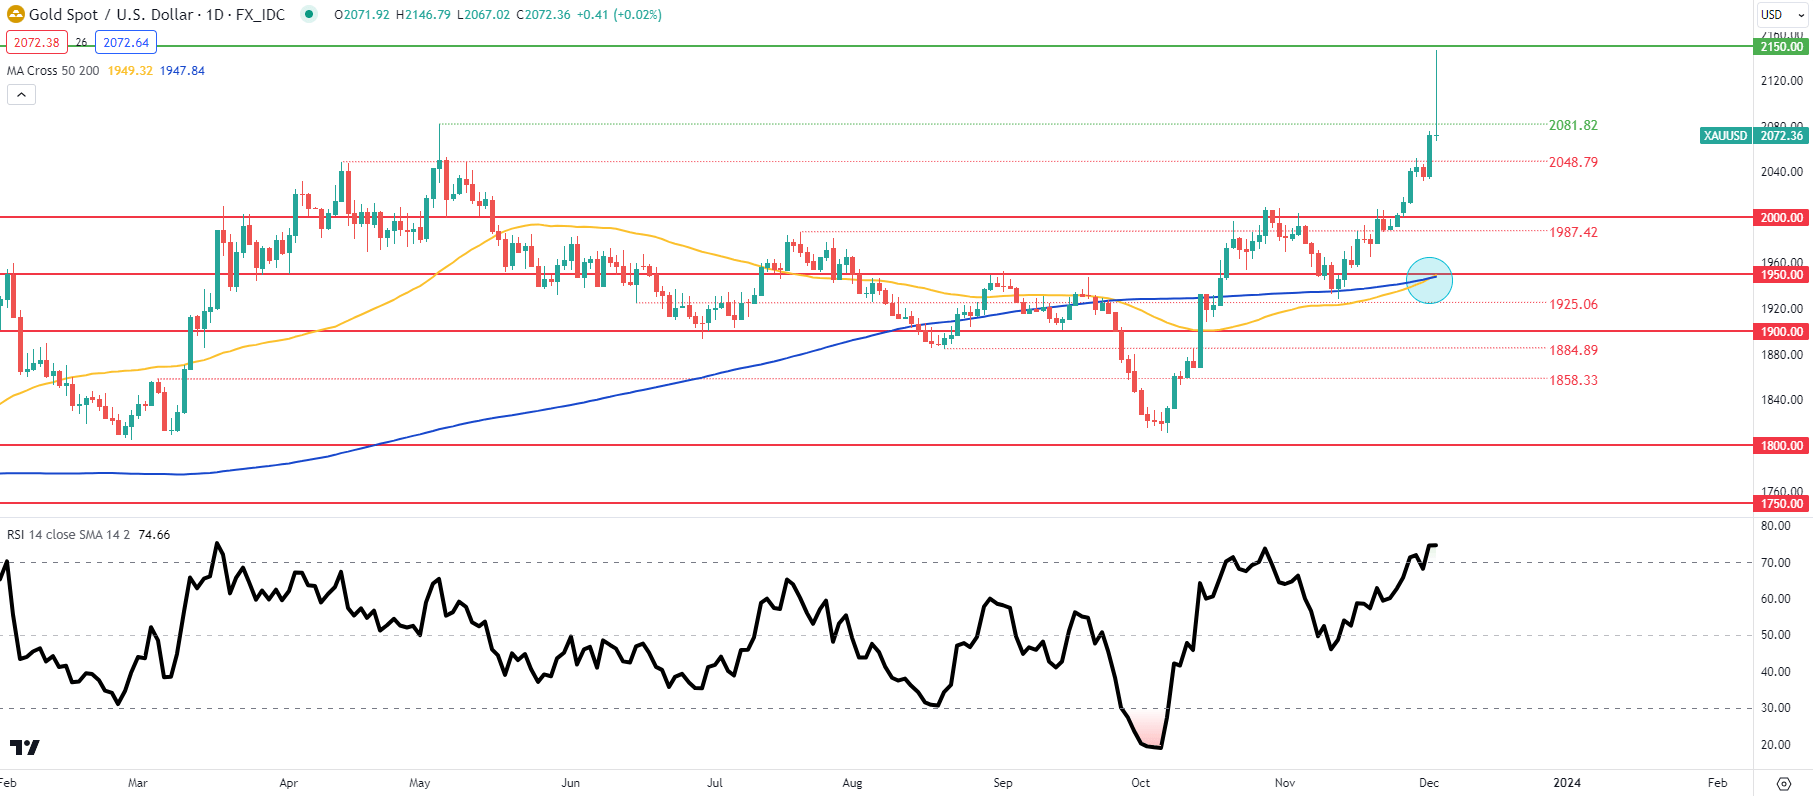
Chart prepared by Warren Venketas , TradingView
The daily XAU/ USD chart above shows the massive rally in early trade with a long upper wick candlestick now forming. Should the candle close in this fashion, bears will be looking for subsequent downside to come which will support fundamental projections for stronger US economic data as mentioned above. Supplementing the bearish bias is the Relative Strength Index (RSI) that remains within the overbought zone. From a bullish perspective, bulls will hold on to some hope as we see the first signs of the golden cross formation (blue).
- 2150.00
- 2081.82
- 2048.79
- 2000.00
- 1987.42
- 1950.00
GOLD IG CLIENT SENTIMENT: MIXED
IGCS shows retail traders are currently net on GOLD, with of traders currently holding short positions.
Introduction to Technical Analysis
Market Sentiment
Recommended by Warren Venketas
Start Course