Gold (XAU/USD) and Silver (XAG/USD) Analysis and Charts
- Gold breaks higher, resistance yields.
- Silver rallies by 2% and outperforms gold.
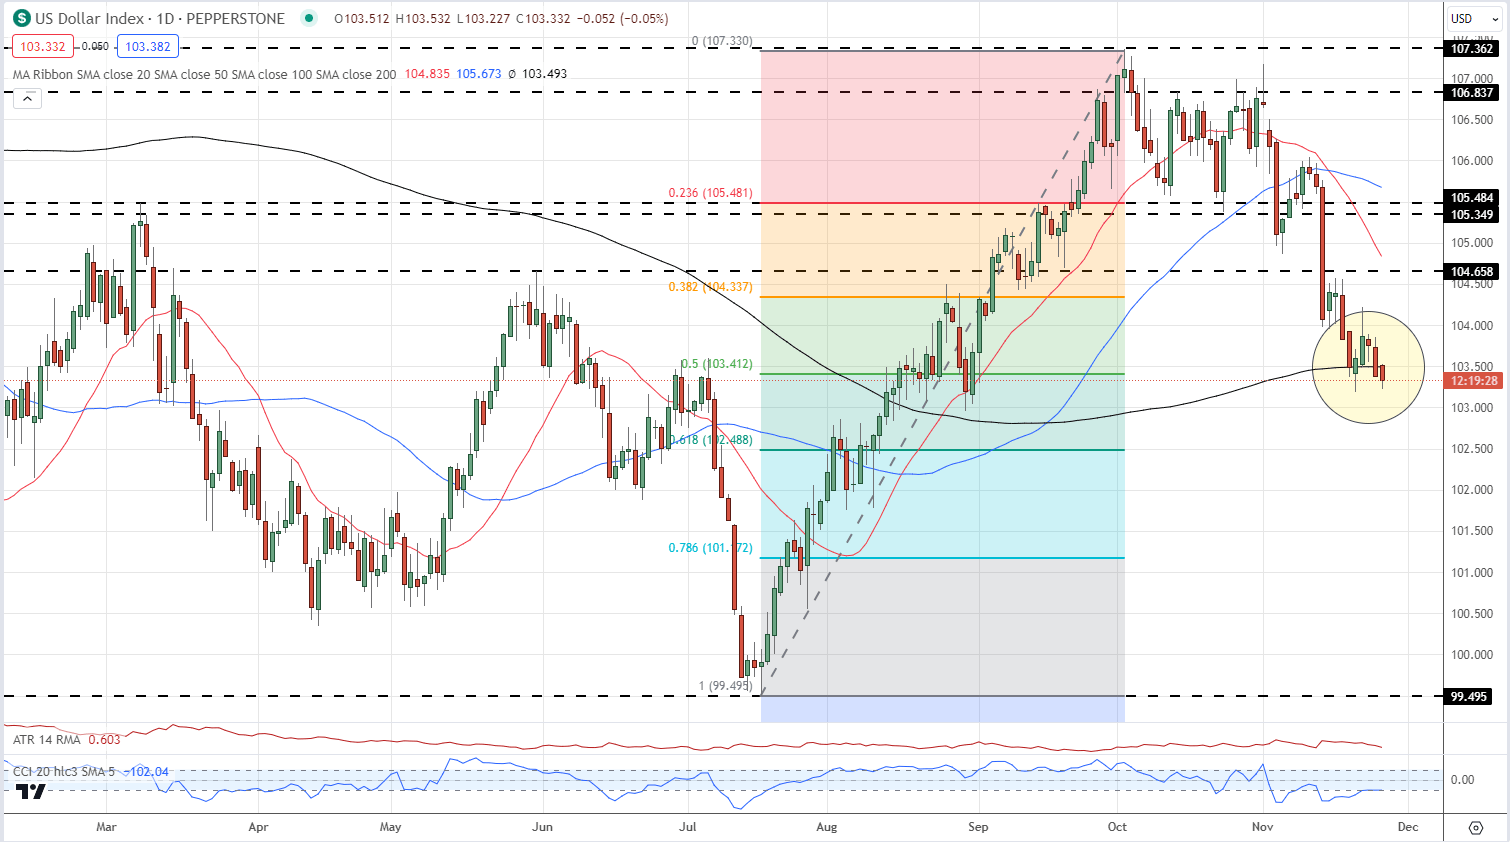
The US dollar is moving back to lows last seen in late August and this is giving the precious metal sector another boost higher. A weaker dollar is seen as a positive for both gold and silver, with demand for the precious metals increasing as gold becomes cheaper in dollar-denominated terms. The US dollar is testing support off its longer-dated simple moving average ( black line) and if this breaks, further losses look likely.
US Dollar Index Daily Chart
The number of traders net-long is 3.18% higher than yesterday and 1.18% lower than last week, while the number of traders net-short is 5.00% lower than yesterday and 18.10% higher from last week.
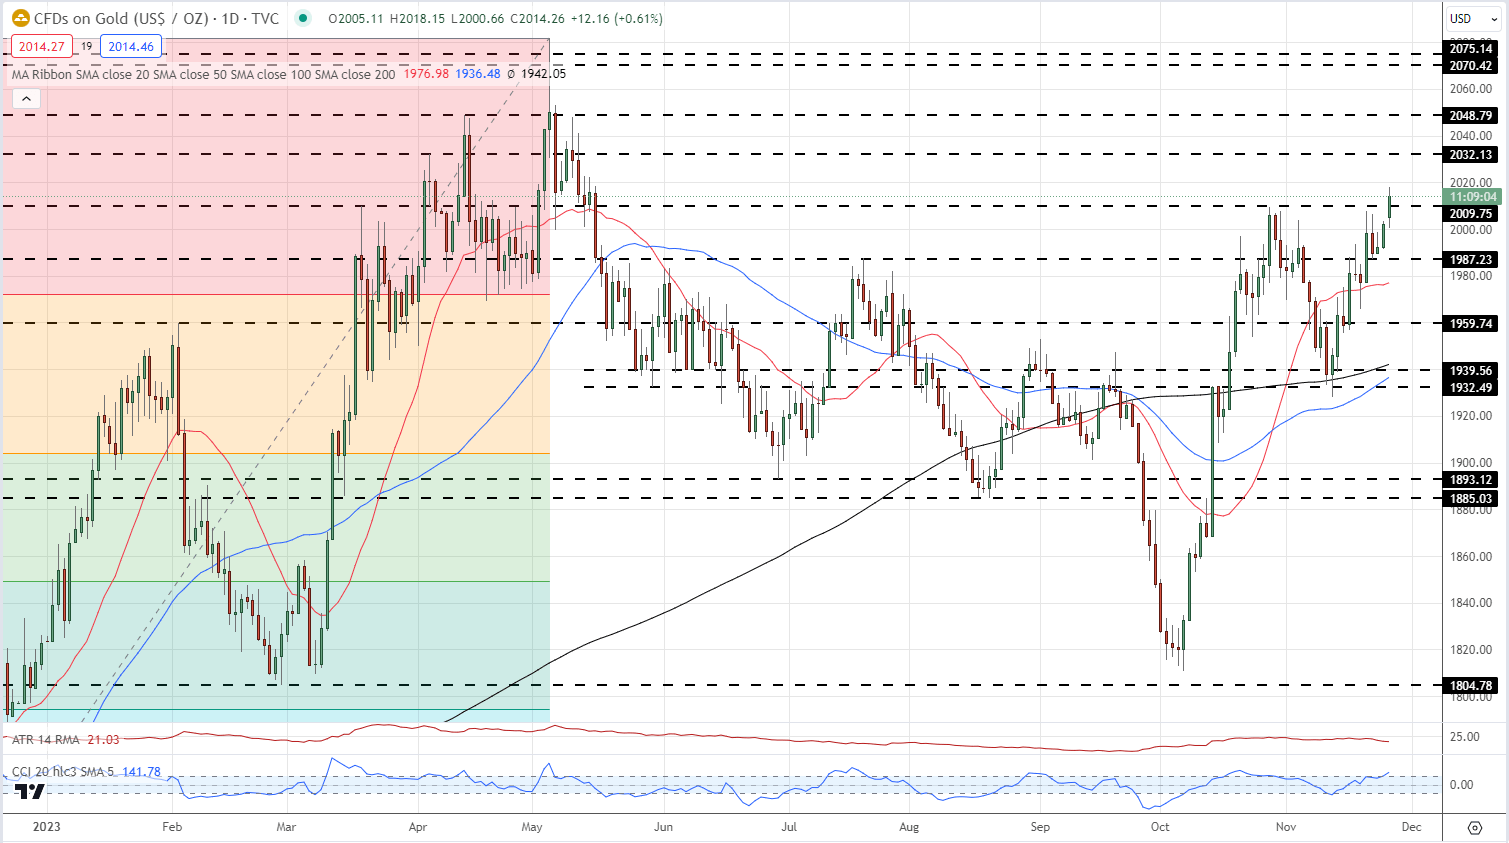
Gold is testing a prior level of resistance at $2,009/oz. and looks set to push higher. A prior level of note at $1,987/oz. is acting as first-line support, with the 20-day simple moving average, currently at $1,976/oz. the next level of interest. A close and open above $2,009/oz. should open the way to $2,032/oz. and $2,049/oz.
Gold Daily Price Chart – November 27, 2023
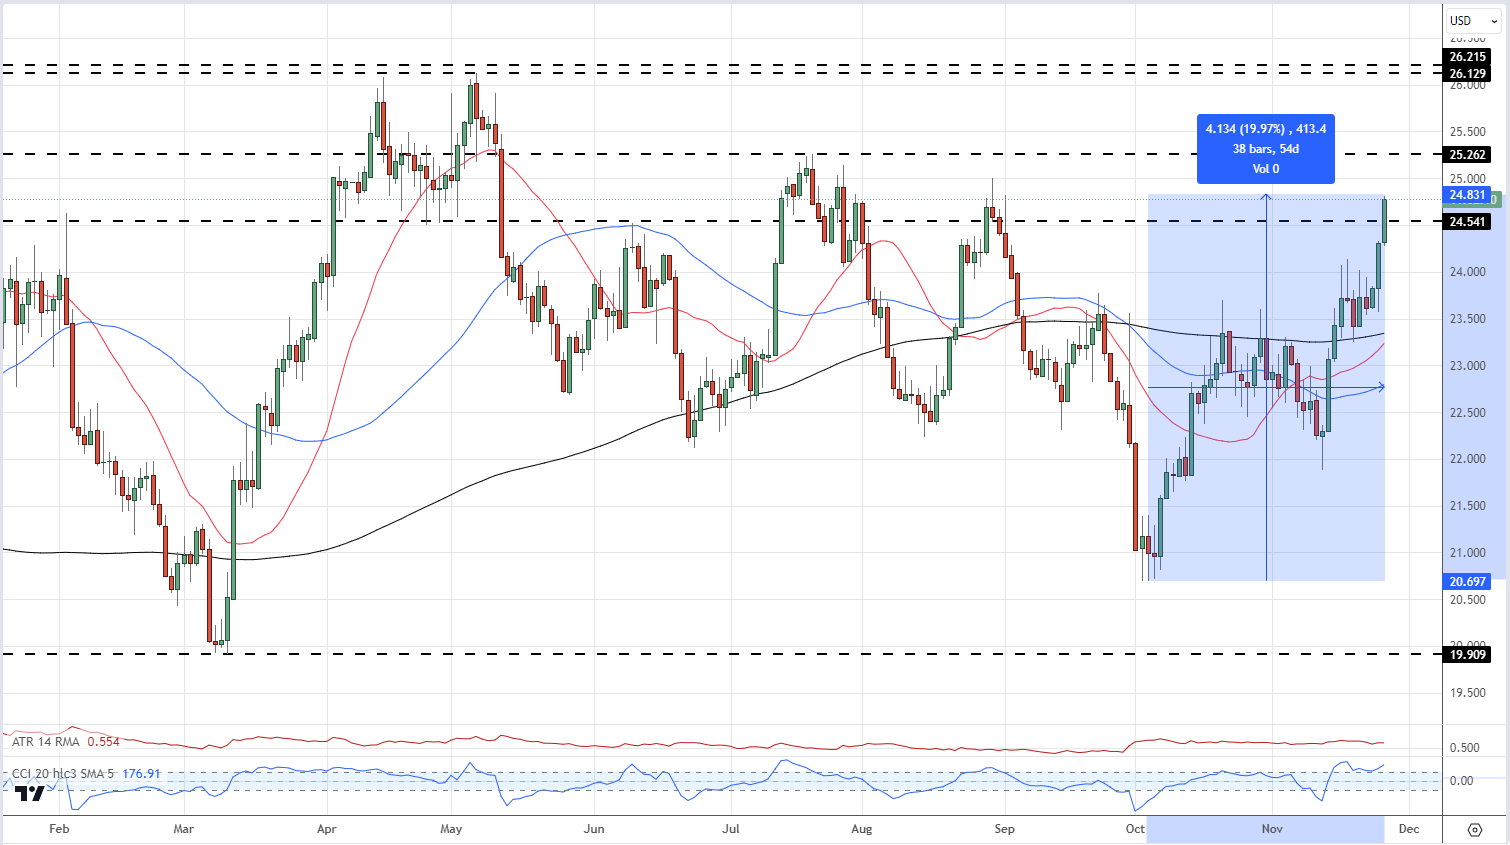
Silver is also moving higher again and is outperforming gold over the last two weeks. Silver has rallied nearly 20% over the last two months and is currently trading at its highest level since late August. The technical setup remains positive and a break above $25.26 will bring $26.13 and $26.21 into play.
Silver Daily Price Chart – November 27, 2023