This article focuses on the technical outlook for EUR/USD , Nasdaq 100 and crude oil (WTI Futures), taking into account sentiment analysis and recent price action dynamics.
EUR/USD FORECAST – TECHNICAL ANALYSIS
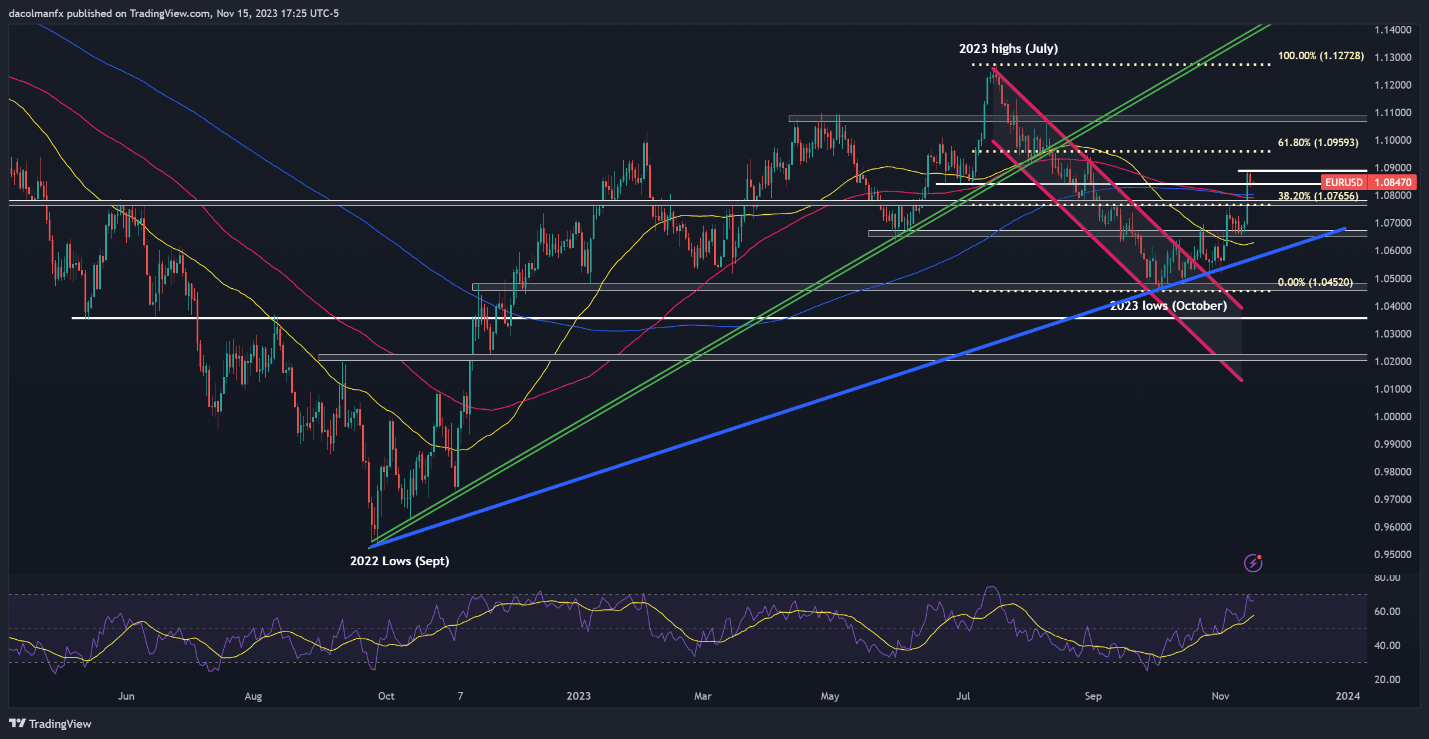
The EUR/ USD retreated on Wednesday, after staging a massive bullish breakout in the previous session. Despite this setback, the euro maintains a positive outlook against the U.S. dollar , with the exchange rate recently printing a sequence of impeccable higher highs and higher lows and currently trading above key moving averages, as shown in the daily chart below.
To validate the bullish thesis, the pair needs to hold above the 200 and 100-day SMA, situated around 1.0765. If this support area remains unbroken and keeps sellers at bay, prices could start consolidating to the upside after a brief period of digestion, setting the stage for a move above the 1.0900 handle and towards Fibonacci resistance at 1.0960. On further strength, the focus shifts to 1.1075.
In the event of sellers regaining firm control of the market and successfully pushing prices below the 1.0765 area, the short-term bias would turn bearish, meaning more losses could be in the cards for the common currency. In such a scenario, a retreat towards 1.0650 becomes plausible, with prolonged weakness elevating the risk of testing trendline support at 1.0570.
EUR/USD TECHNICAL CHART
NASDAQ 100 FORECAST – TECHNICAL ANALYSIS
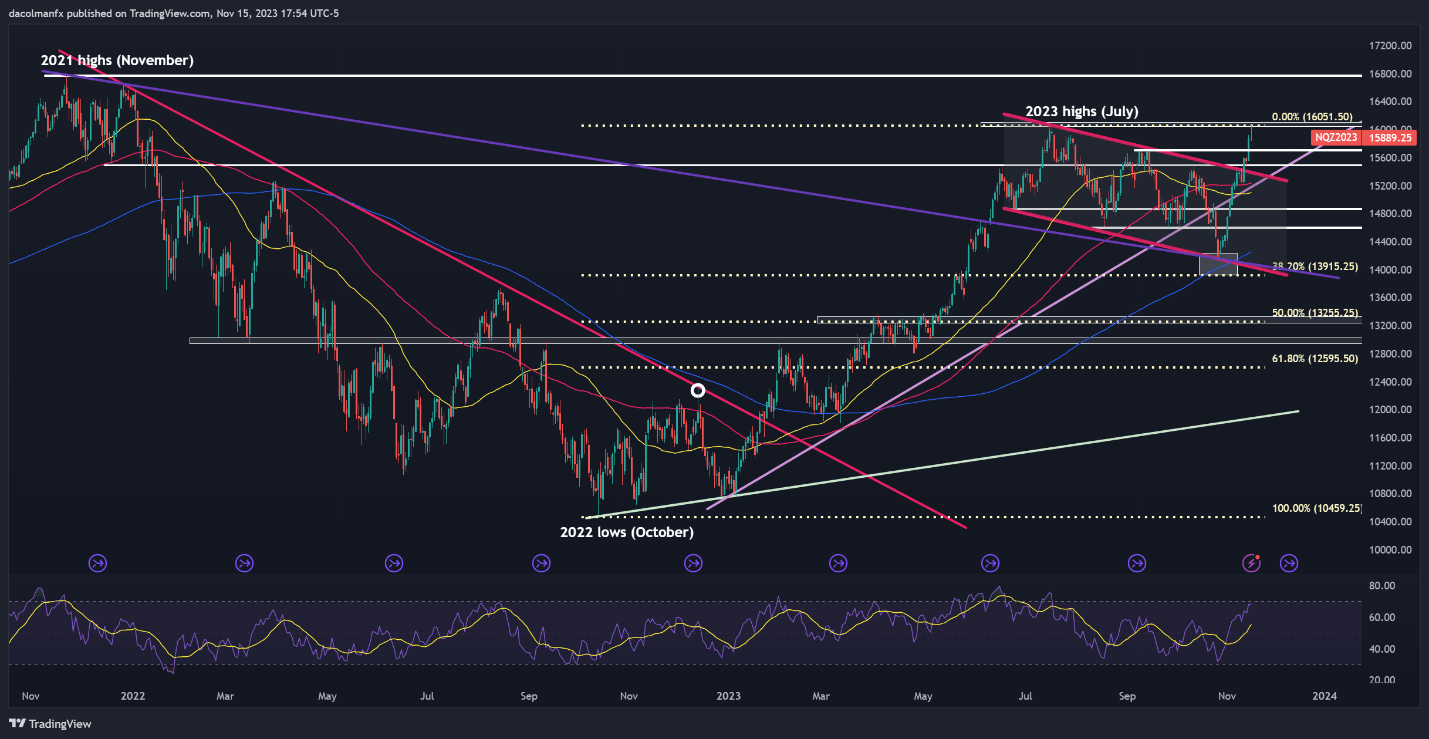
The Nasdaq 100 was subdued on Wednesday, failing to extend the previous session's robust rally, with prices encountering resistance near July’s highs at 16,050. This area will need to be watched closely in the coming days to assess the price reaction and gain perspective on the short-term outlook, bearing in mind two possible scenarios could unfold: a bullish breakout or a bearish rejection.
In the event of a bullish breakout, upward impetus could pick up pace as FOMO mentality drives fresh capital into equities, setting the stage for a challenge of last year’s peak. Conversely, if sellers reject attempts by the bulls to breach resistance at 16,050 and trigger a pullback, initial support appears at 15,720, followed by 15,500/15,400. Further losses could lead to a retracement toward 15,250.
NASDAQ 100 TECHNICAL CHART
OIL PRICES FORECAST – TECHNICAL ANALYSIS
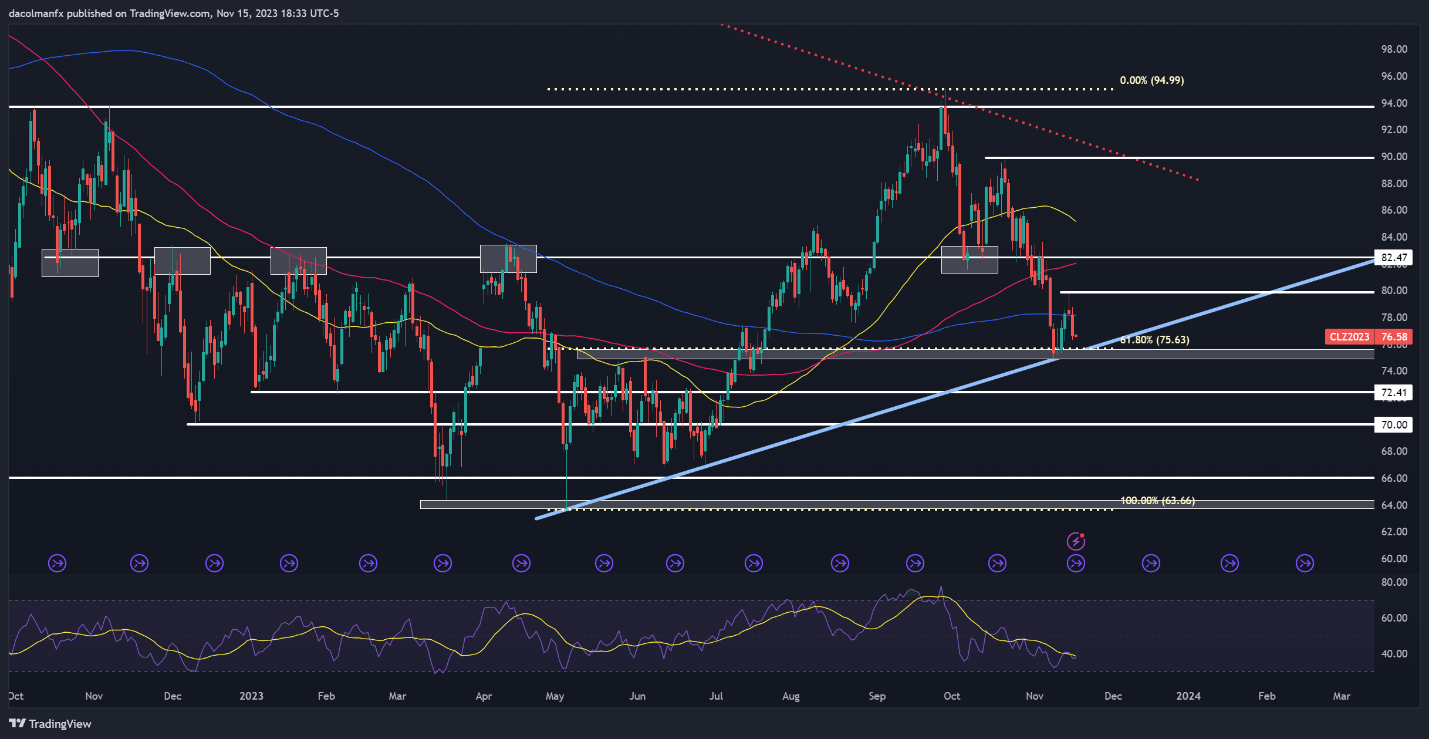
After a brief bounce earlier in the week, crude oil prices (WTI futures) shifted downwards on Wednesday, falling more than 2% and breaking below the 200-day simple moving average – a bearish development from a technical standpoint. If selling pressure intensifies in the coming days, cluster support stretches from $75.65 to $75.00. Continued weakness raises the possibility of descending towards $72.50.
On the other hand, if oil manages to stage a turnaround, the 200-day simple moving average will be the first line of defense against further advances. Though surpassing this technical hurdle might prove hard for the bulls, a breakout could reinvigorate buying enthusiasm, opening the door for a move toward $79.75. On continued strength, the focus shifts to the 50-day SMA, a tad below the $82.50 mark.
CRUDE OIL TECHNICAL CHART