Gold and Silver - Technical and Sentiment Analysis
- Gold remains rangebound but sentiment is bearish
- Silver remains under pressure, support may be tested
For all high-importance data releases and events, see the
Gold prices are inching upward, recovering about half of Monday's losses, as tensions escalate over potential Iranian retaliation against Israel. Following the death of Hamas leader Ismail Haniyeh last week, Iran has openly vowed retribution, stoking concerns of an imminent attack. This development has intensified fears of a broader conflict in the Middle East, driving investors towards the safe-haven asset. Global conflicts and political instability often increase gold demand as governments and individuals seek to protect their wealth.
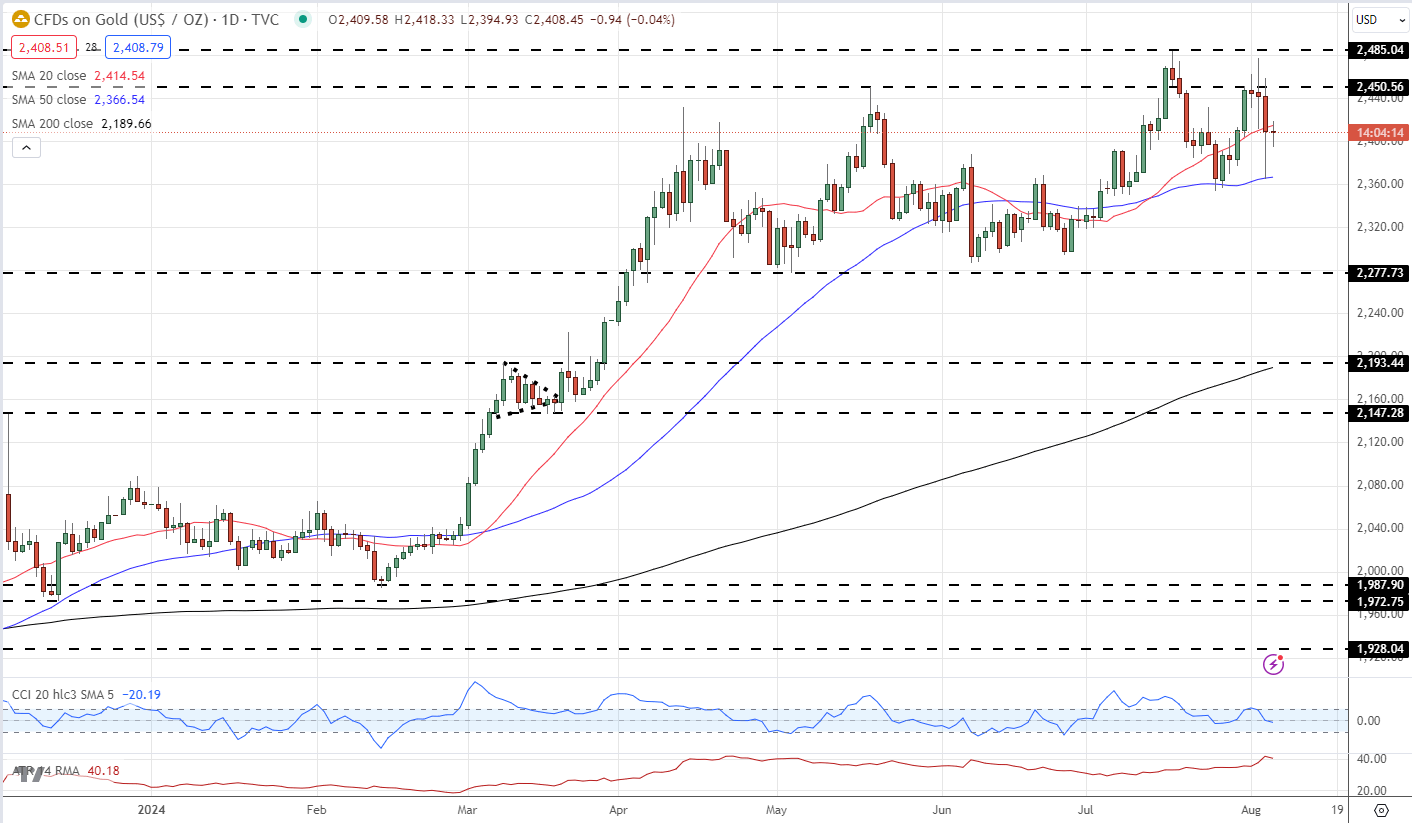
Gold remains within a well-defined multi-month range with the precious metal testing, and briefly breaking, resistance before falling back. The short-term outlook remains mixed with the 50-day sma proving support while the 20-day sma acts as near-term resistance. The multi-month series of higher lows remains in place, while a break above $2,485/oz. is needed to keep a series of higher highs in place.
Gold Price Daily Chart
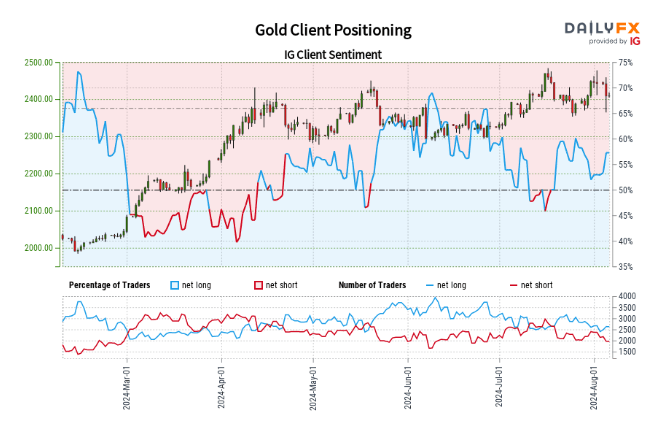
Retail trader data shows 57.69% of traders are net-long with the ratio of traders long to short at 1.36 to 1.The number of traders net-long is 7.05% higher than yesterday and 5.31% lower than last week, while the number of traders net-short is 9.89% lower than yesterday and 13.35% lower than last week.
We typically take a contrarian view to crowd sentiment, and the fact traders are net-long suggests Gold prices may continue to fall. Traders are further net-long than yesterday and last week, and the combination of current sentiment and recent changes gives us a stronger Gold-bearish contrarian trading bias.
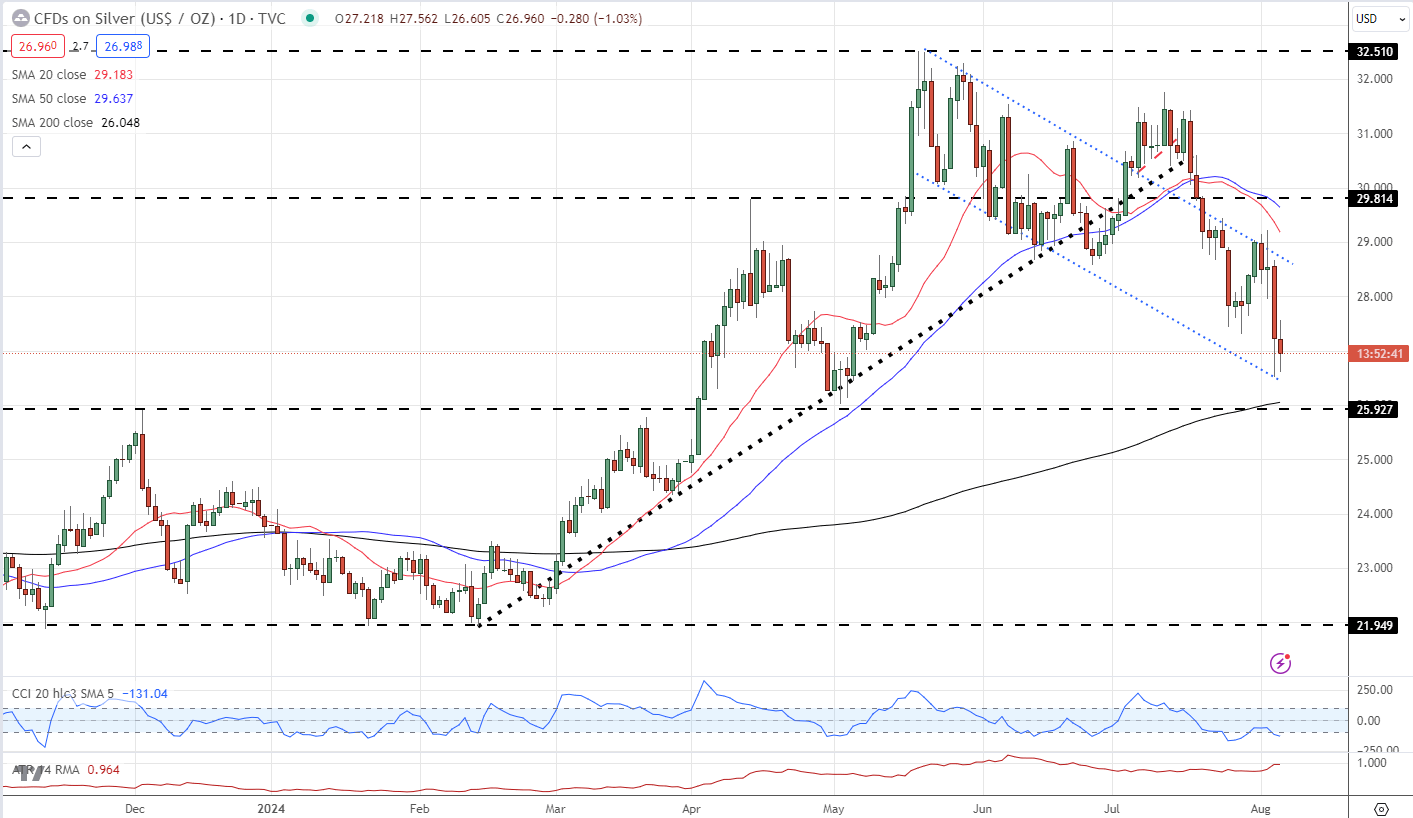
Silver continues to underperform gold with repeated sharp selloffs since mid-May keeping pressure on the precious metal. Silver is below both the downward pointing 20- and 50-day smas and is closing in on the supportive 200-day sma. A rough bullish flag formation can be seen on the daily chart since mid-May, and this again held another sharp sell-off yesterday. Silver is currently closing in on an important area around $25.90/oz that consists of flag support, horizontal support and the 200-day sma. If this area holds, then Silver will look to retest $30/oz. or higher in the coming weeks.
Silver Price Daily Chart
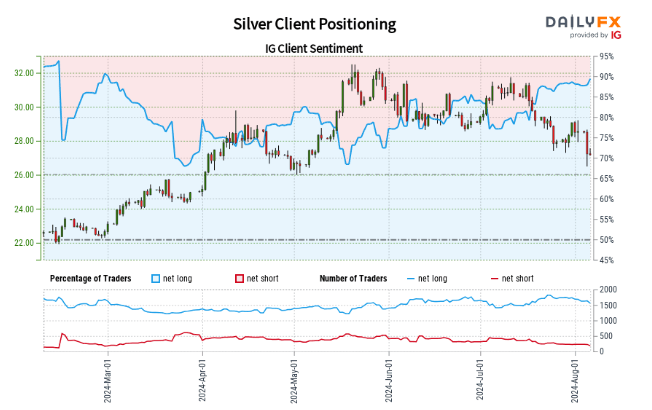
Retail trader data shows 89.79% of traders are net-long with the ratio of traders long to short at 8.79 to 1.The number of traders net-long is 2.05% lower than yesterday and 8.17% lower than last week, while the number of traders net-short is 21.15% lower than yesterday and 25.10% lower than last week.
We typically take a contrarian view to crowd sentiment, and the fact traders are net-long suggests Silver prices may continue to fall. Traders are further net-long than yesterday and last week, and the combination of current sentiment and recent changes gives us a stronger Silver-bearish contrarian trading bias.